ICP Platform Monitoring and Logging Features
In this lab exercise you will learn about the monitoring options for Event Streams and to review logs for troubleshooting.
Introduction
This lab is concerned with exploring additional monitoring and logging features of the underlying ICP platform. The primary interface which is expected to be used for monitoring is the Event Streams Toolbox UI (user interface) as this contains features which are specific and meaningful in a Kafka, and hence Event Streams, context. ICP includes the “ELK” stack (Elasticsearch, Logstash and Kibana) components to provide a common monitoring and logging framework. Describing the full capabilities of the ELK stack components are beyond the scope of this lab, but there are various articles and tutorials on the internet if you have an interest or need to explore more deeply.
These ELK related features of ICP are useful to understand to a basic level and which deserve some attention for the following situations:
-
It is intended to exploit the ELK stack for monitoring as a preferred and consistent approach. This may be the case where ICP has been selected as the container orchestration and deployment platform or there may already be experience is configuring and using ELK stacks.
-
Where trying to do problem determination by examining and searching information in the logs
Monitoring
The monitoring framework is built around Grafana which allows features for rich customization of monitoring dashboards which may either be included with an ICP distribution, as samples with products available in the ICP catalog or created by the customer based on their specific requirements.
At the time of writing, an example sample dashboard was not included in the IBM Event Streams GA helm chart distribution, but can be obtained from a github repository. The following instructions describes the latter approach.
-
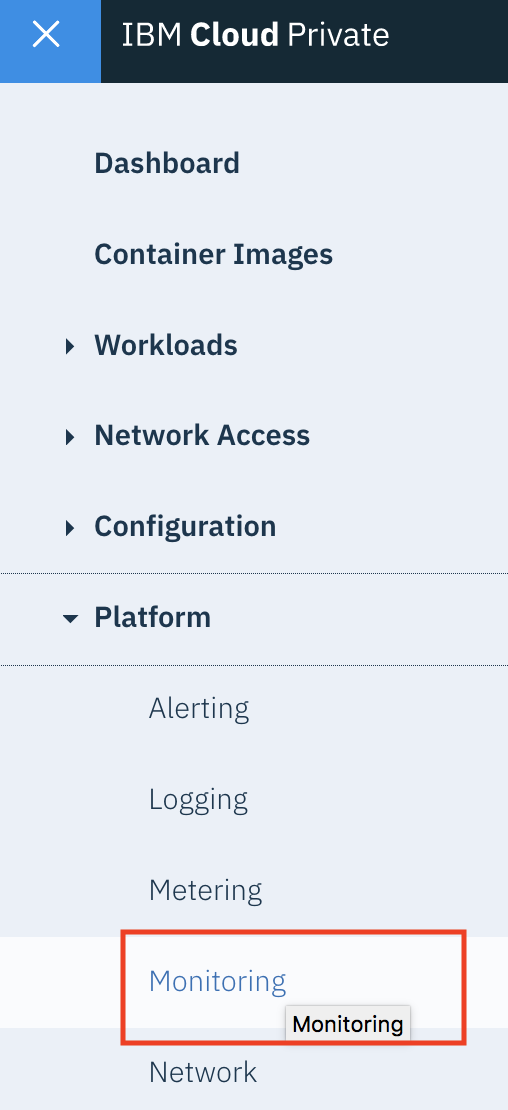
From the navigator, select Platform -> Monitoring:
-
The Grafana interface opens in another browser tab/window. An example / sample dashboard for Event Streams is made available which you can import into Grafana.
-
You can obtain the sample dashboard definition from github at:
-
Either download the file ibm-eventstreams-grafanadashboard.json to your environment or copy it to the clipboard.
-
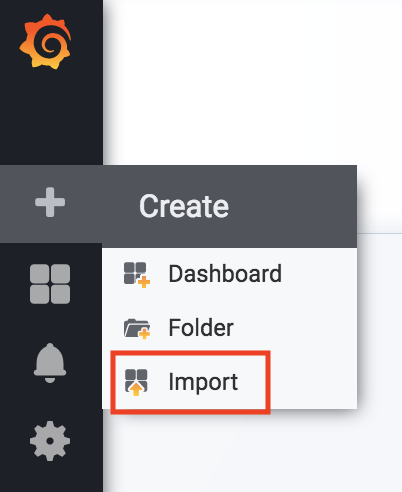
From the home page, click on the “+” sign and the Import:
-
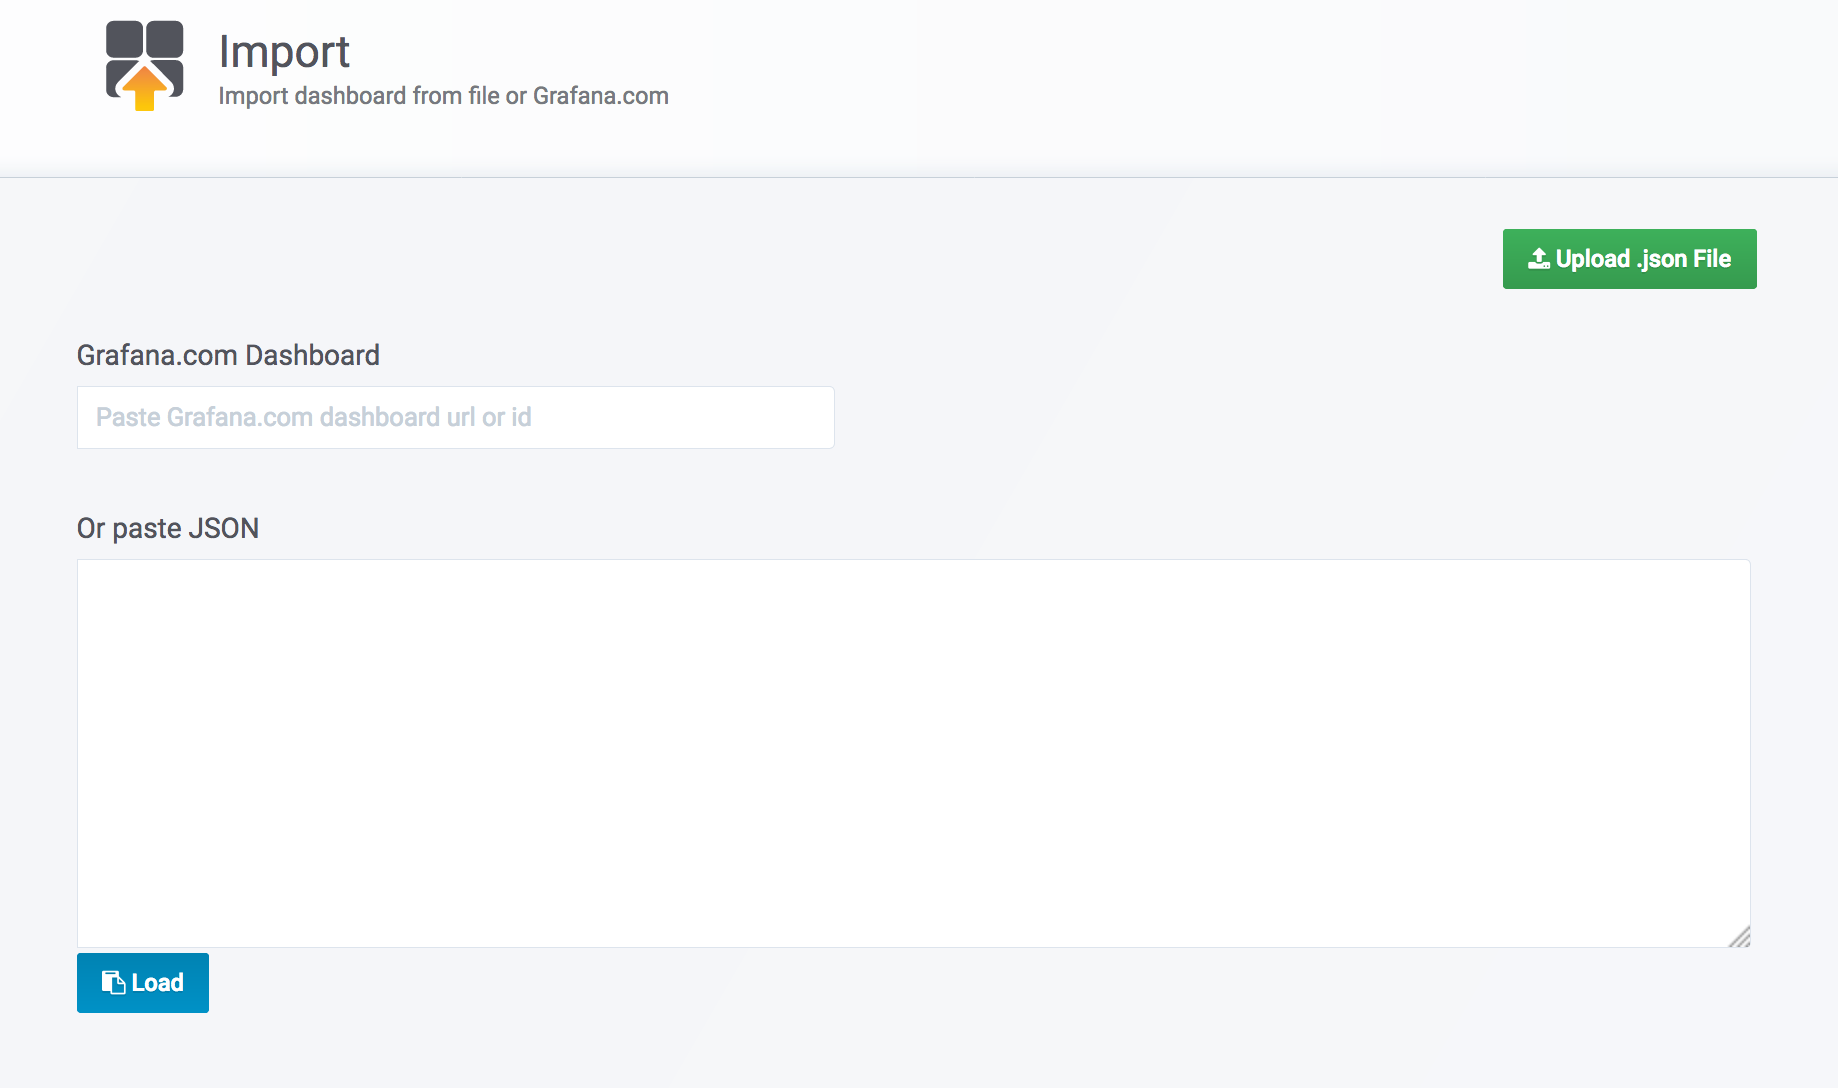
Either upload the JSON file or paste the contents into the importer and press Load:
-
Select and open the IBM Event Streams dashboard.
-
Ensure that the Event Streams dashboard specifies the correct namespace and release for your deployed environment:
Warning:
If you have done the previous labs, your release should be eslab, not esv1 as shown in the screen shot.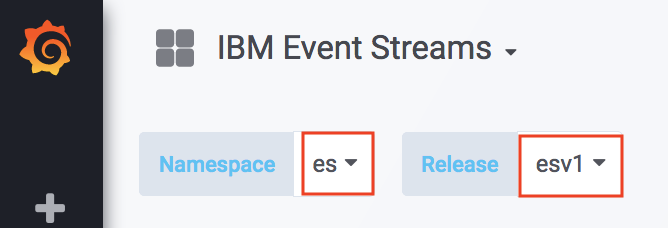
-
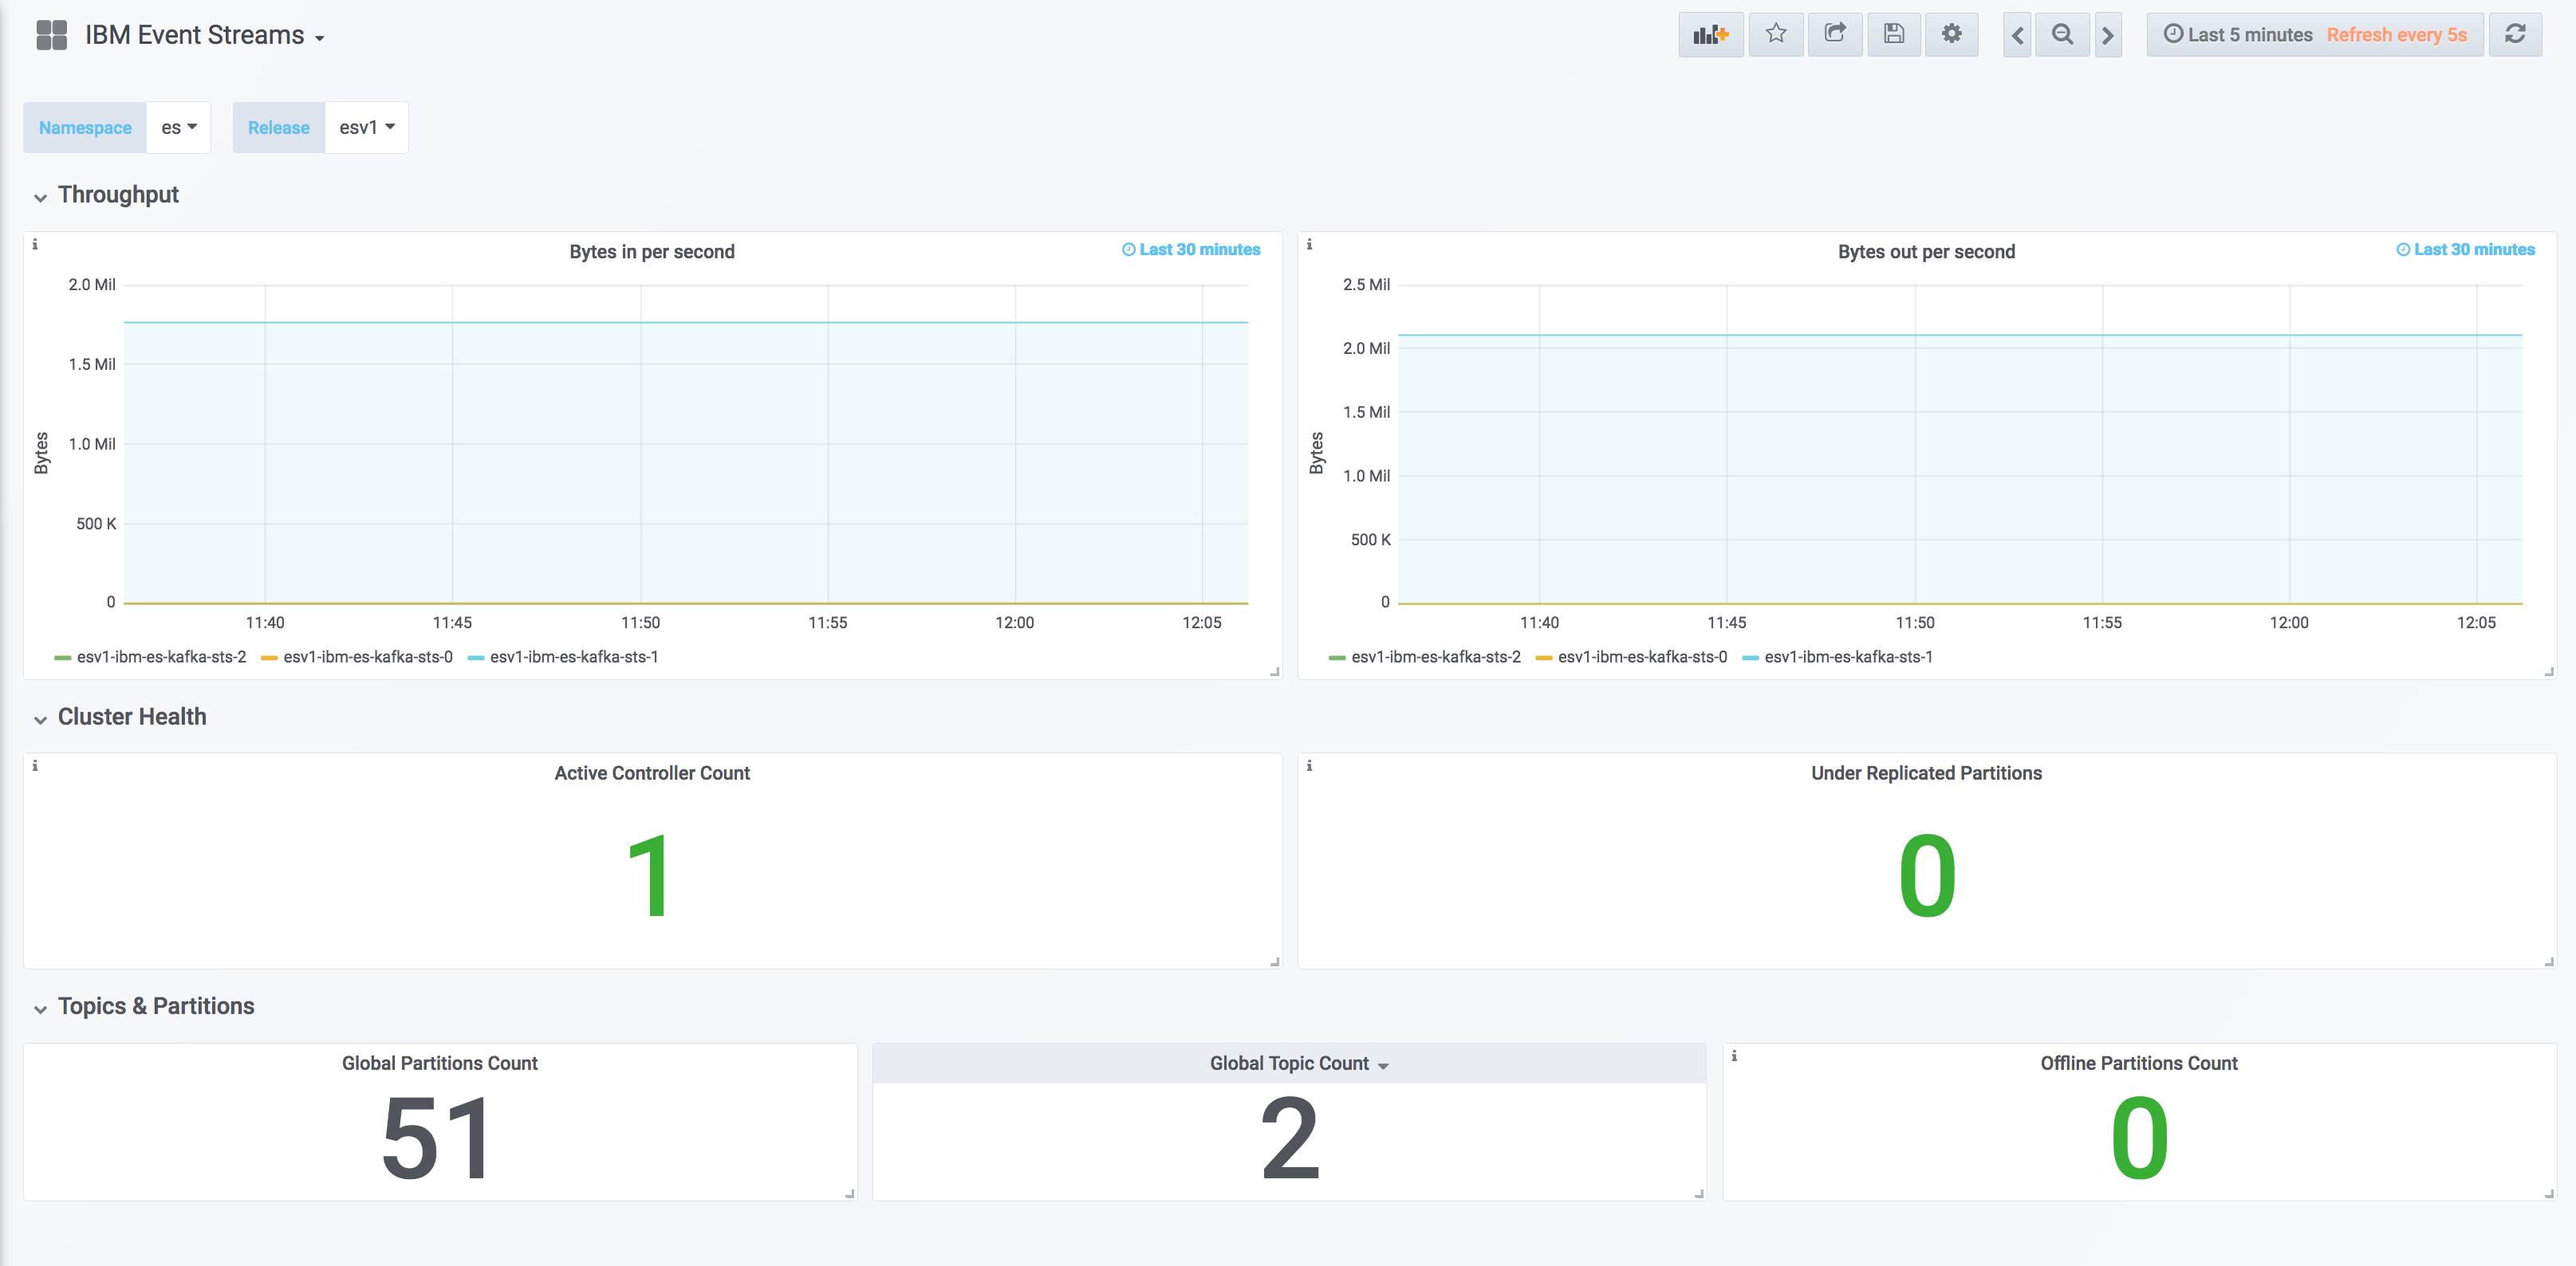
The dashboard will initially start with default/null values until it refreshes with the latest data, and will then appear as follows:
-
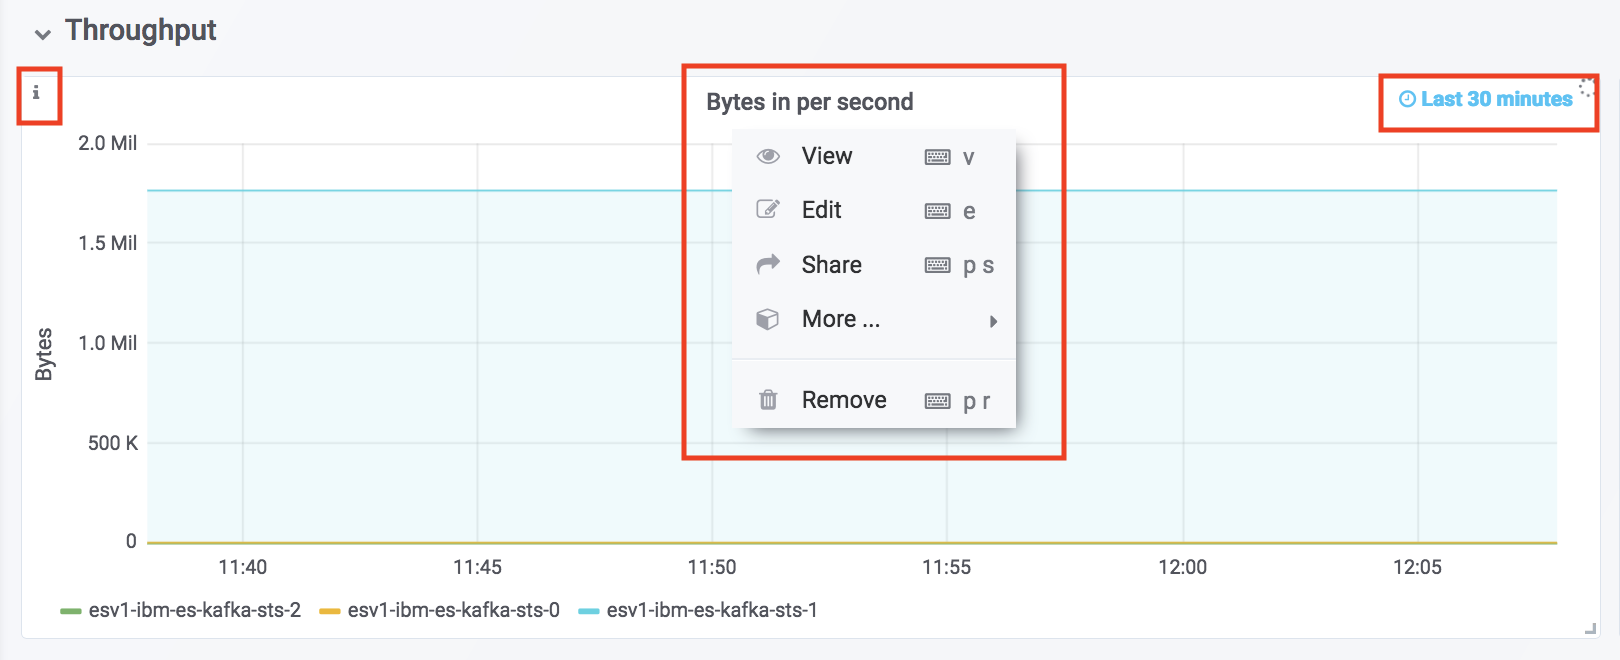
Use one of the dashboard window panes to explore the layout. In the top right, you will see the display interval. In the left you will see an Information indicator which, when hovered over will display any contextual help information you supply. Clicking on the title allows you to manipulate the pane, including the ability to edit its definition.
-
Let’s try to create a new panel to monitor another metric available in Kafka. From the dashboard, select the Add Panel button in the top-right:

-
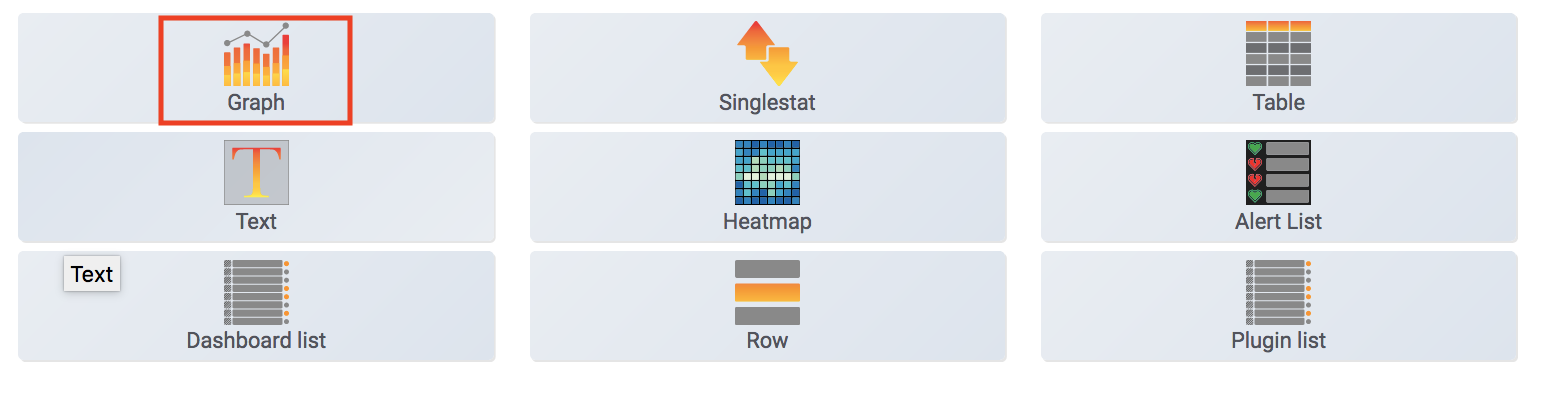
Select the Graph button:
-
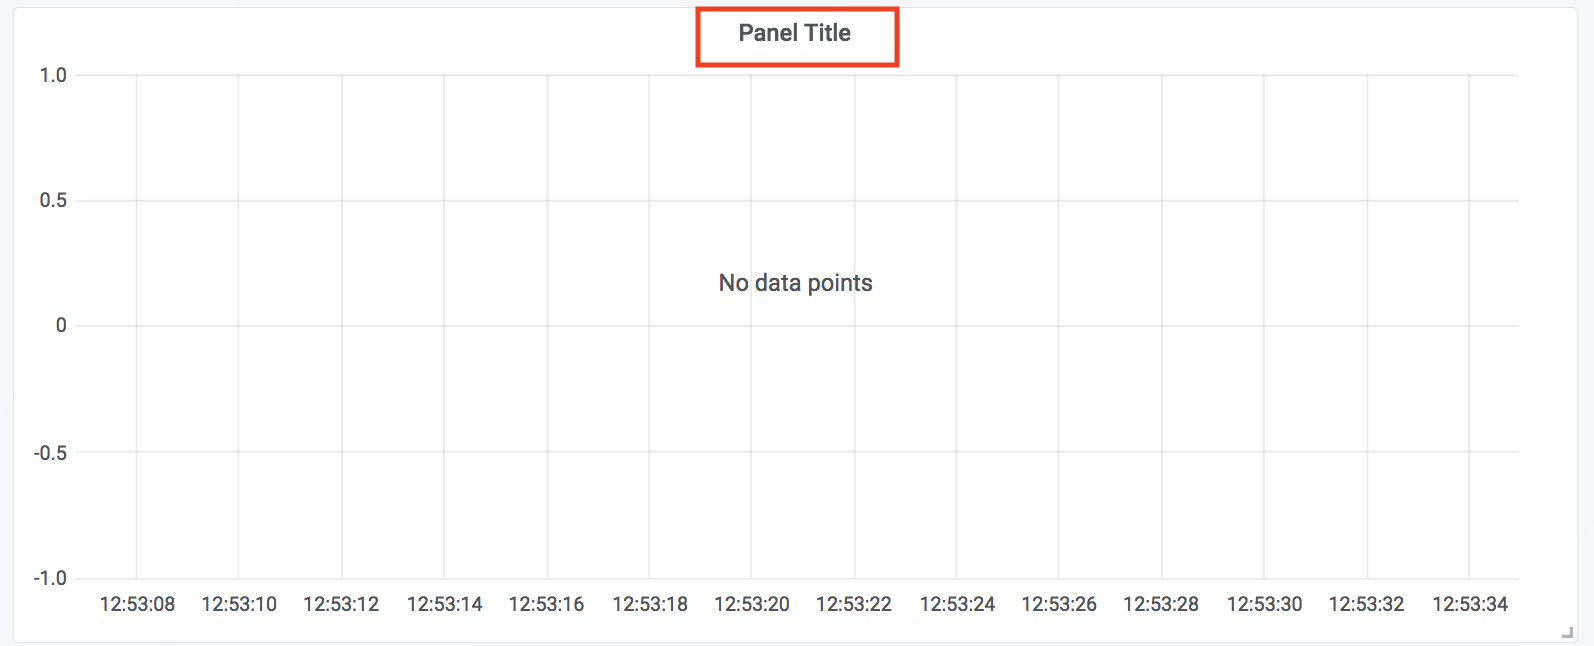
An empty panel is displayed. Click on the title bar to configure it:
-
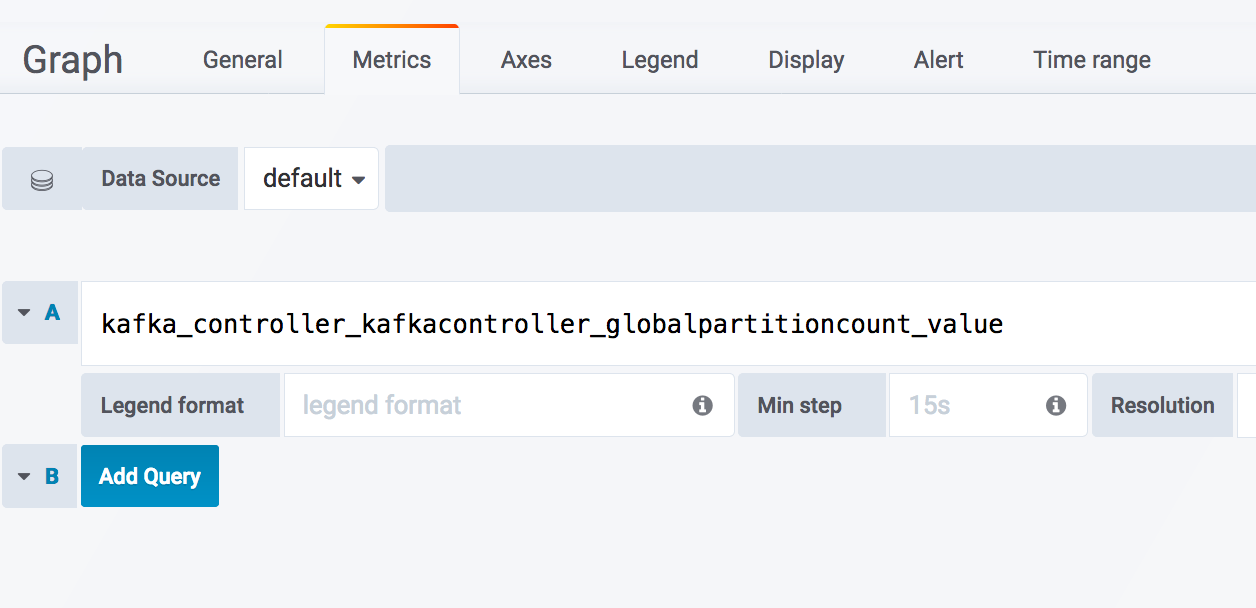
In the first query input field, start typing “kafka” and a drop-down list of the metrics with names starting with “kafka” are displayed. These are the metrics which are provided with the Kafka distribution. As an example, select the one shown below to display in the panel:
-
Switch to the General tab of the Graph definition. Set a title for the panel. Then return to the dashboard by clicking on the arrow in the top right:
-
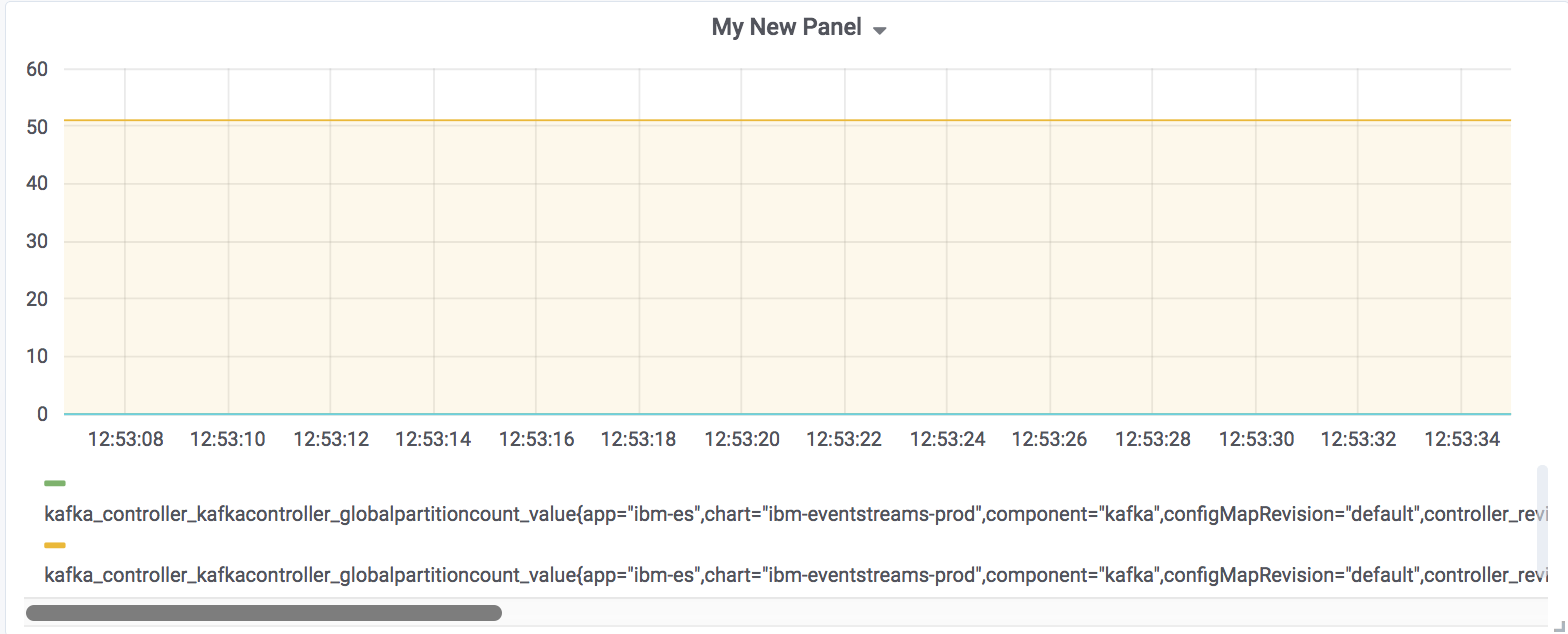
Your basic panel is now displayed:
-
If you wish, take a few minutes to explore, or experiment with, the other aspects of the Grafana interface.
Logging
The logging framework of ELK is typically accessed either:
-
by navigating from a selected component in the ICP console, where the query will have been constructed automatically so that only the logging information for that component will be displayed.
-
by launching the Kibana discovery dashboard where you can build or run previously saved queries to examine logging information,
In the first case, you may have observed that the Event Streams user interface is reporting a specific pod (or container) has some issues, so you want to examine the logging information to understand what may be occurring:
-
From the navigator, select Workloads -> Helm Releases.
-
Find the deployed release of Event Streams:

-
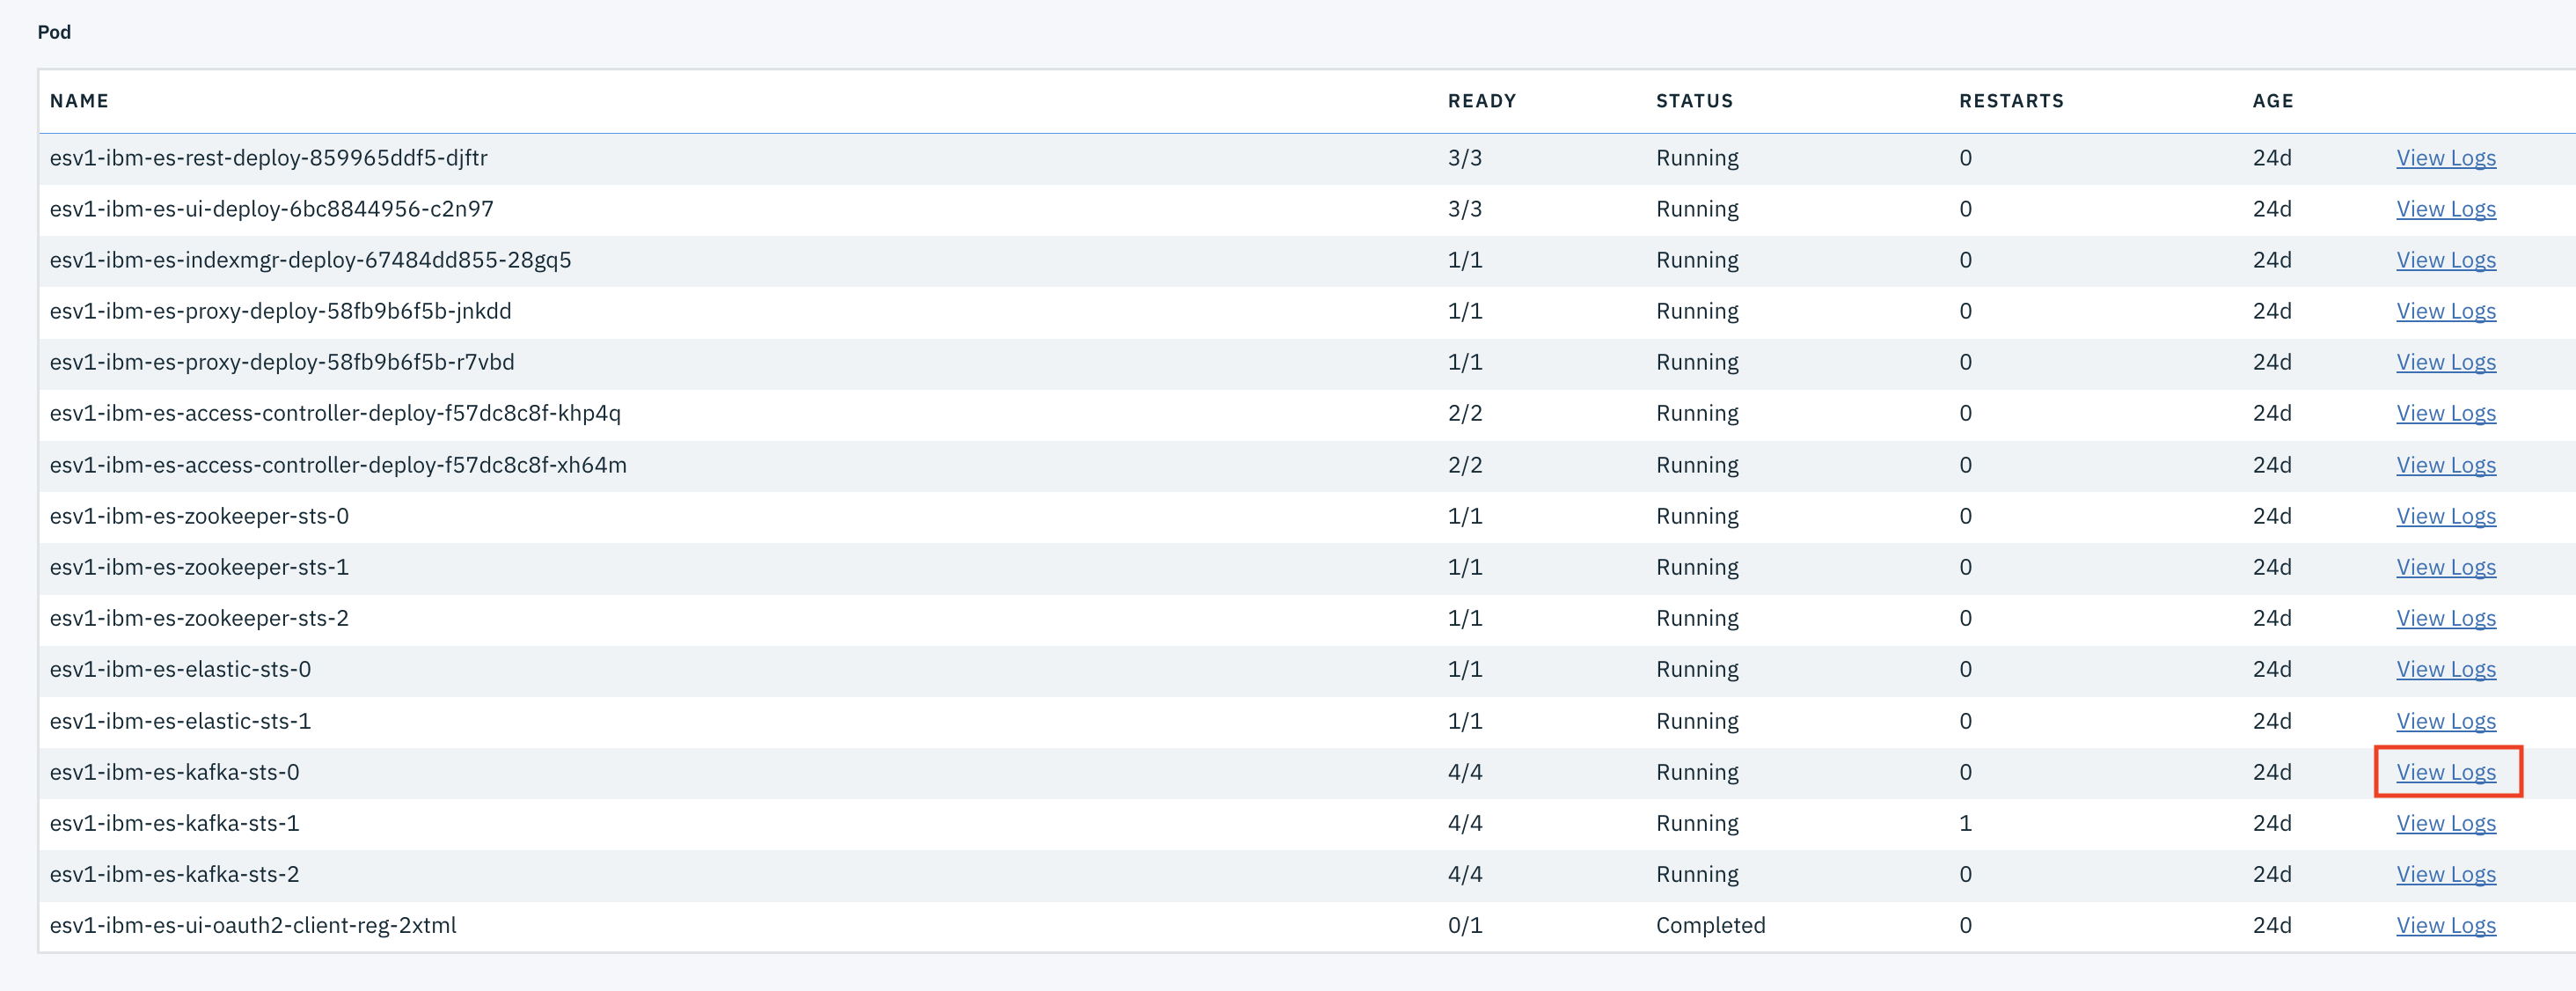
Click on the name to display the list of details for the release. Scroll down to the section for Pods.
-
Locate the pod you wish to examine logging information for and select View Logs.
-
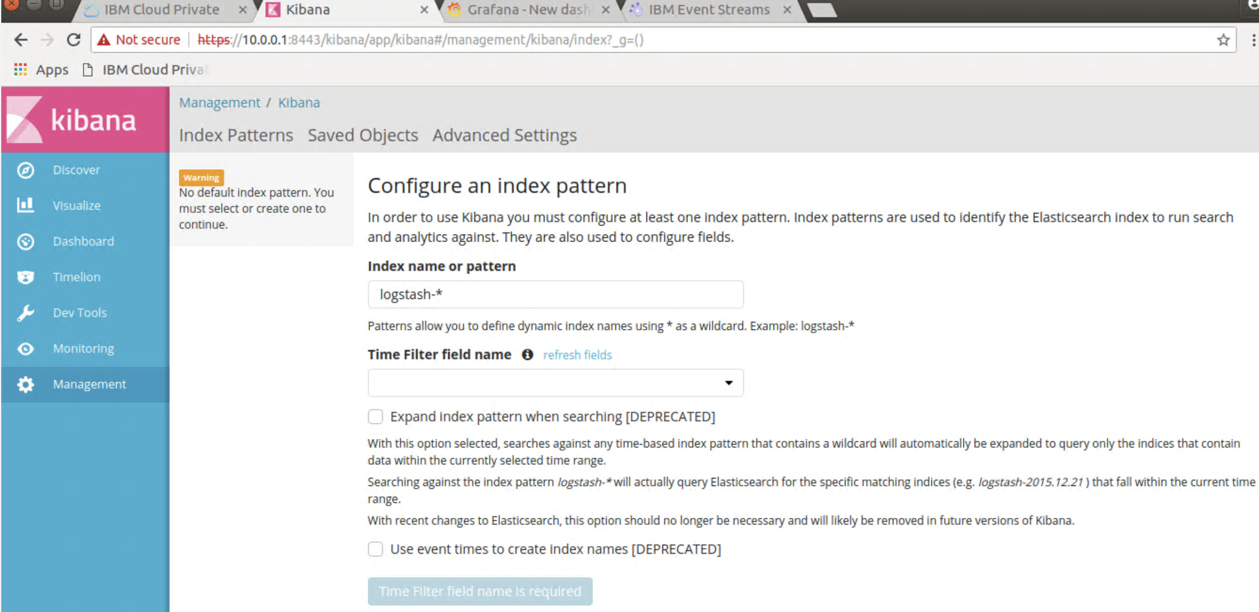
Kibana opens and if this is the first time in Kibana, you will need to setup the index pattern. From the drop down select “@timestamp:” and then press create.
-
Close the browser window and re-launch from the “View Logs” link.
-
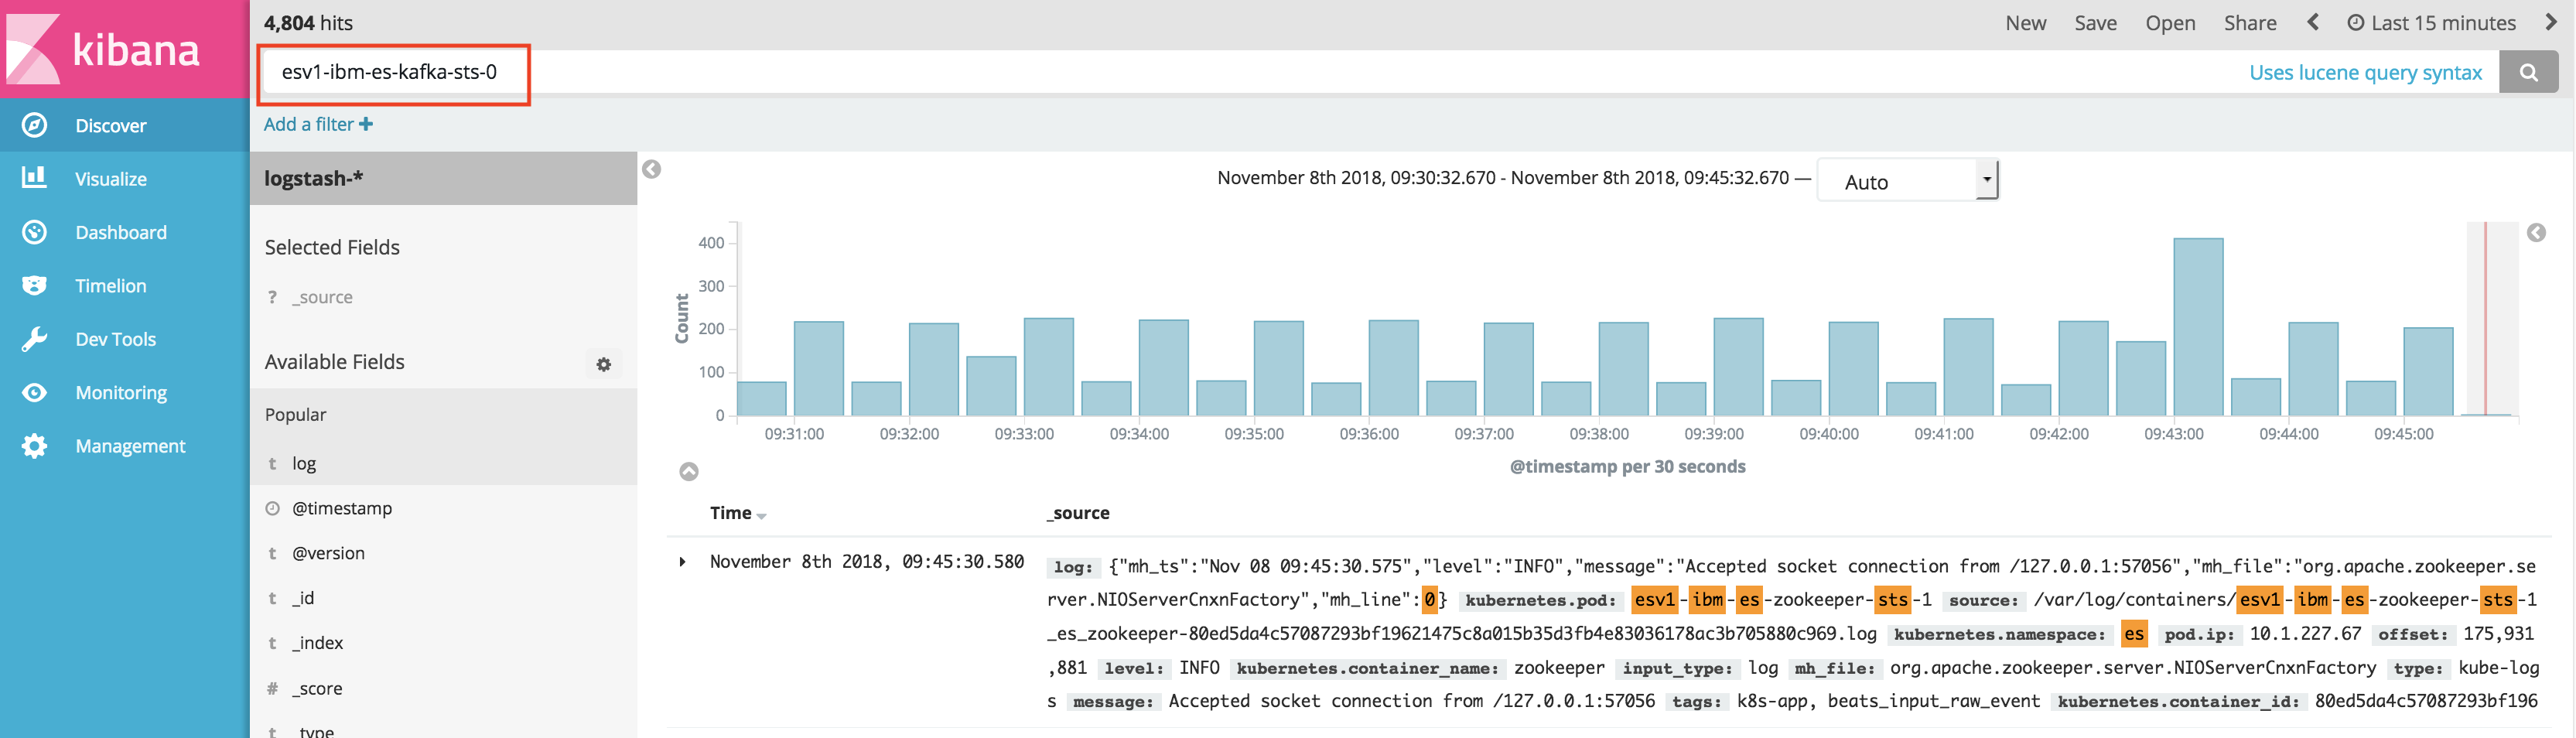
The Kibana discovery dashboard opens in a new browser tab/window:
-
Note that the name of the pod was already set in the search window and that this has caused a query to execute and return matching logging information.
-
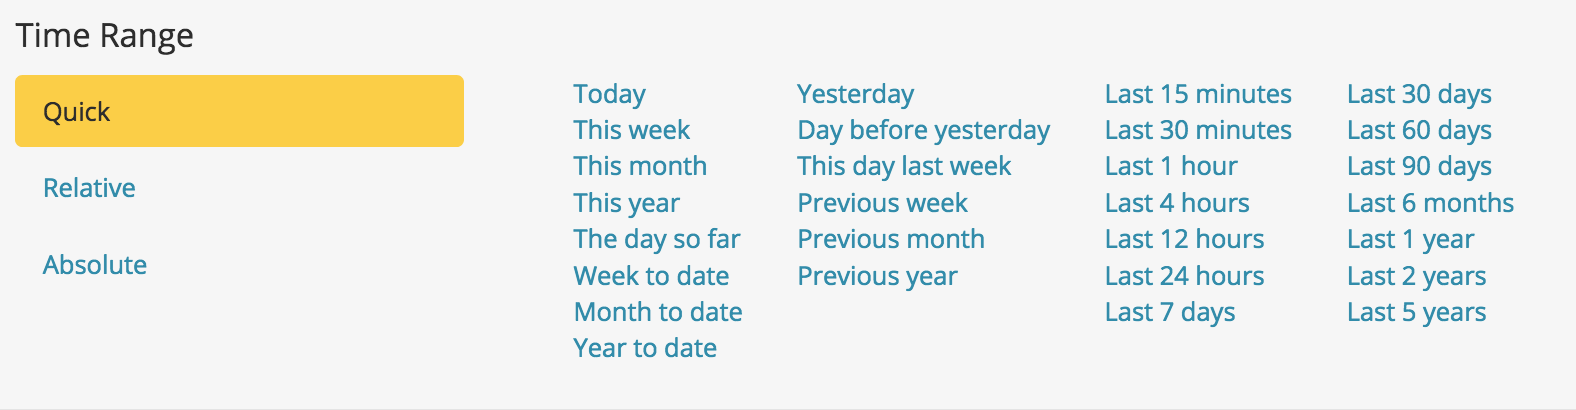
Click on the time selector at the top right of the window. You will see that there is fine-grained control of how to select the period of monitoring data you wish to display:
-
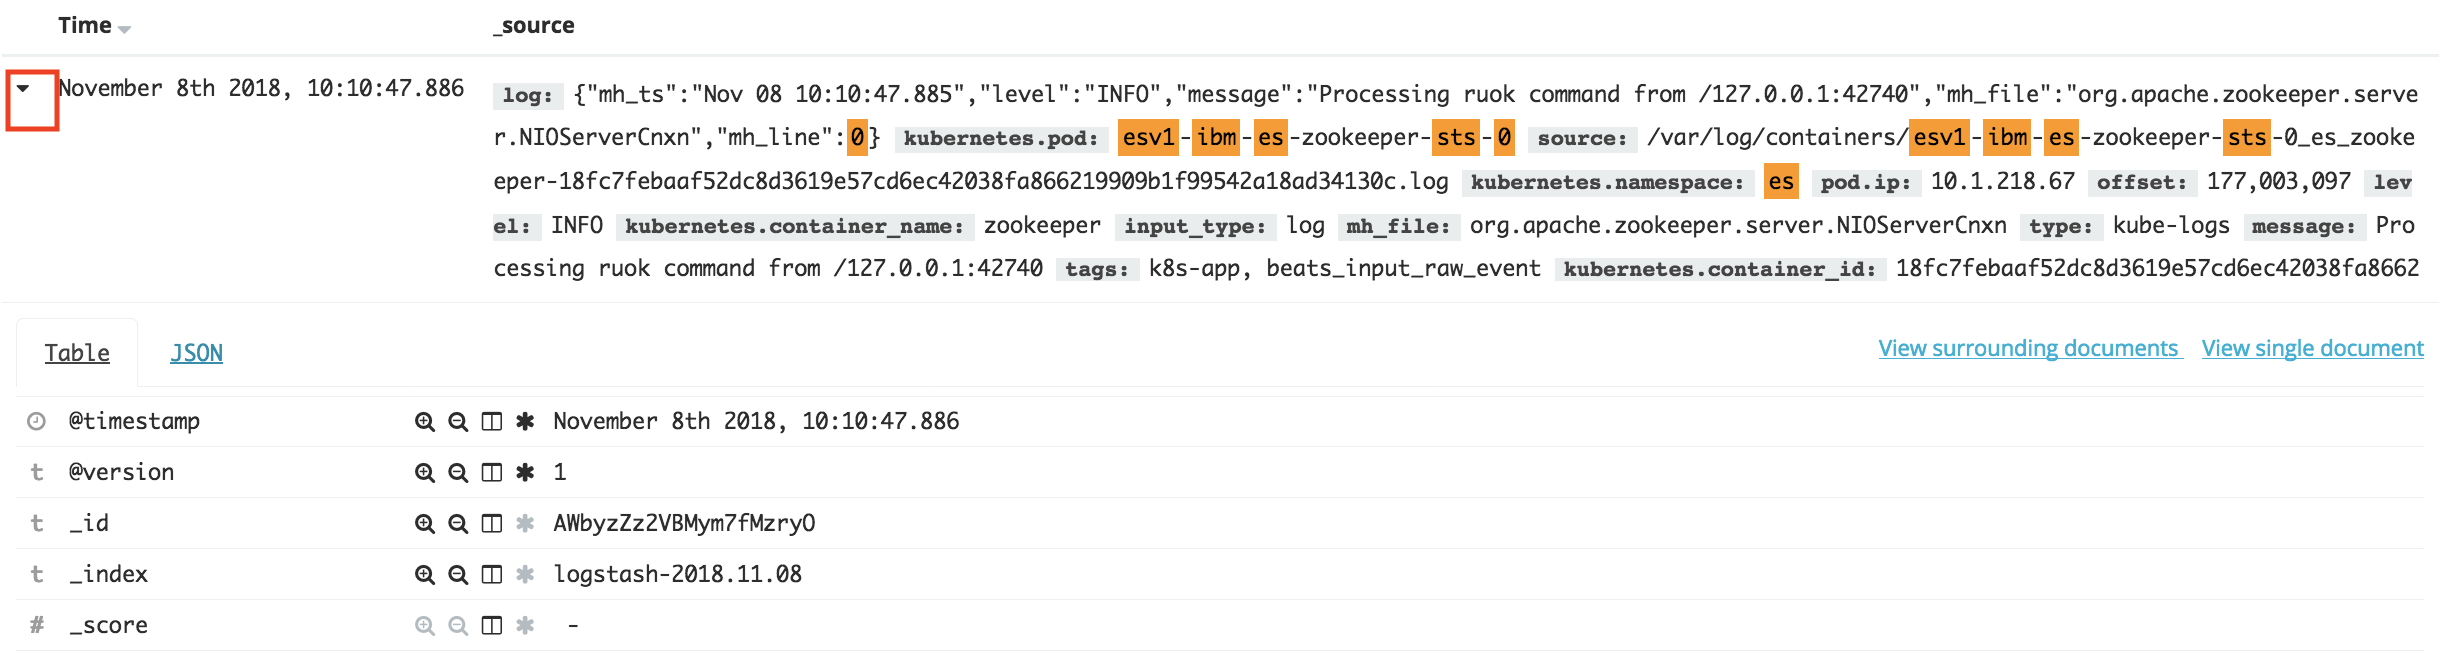
If you click on the twisty to the left of a specific log entry, it will expand to show the individual fields:
-
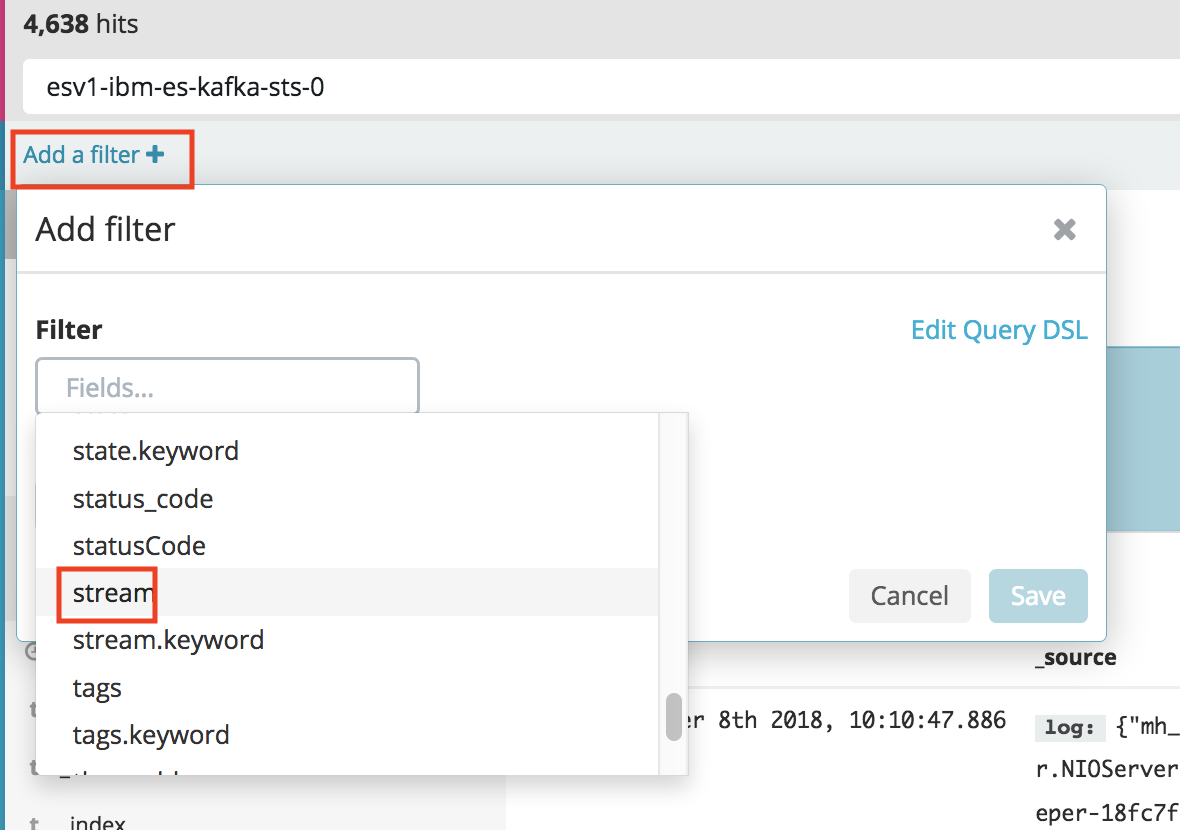
These fields can be used in search filter expressions to reduce the returned data or to search for specific entries. The logging information is derived from output from the stdout or stderr stream. As an example, let’s say you wanted to focus on errors written to the stderr stream. So, to filter on that, click on Add a filter and scroll down and select stream:
-
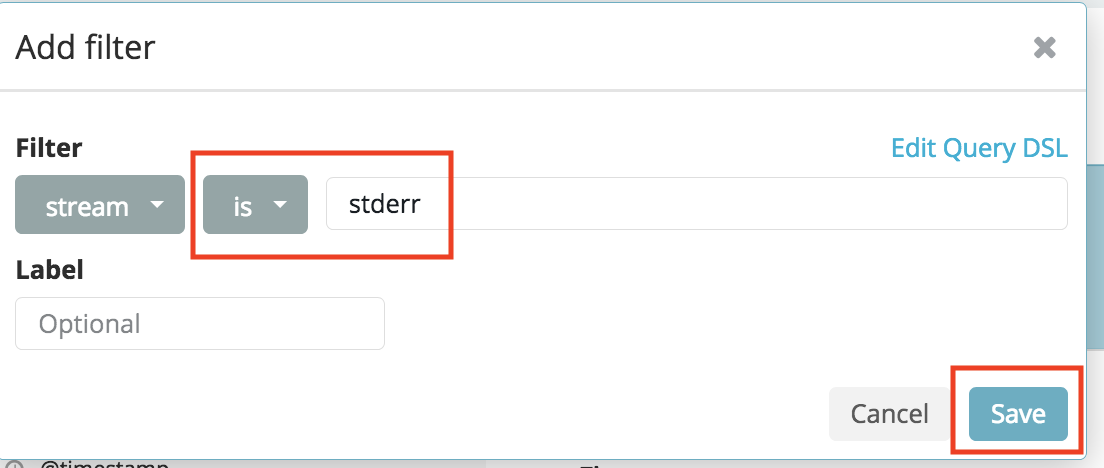
Then build the query expression and click Save:
-
Observe that the result set is reduced accordingly.
In the second case, you wish to start the Kibana user interface
-
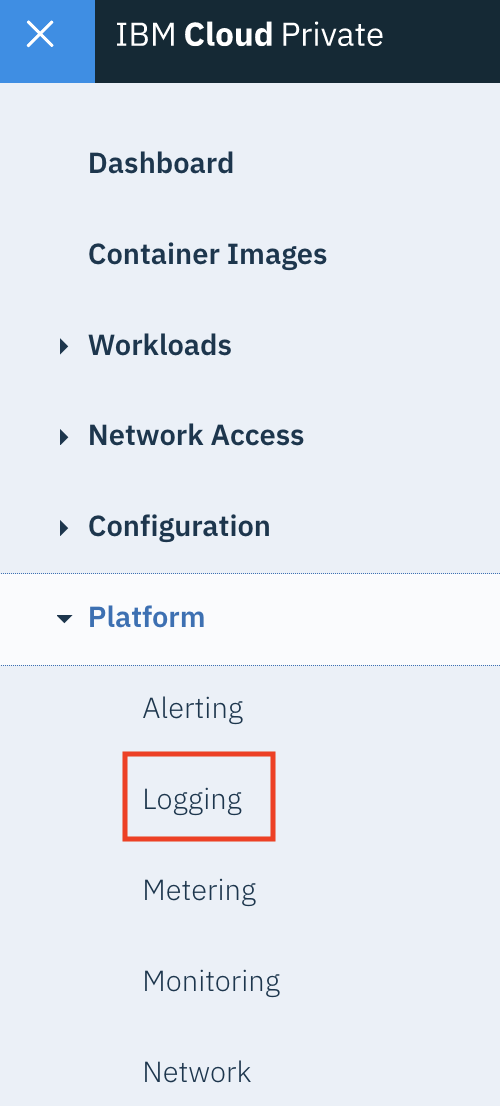
From the navigator, select Platform -> Logging
-
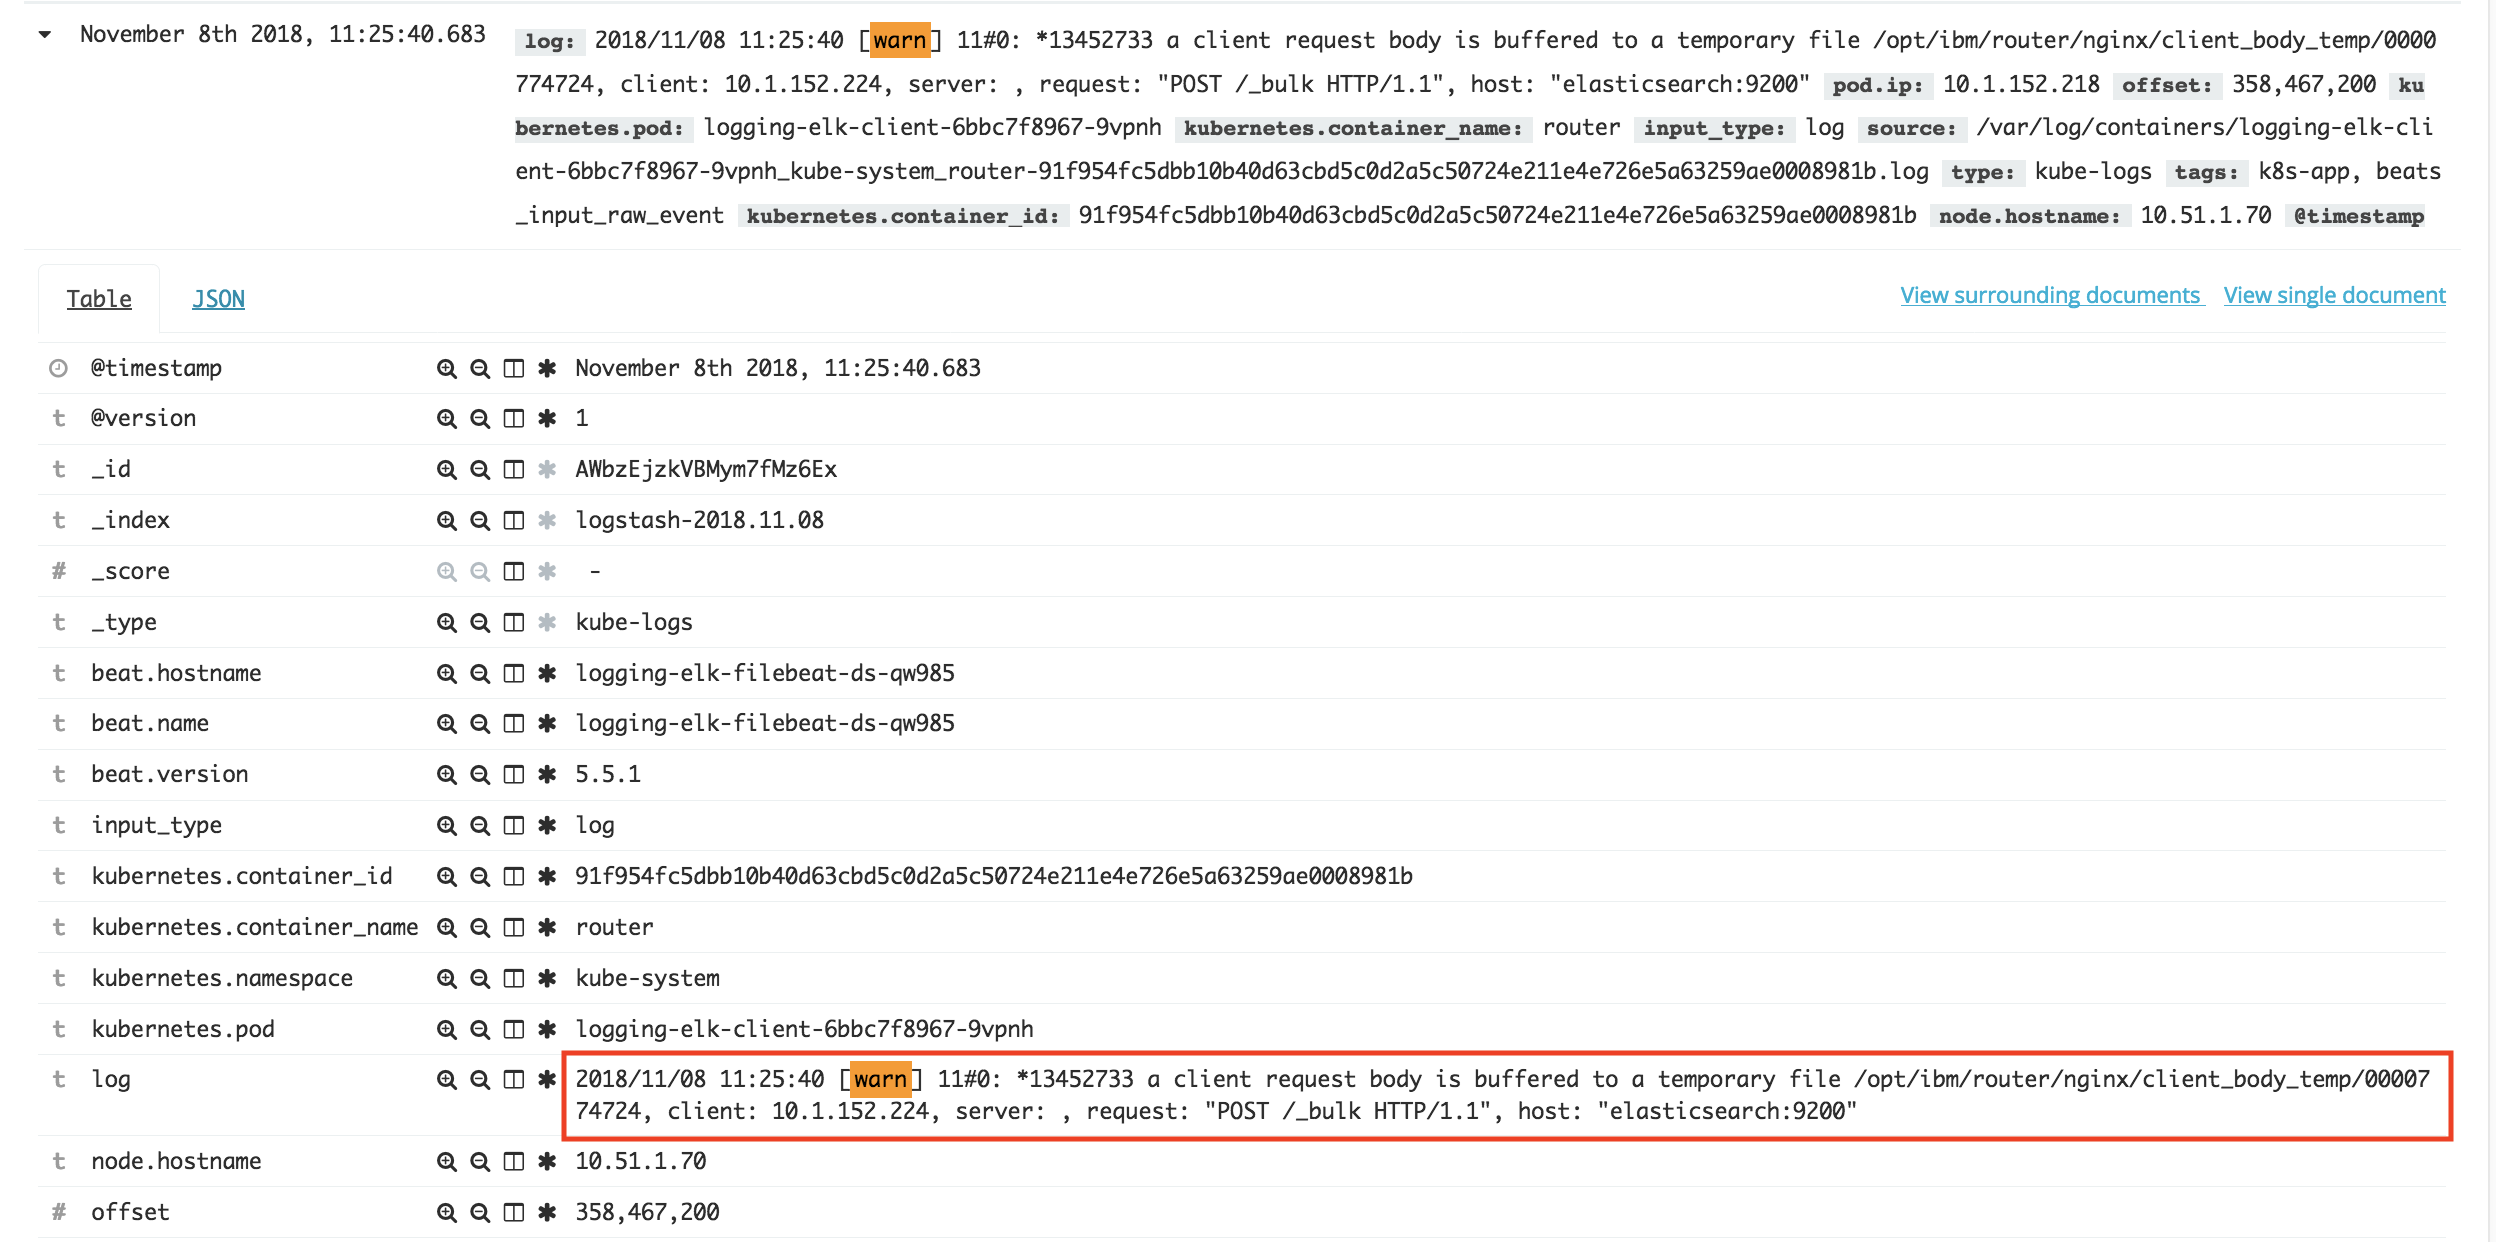
The Kibana interface opens but note that no search information is supplied, so, by default, you will be viewing all logging information. Try to build a filter expression (using the previous examples) to restrict the returned log information based on one or more fields and then to look in the detail log fields for something of interest. Suggest using warnings as shown below.
-
If you wish, take a few minutes to explore, or experiment with, the other aspects of the Kibana interface.
Metering
Although this is not strictly a monitoring or logging feature, the metering service uses the underlying captured data to report on the usage of the components which may be used for external license reporting or for internal purposes. To explore and report of the usage of your Event Stream deployment:
-
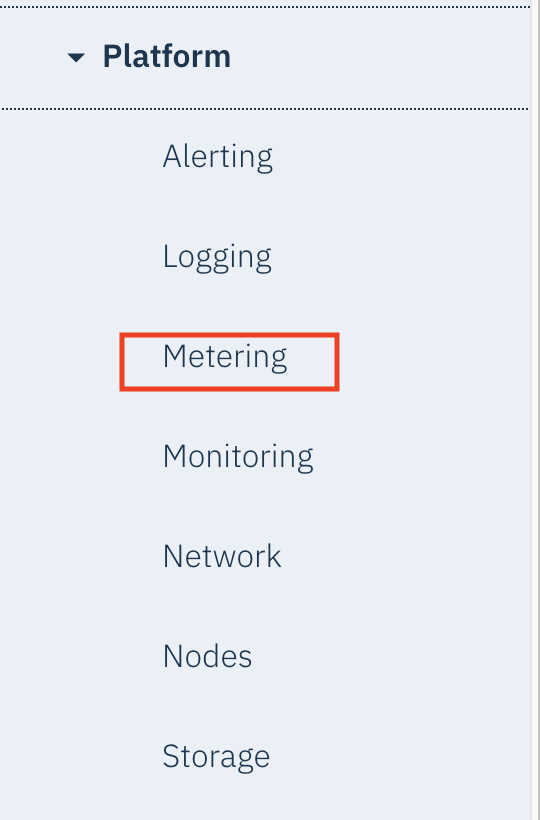
From the navigator, select Platform -> Metering:
-
The metering Groups are displayed. Select Namespaces and then select the namespace used in your Event Streams deployment:
-
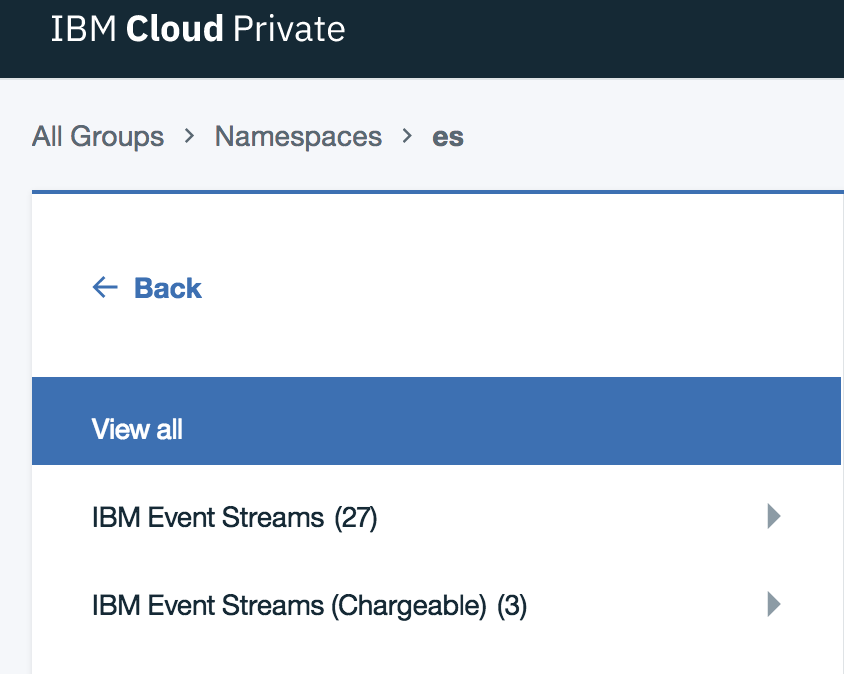
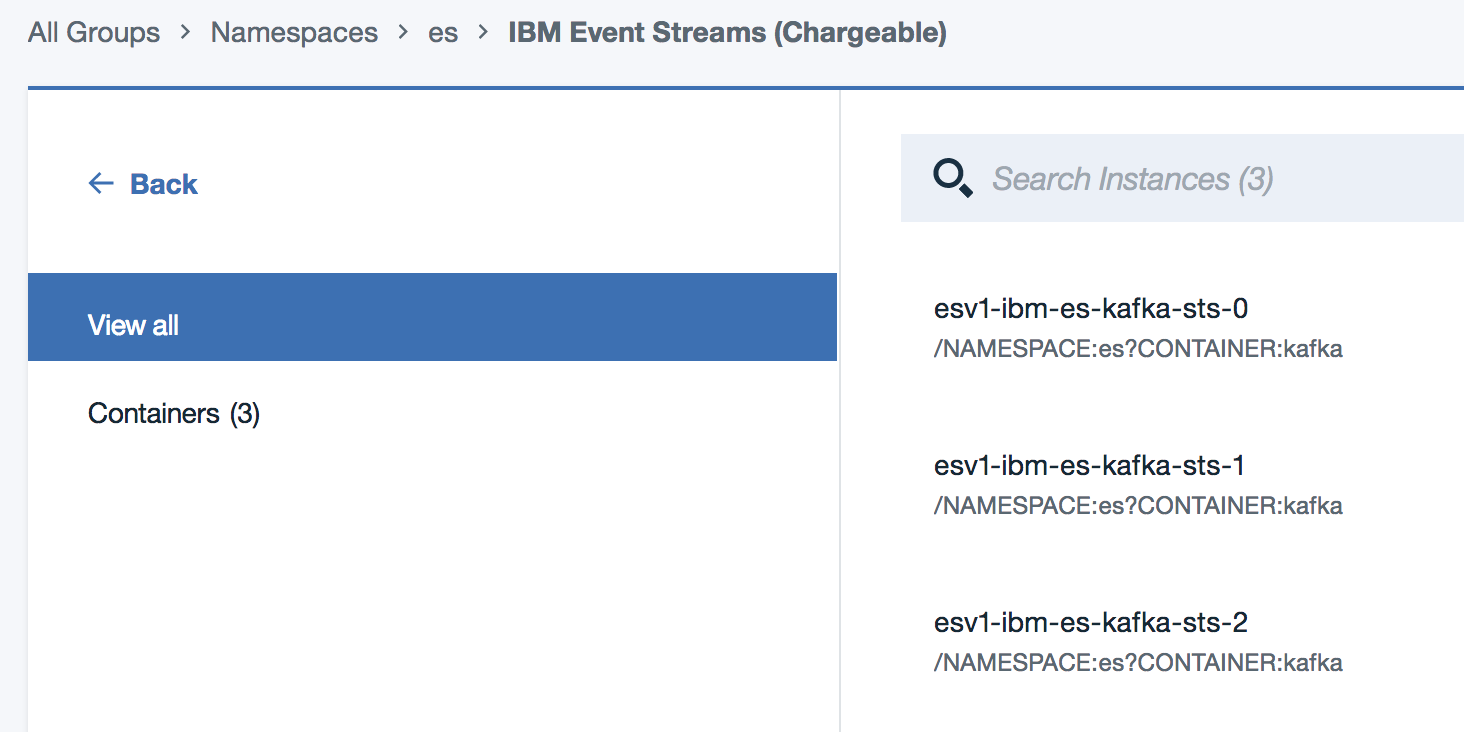
Notice that the chargeable components (ie containers) are listed separately and that there are many containers which IBM does not license and charge for. Select the IBM Event Streams (Chargeable) containers:
-
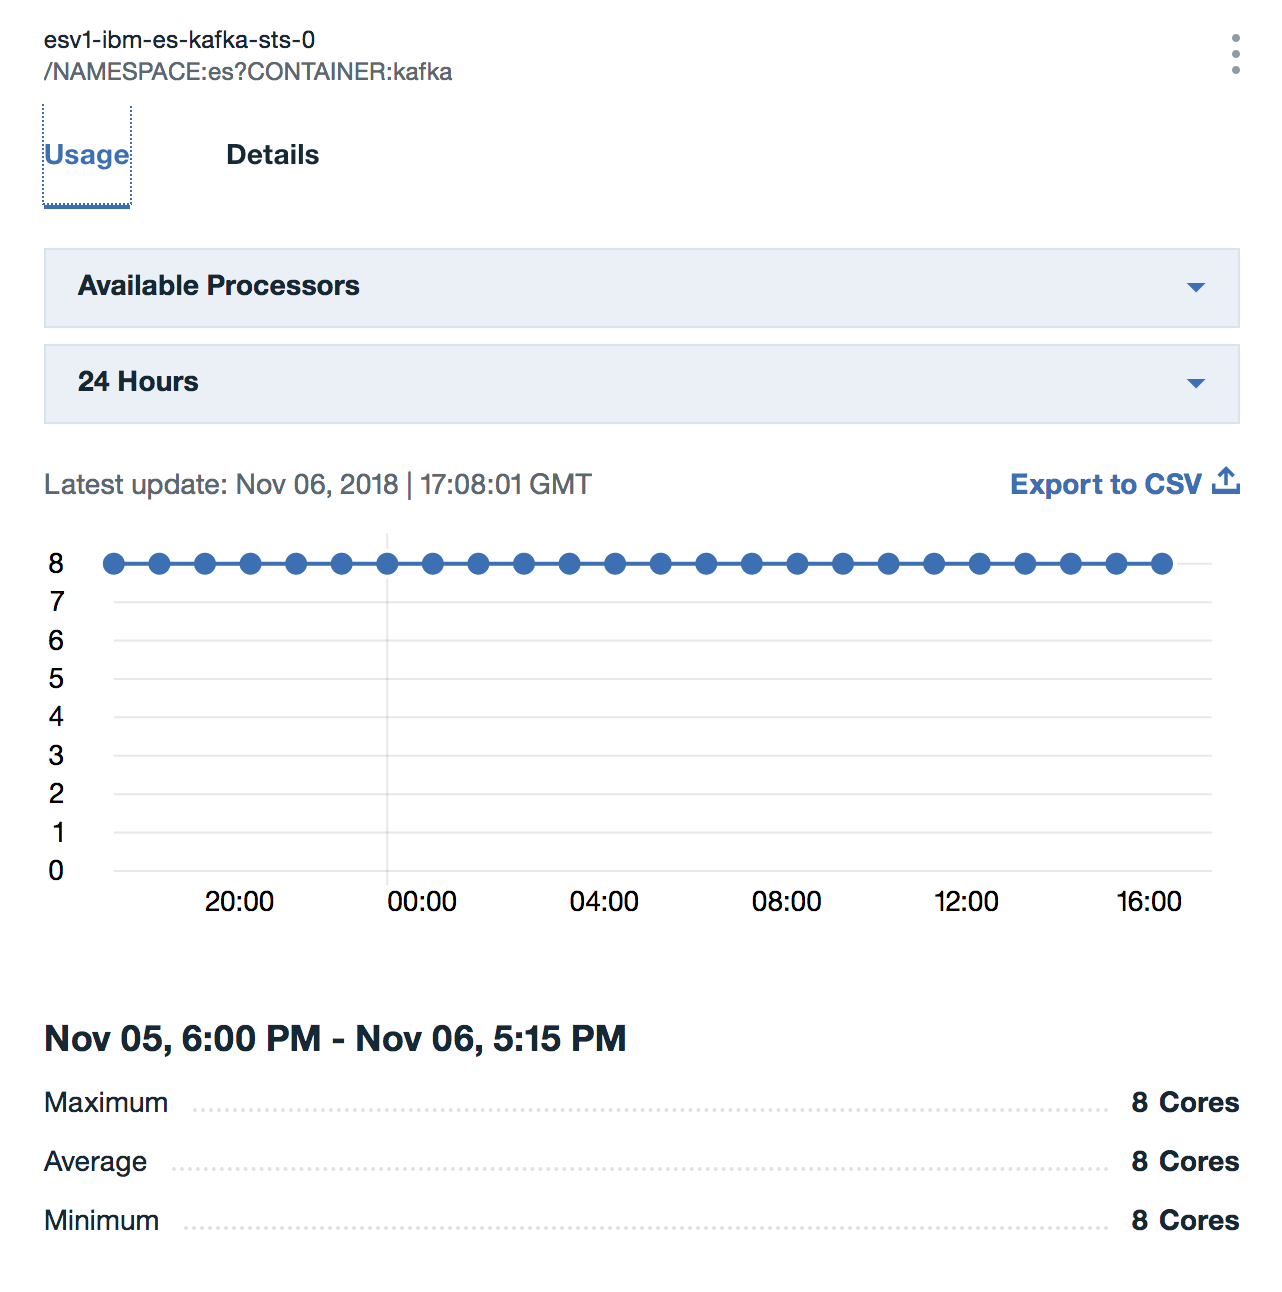
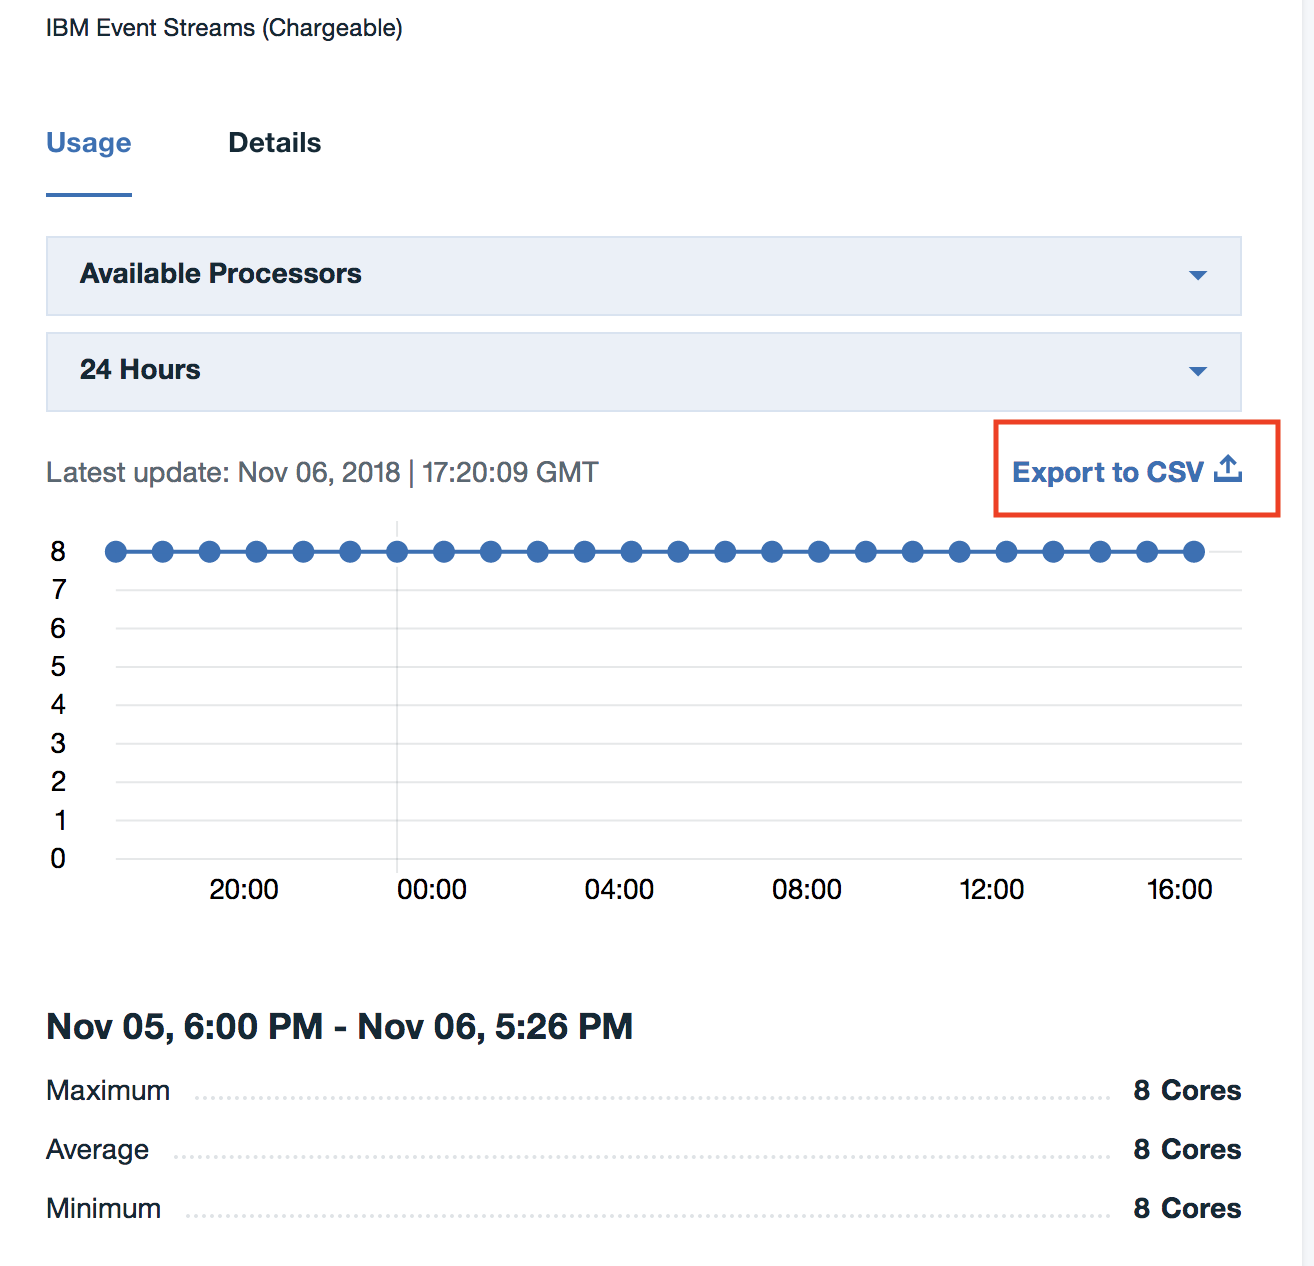
You will see each Event Streams Kafka container shown. In a default installation, you will have 3 containers deployed. Select one of them. The Usage tab shows the CPU deployment over the selected period:
-
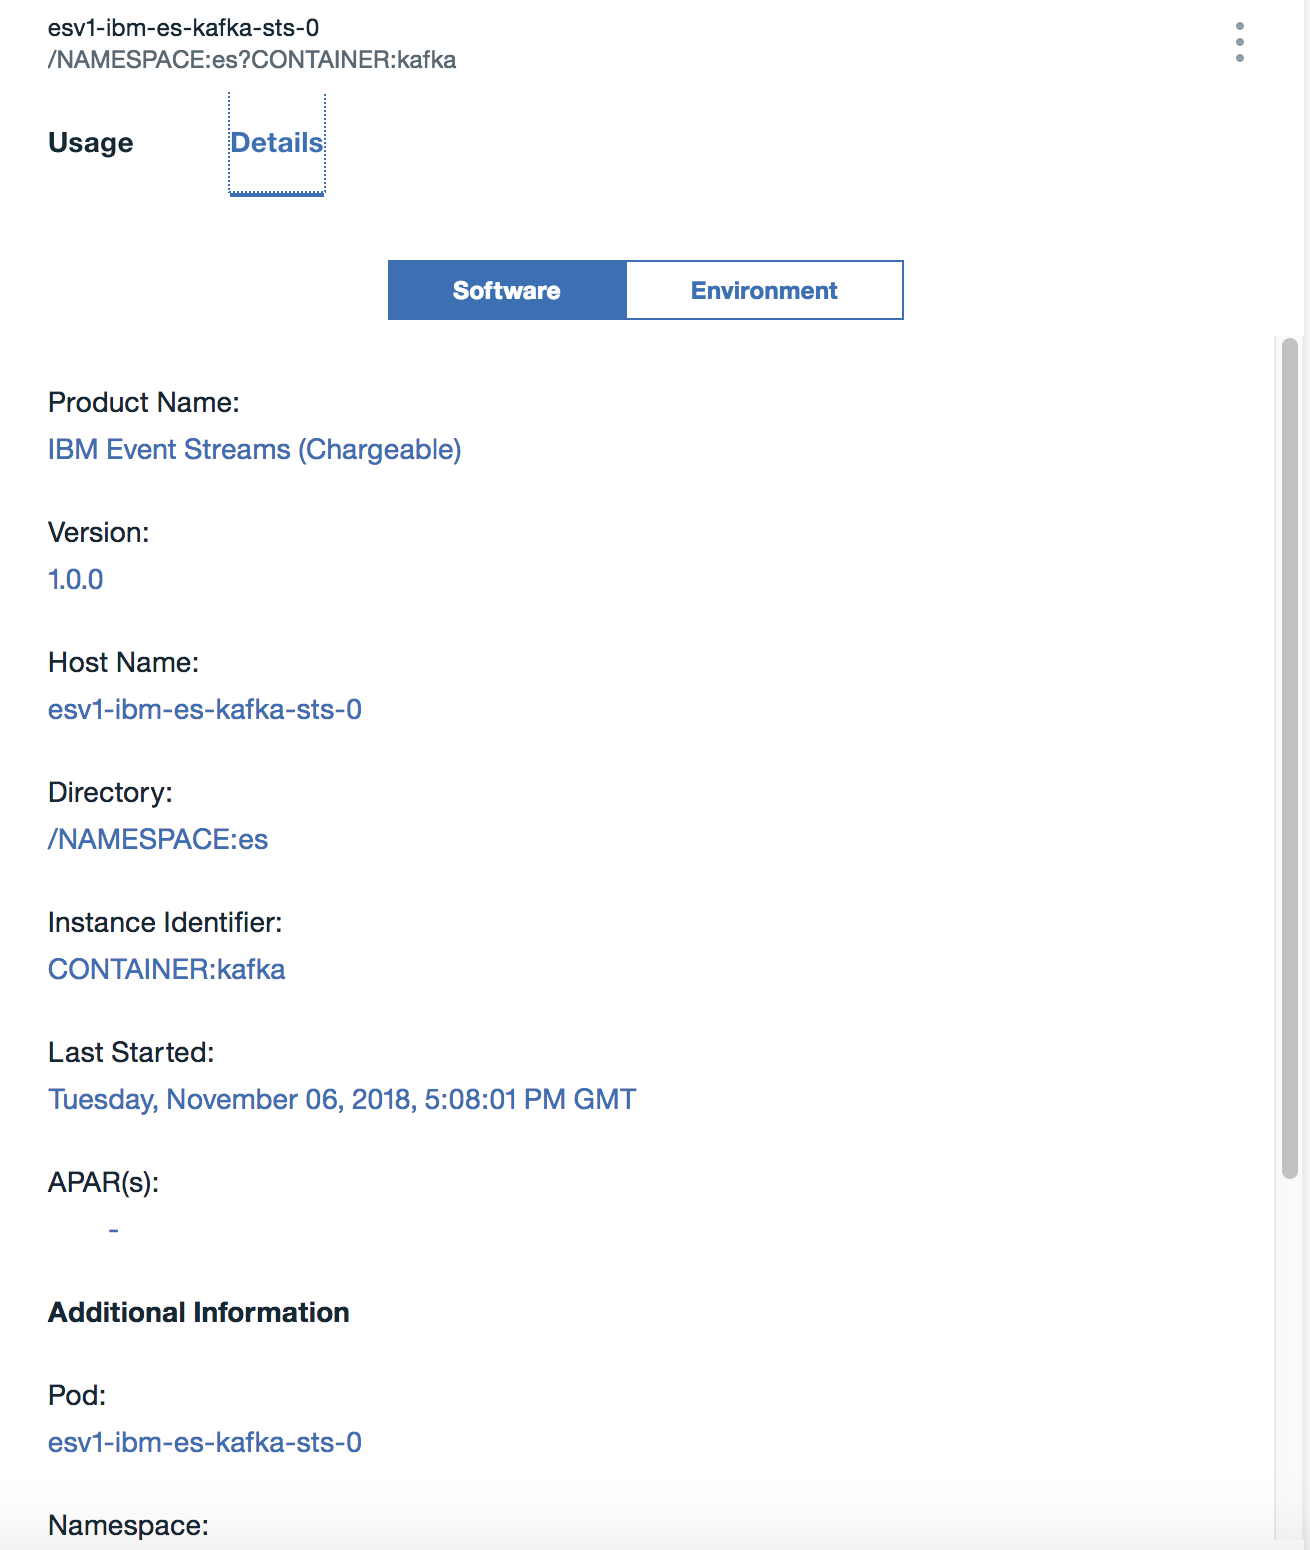
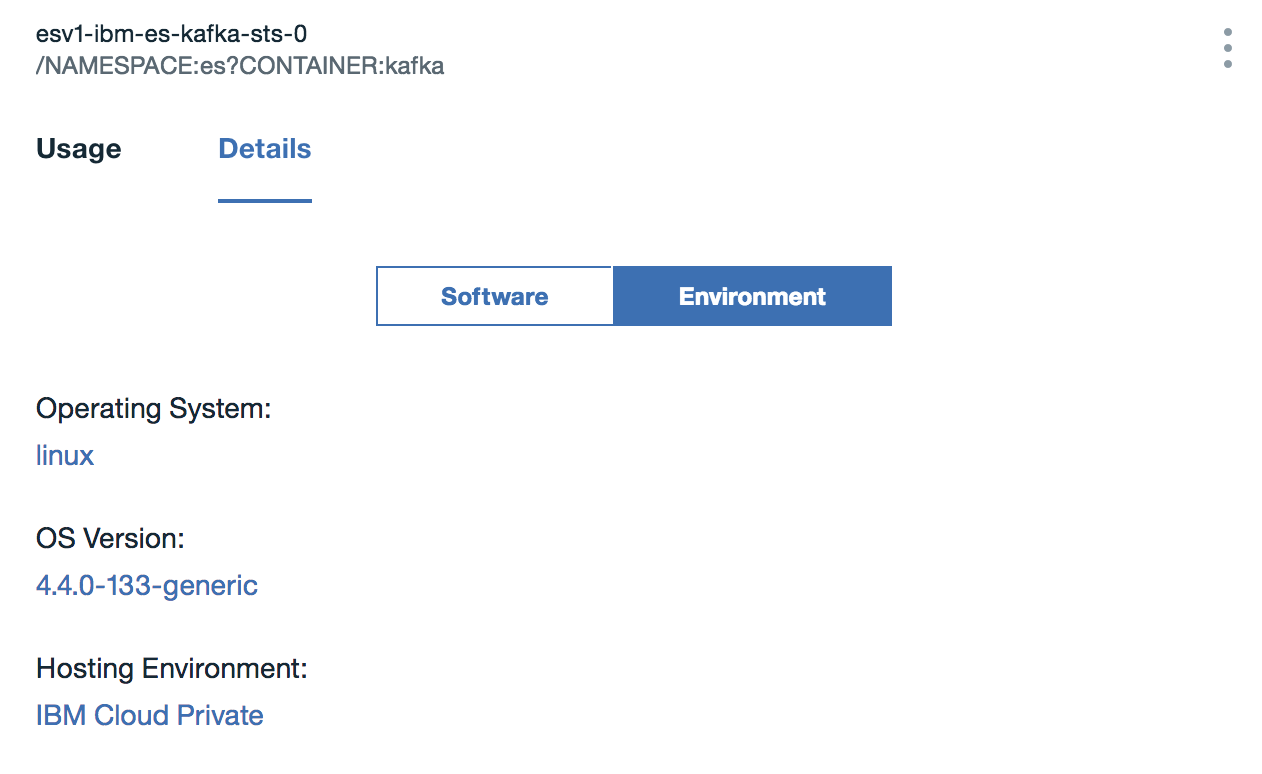
The Details tab shows data identifying the deployed configuration (Software tab) and the OS (Environment tab):
-
Click on View all to go back to the complete list.
-
You can export a file containing the deployment by CPU. Click on Export to CSV and observe the output:
-
If you want to obtain a full deployment report, then click on Download Report and review the output:

Congratulations
You have learned how to monitor Event Streams and view the logs.