Combining MQ Telemetry with ACE
This section will show how we can build an IBM App Connect Enterprise applications on top of MQ Telemetry. In our scenario we are using ACE to handle integration between the MQTT data stream and the business applications visualizing where trains are on the track. This section will show how an ACE flow can receive data from the MQTT data stream, transform the binary message payload into XML and put the result into a IBM MQ queue for collection by a business application.
Setting up MQ
This section will create the required objects in MQ for our ACE flow.
-
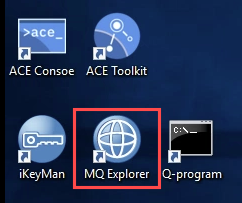
Open MQ Explorer. Double-click the MQ Explorer on the desktop.
-
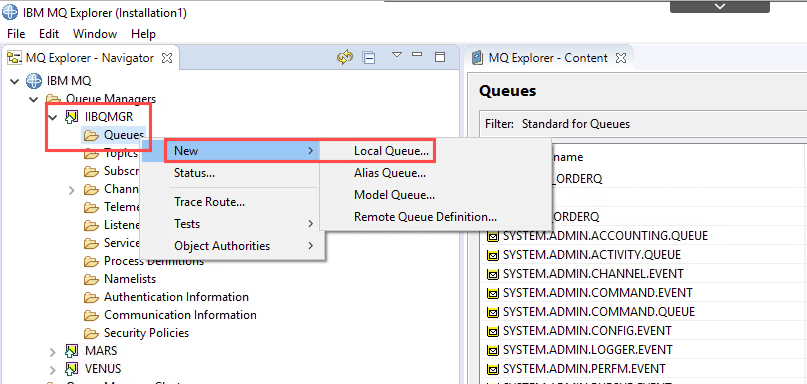
Navigate to the Queues folder on the IIBQMGR Queue Manager.
-
Right-click the Queues folder and select New > Local Queue…
-
The New Local Queue dialog appears.
-
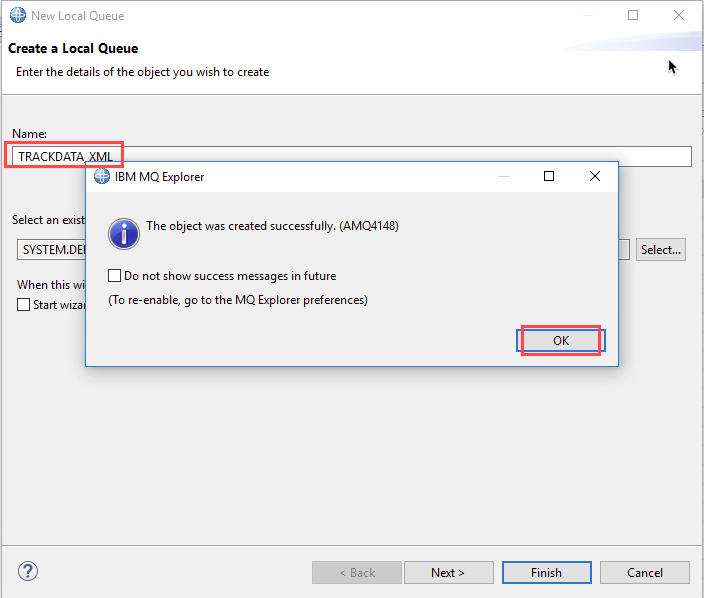
Enter TRACKDATA_XML into the Name field and click the Finish button.
-
You should then see a dialog telling you the queue object was created successfully. Click the OK button. The queue will be the ultimate destination for the MQTT data stream once it has been converted to XML by ACE.
-
Repeat the above steps to create a second queue called TRACKDATA_INPUT. This will be the source of the ACE flow. The way publish/subscribe is accomplished in ACE requires a subscription to be created in MQ to send messages received on a topic into a queue. ACE collects messages from that queue as input to flows.
-
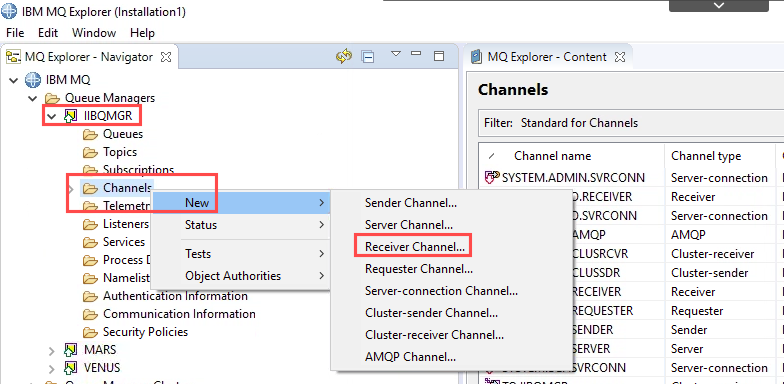
Right-click Channels and select New > Receiver Channel.
-
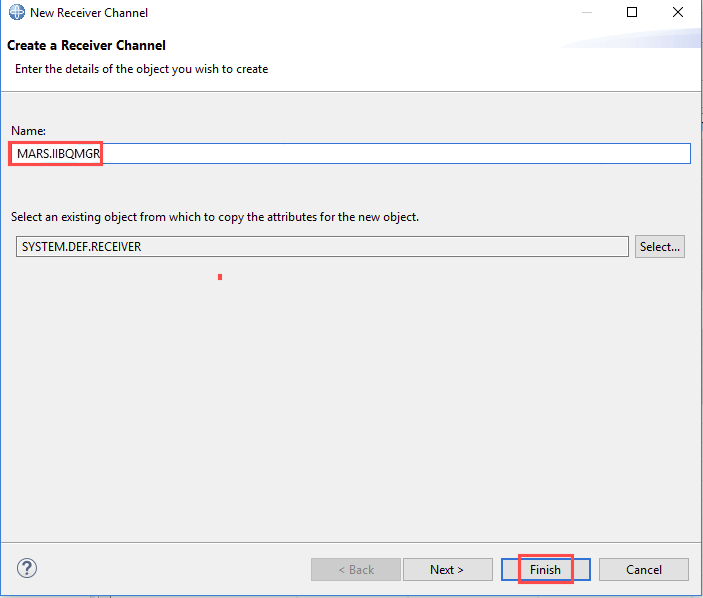
Enter MARS.IIBQMGR into the Name field and click the Finish button and then OK.
-
We must also create objects on queue manager MARS since that is where the telemetry application is running and the subscription will be entered there. We will need a remote queue definition to send the messages to queue TRACKDATA_INPUT on IIBQMGR, a sender channel and a transmission queue. Return to MQ Explorer for Installation1.
-
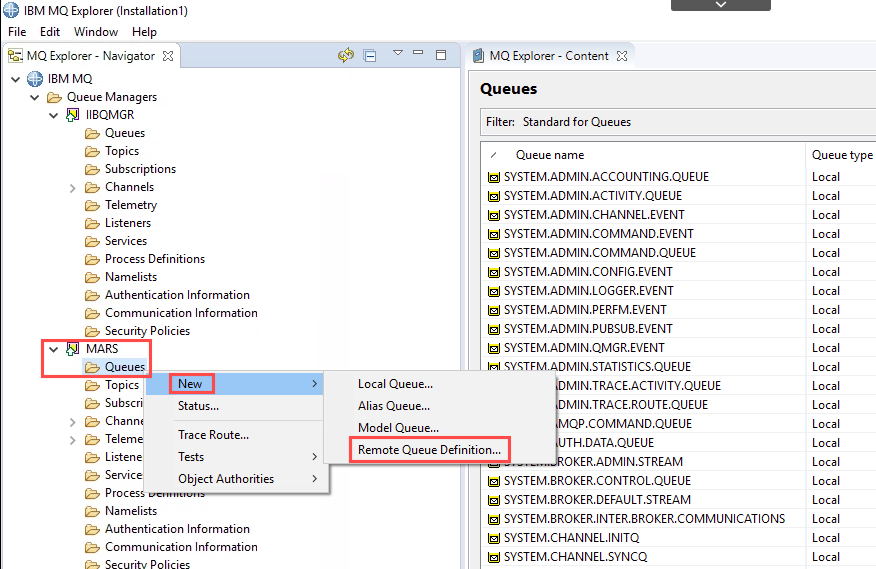
Navigate to the Queues folder on the MARS Queue Manager.
-
Right-click the Queues folder and select New > Remote Queue Definition….
-
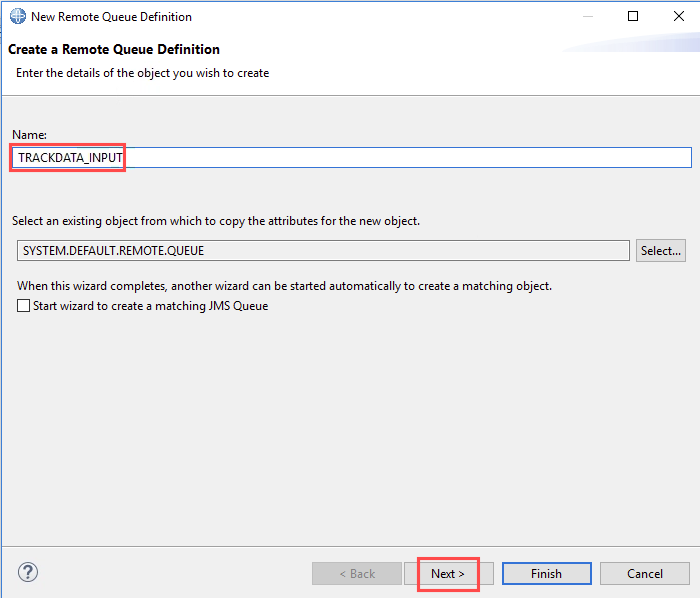
The New Remote Queue dialog appears.
-
Enter TRACKDATA_INPUT into the Name field and click the Next button.
-
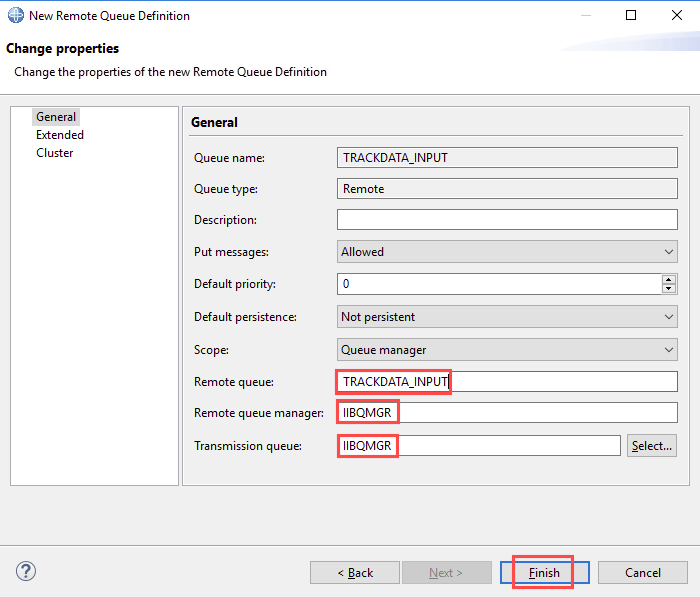
Enter TRACKDATA_INPUT for the Remote queue since the destination queue will be the same name on queue manager IIBQMGR.
-
Enter IIBQMGR for the Remote queue manager and Transmission queue.
-
Click Finish.
-
You should then see a dialog telling you the queue object was created successfully. Click the OK button.
-
Right-click the Queues folder and select New > Local Queue…
-
The New Local Queue dialog appears.
-
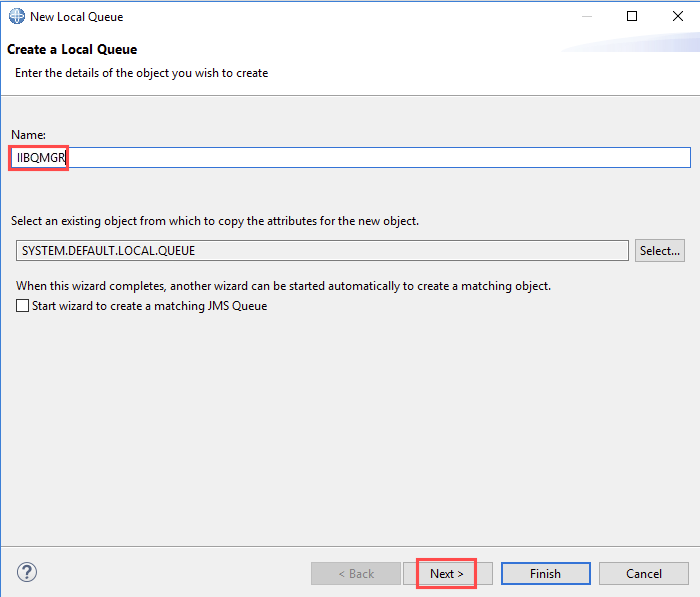
Enter IIBQMGR into the Name field and click Next.
-
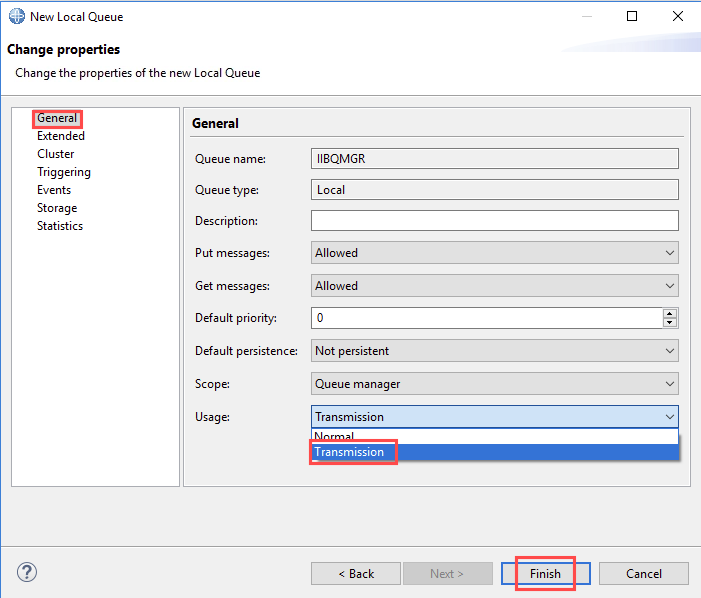
Change the Usage field to Transmission.
-
Click the Finish button.
-
You should then see a dialog telling you the queue object was created successfully. Click the OK button.
-
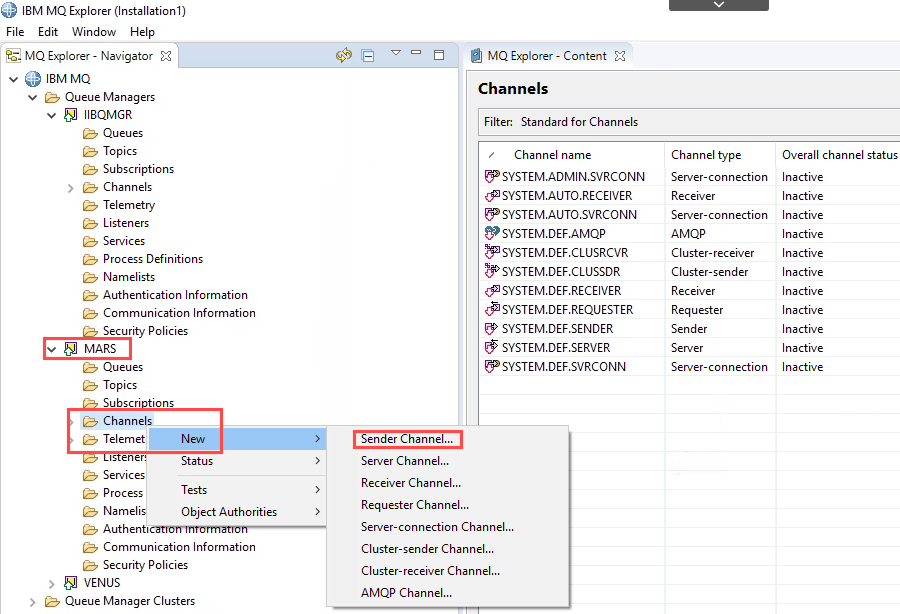
Right-click the Channels folder and select New > Sender Channel…
-
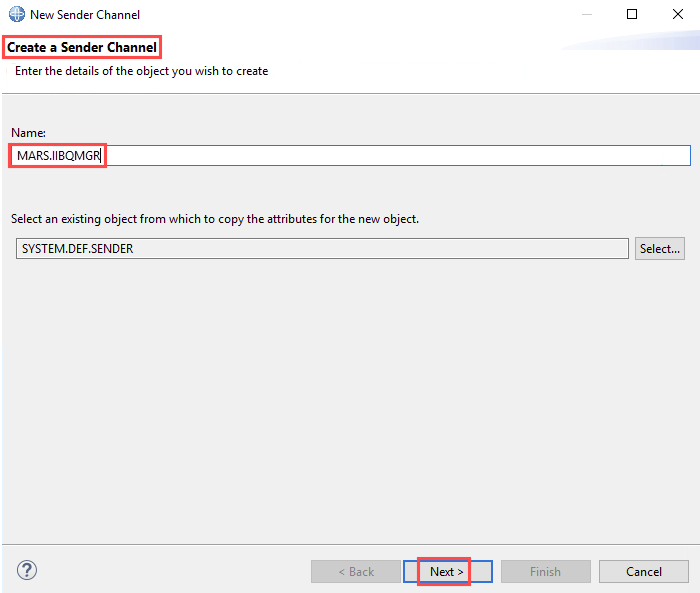
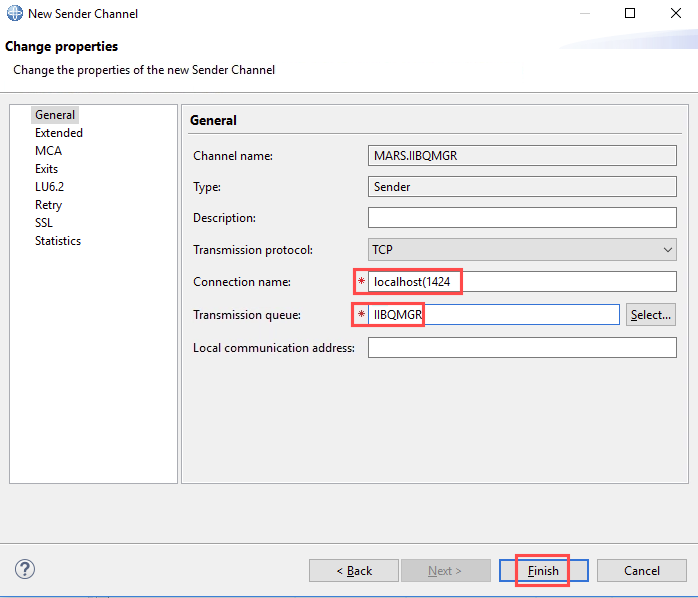
The New Sender Channel dialog appears.
-
Enter MARS.IIMARSBQMGR into the Name field and click the Next button.
-
Enter localhost(1414) for the Connection name.
-
Enter IIBQMGR for the Transmission queue.
-
Click Finish.
-
You should then see a dialog telling you the queue object was created successfully. Click the OK button.
-
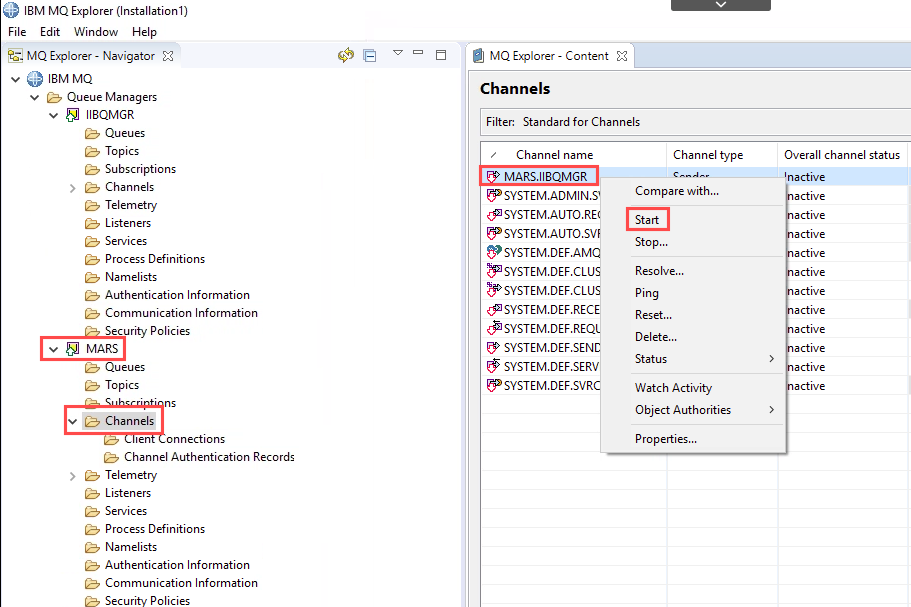
Right click the MARS.IIBQMGR channel you just created and select Start to start the channel.
-
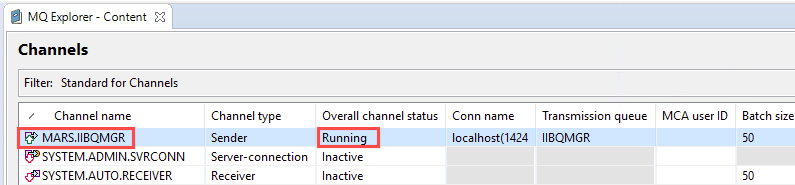
Click OK on the start channel accepted message and you will see the channel go active.
-
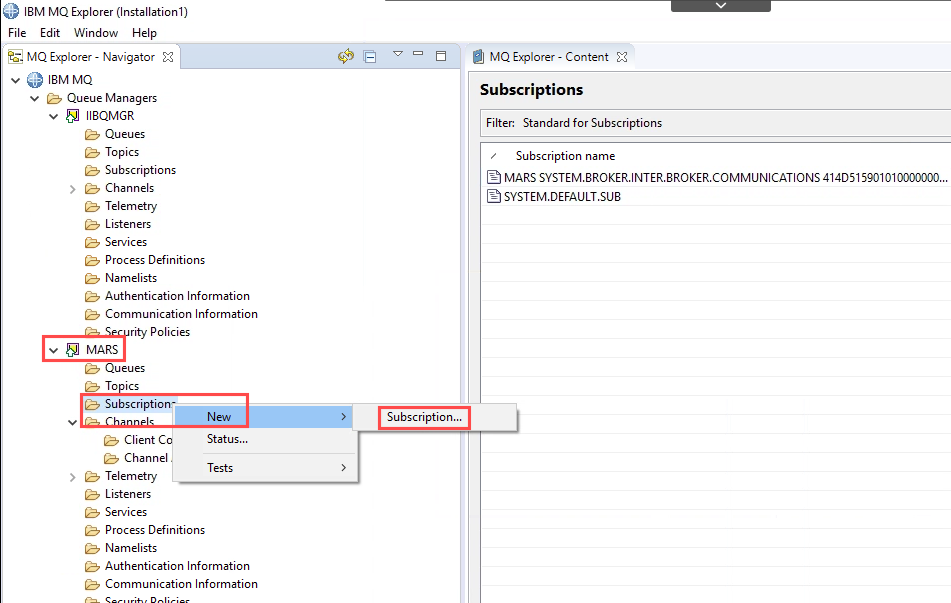
We will now create the subscription in MQ to populate the TRACKDATA_INPUT queue on IIBQMGR where the message broker flow is running. The telemetry application will be connecting to queue manager MARS. Right-click the Subscriptions folder and select New > Subscription.
-
The New Subscription wizard appears.
-
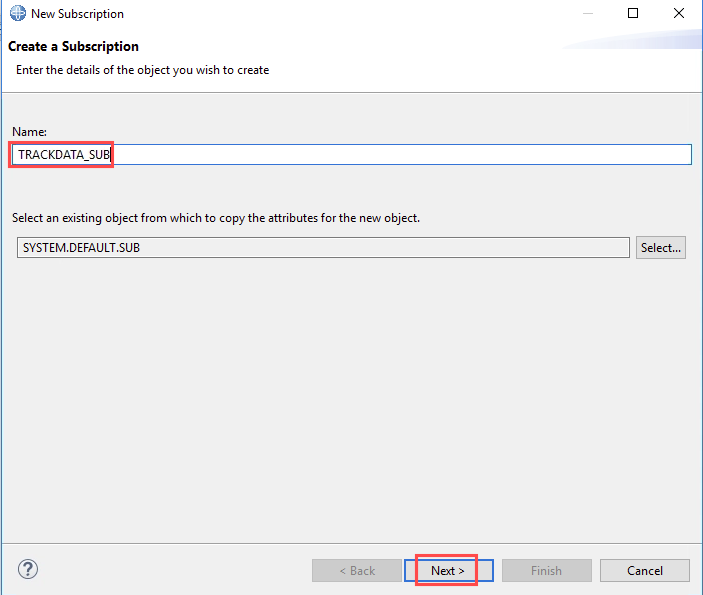
Enter TRACKDATA_SUB in the Name field and click the Next button. You will see the next screen on the wizard.
-
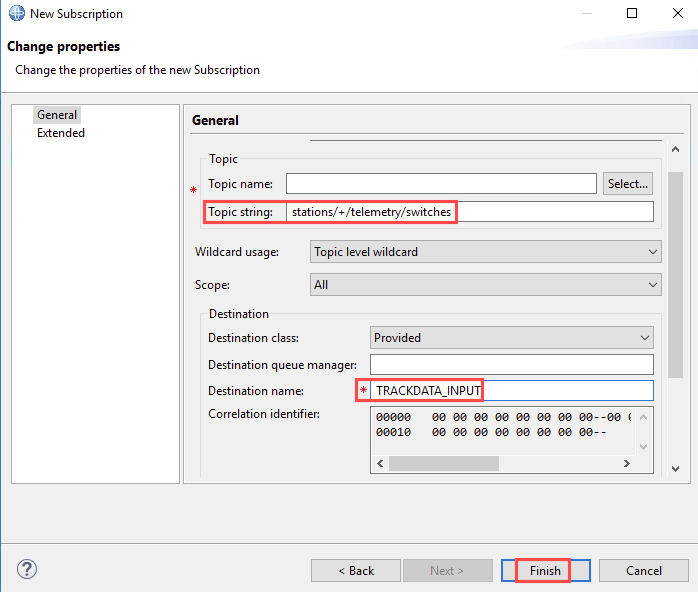
In the Topic string field enter stations/+/telemetry/switches. This tells WMQ which topic to subscribe to. The + is a wildcard so this subscription will be for all stations.
-
Click the drop-down for Wildcard usage and select Topic level wildcard.
-
In the Destination name field, enter TRACKDATA_INPUT. This tells MQ where to put the messages received on the subscription.
-
Click the Finish button.
-
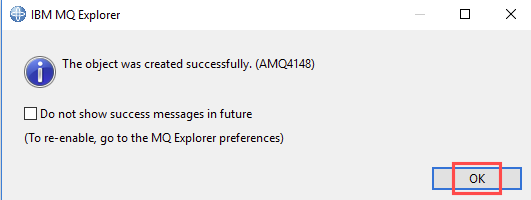
You will see a dialog indicating that the subscription was created. Click OK.
-
You will now see the TRACKDATA_SUB in the list of subscriptions.

-
Scroll to the right to review the properties of the subscription.
Creating and deploying the ACE flow
Using the IBM App Connect Enterprise Toolkit, we now will create a simple flow that collects messages received over MQTT, decodes the switch address and setting from the byte payload, and emits the data as an XML packet.
Creating the ACE message flow
-
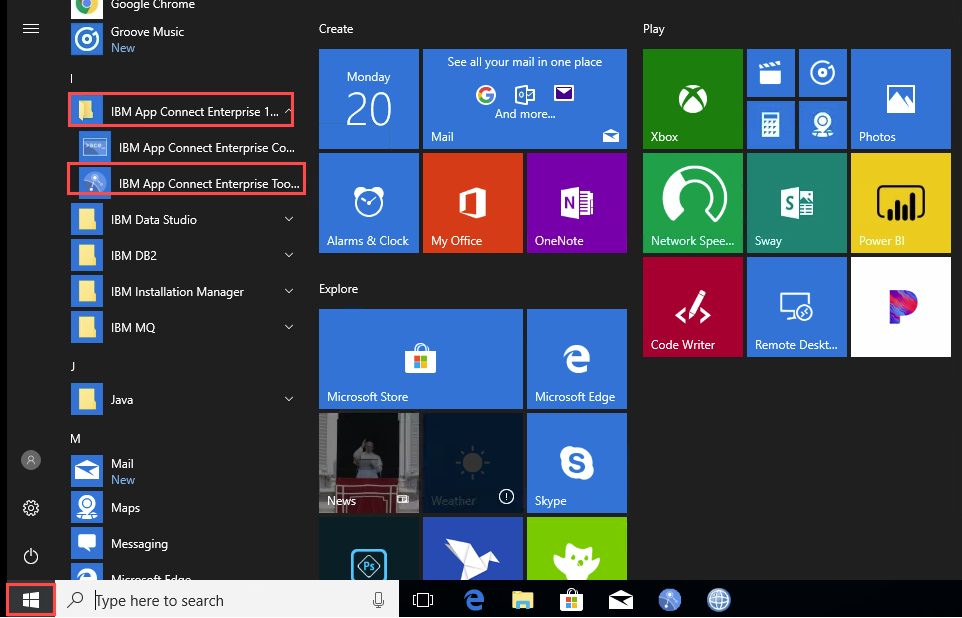
ACE Toolkit may still be running from the previous lab. If the ACE Toolkit is not running, start the Integration Toolkit using the Windows Start Menu, select All Programs > IBM App Connect Enterprise > IBM App Connect Enterprise Toolkit 11.0.0.1. You will see the ACE Toolkit workbench appear. Of course by now you know you can just double-click the shortcut on the desktop.
-
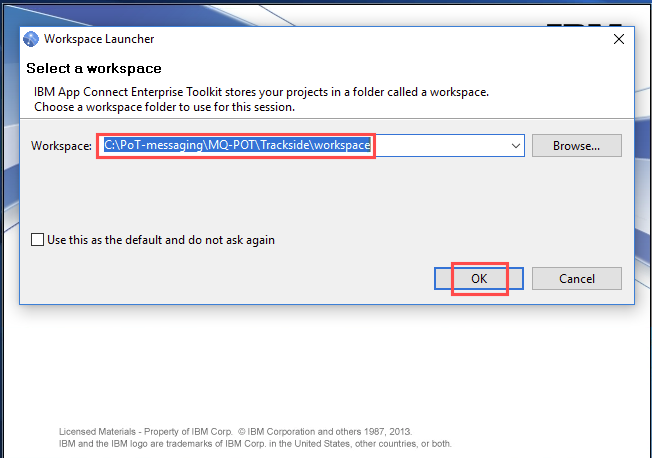
Enter C:\POT-messaging\MQ-POT\Trackside\workspace for the workspace.
-
Click OK.
-
If the Welcome view is open, close it by clicking the X on the tab.
-
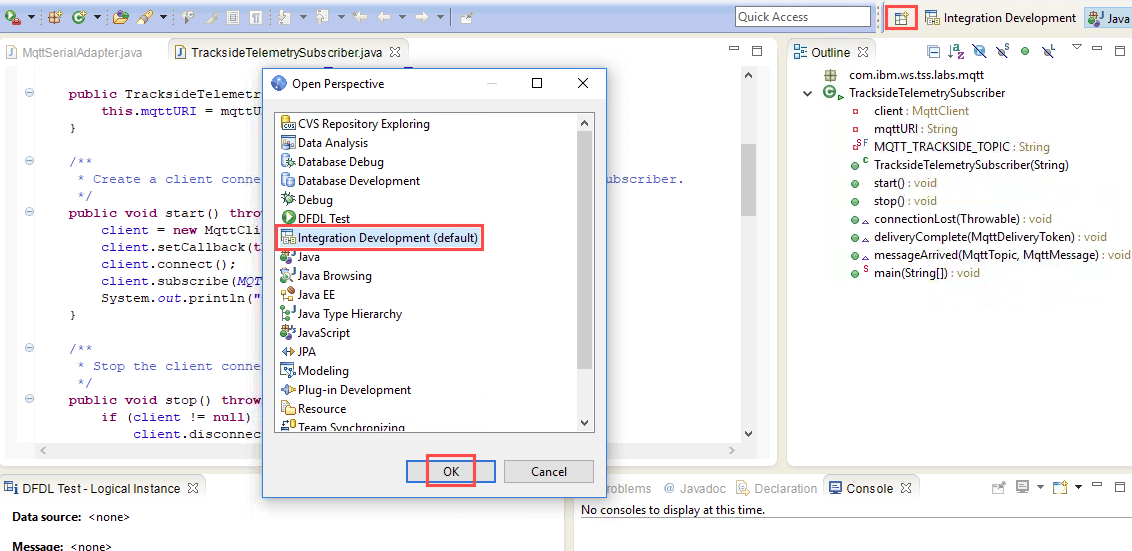
If the toolkit opens to the Java perspective, click the Integration Development perspective icon.
-
You will now see the Integration Development perspective open.
-
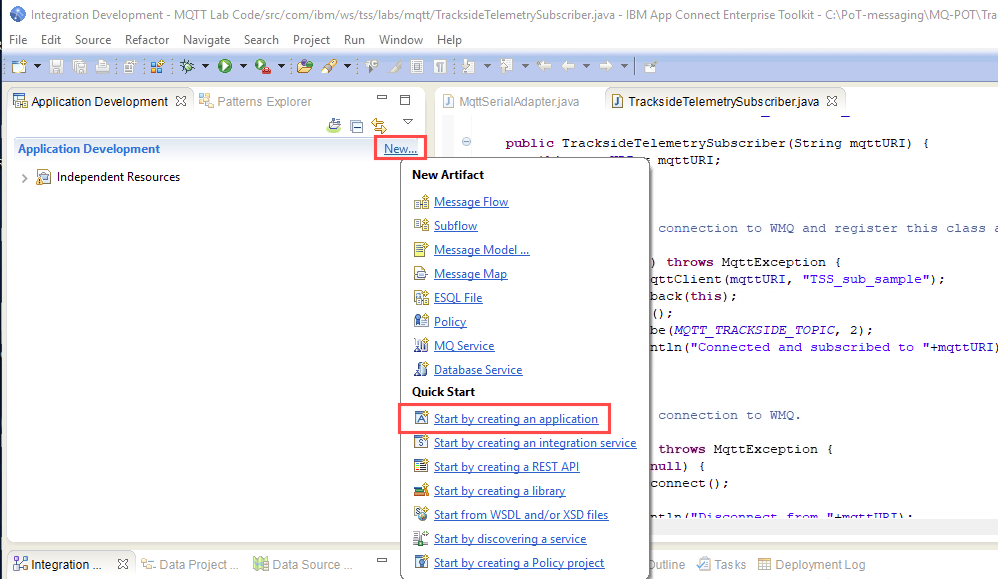
Create a new Application. Click New…, select Start by creating an application.
-
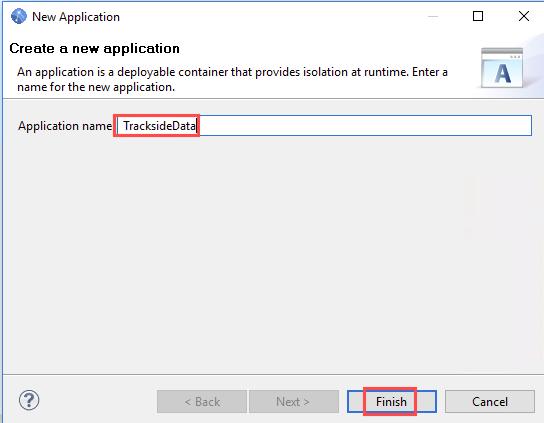
Enter TracksideData for the Application name.
-
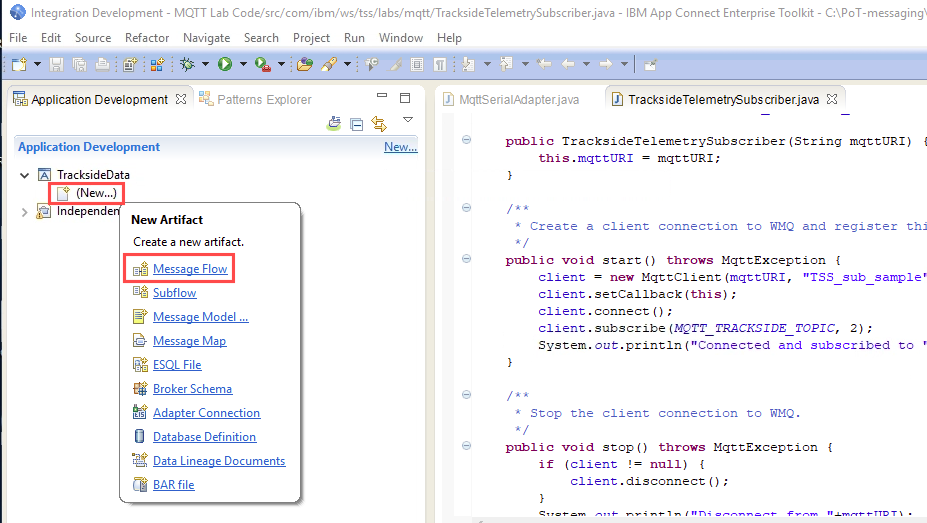
Create a new Message Flow by clicking (New…) > Message Flow.
-
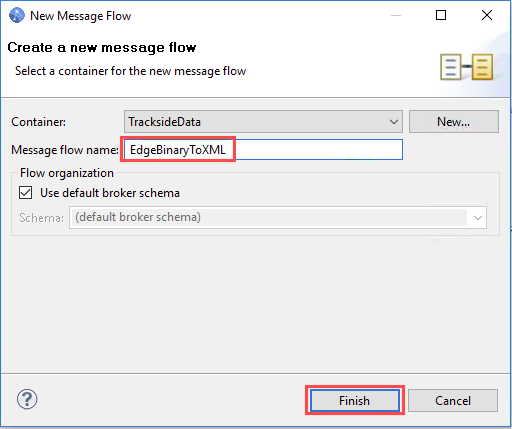
When the New Message Flow wizard opens, TracksideData will be pre-filled in the Container field. Enter EdgeBinaryToXML in the Message flow name field.
-
Click Finish.
-
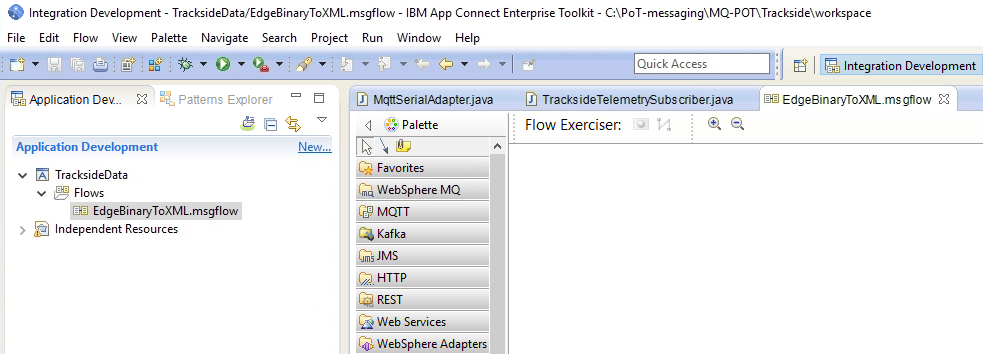
The Message Flow editor will open with a blank canvas.
-
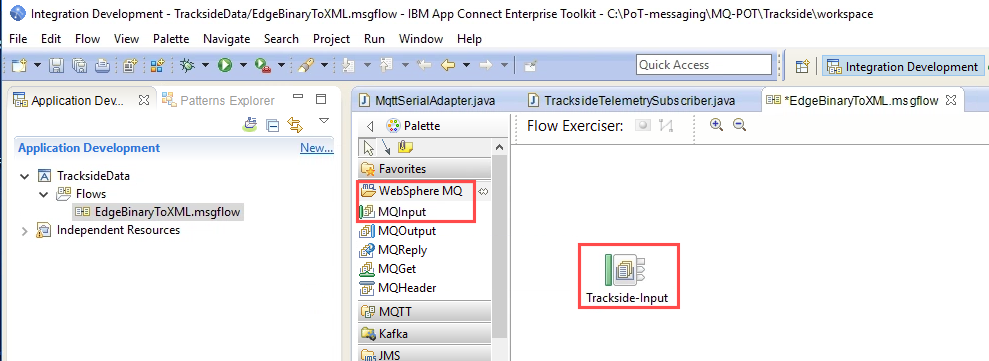
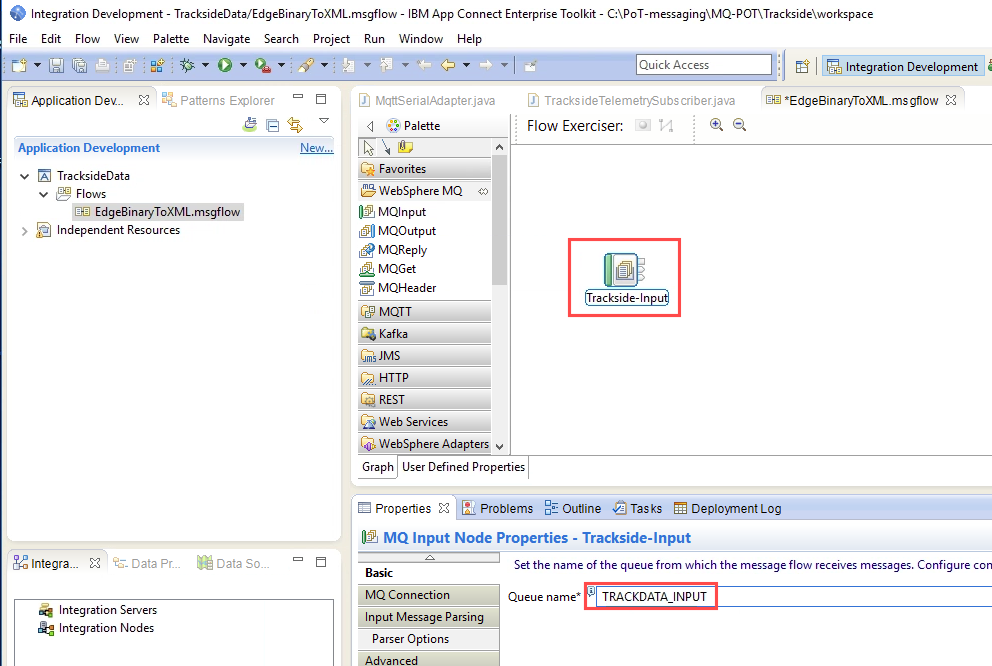
Click the WebSphere MQ section on the palette and drag an MQInput node onto the canvas. This will represent the source queue for our flow, in this scenario the MQTT messages received from trackside.
-
The node will appear on the canvas with its name selected underneath. Set this to Trackside-Input and press enter.
-
Click the Trackside-Input MQInput you just created. You will notice on the Properties view at the bottom of the workbench an error message that the queue name must be specified. In the Queue name field enter TRACKDATA_INPUT. The error message will disappear.
-
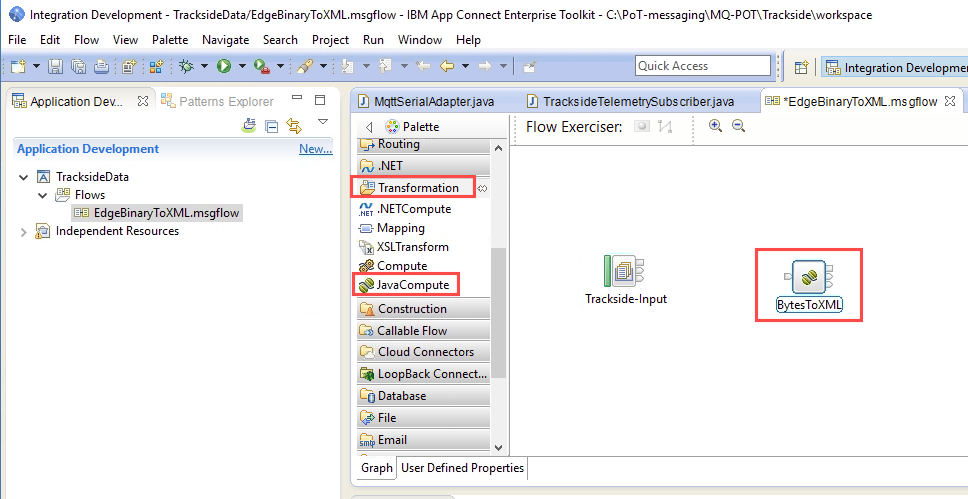
Our flow must transform the Java-encoded byte payload into XML. We can do this using a JavaCompute node within our flow. Click the Transformation section on the palette and drag a JavaCompute node onto the canvas.
-
Once again the name will be highlighted, set this to BytesToXML and press enter.
-
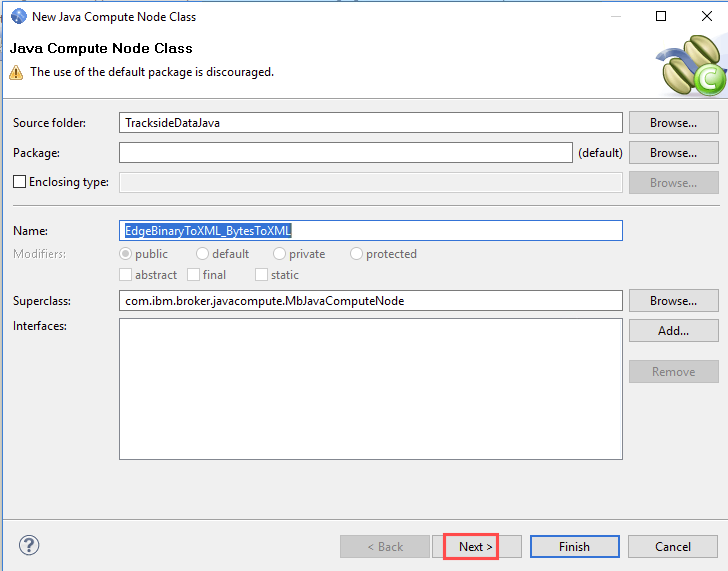
Double-click the new JavaCompute node and the New Java Compute Node Class wizard will open.
-
Click Next to accept the default settings of TracksideDataJava.
-
You will now be prompted to select a class template. Select the Modifying message class template and click Finish.
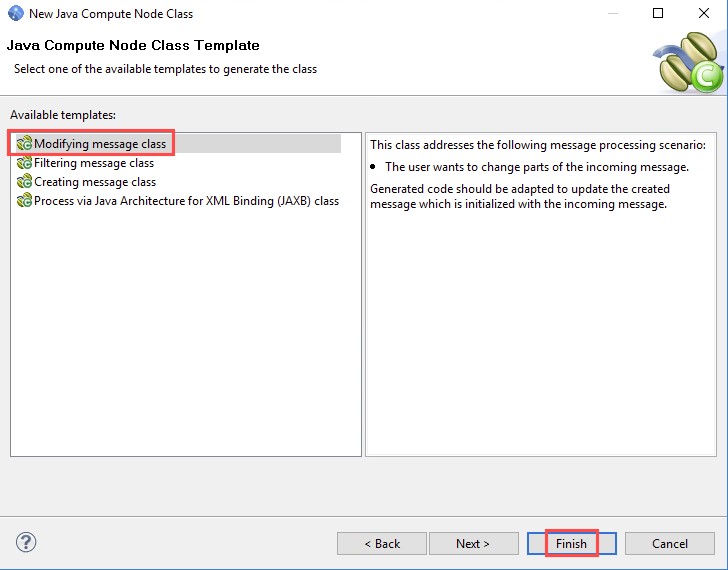
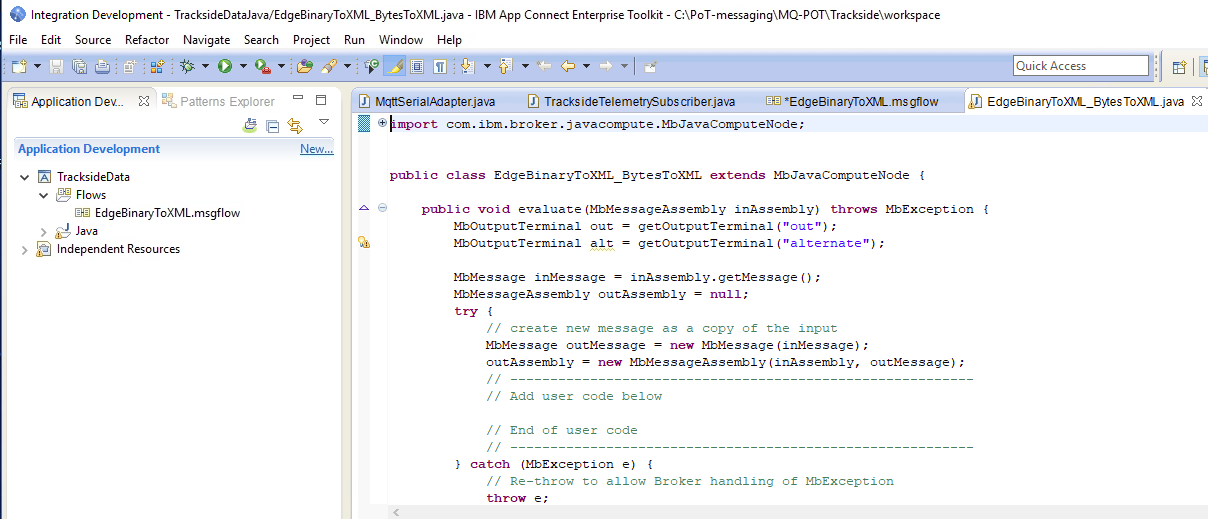
You will see a Java editor open containing a skeleton class.
-
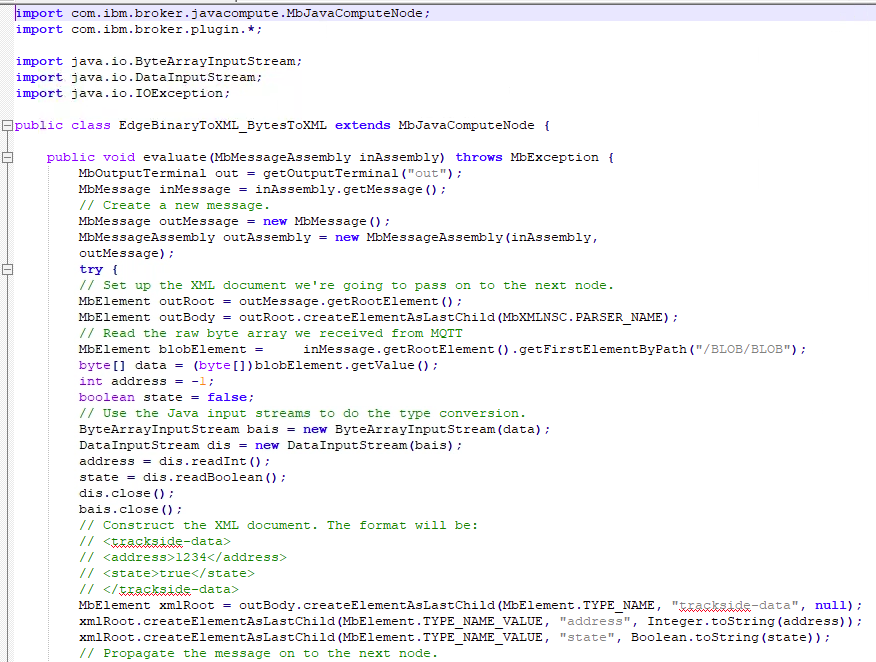
The core of the compute class is the evaluate method. The toolkit has created a template method. We need to replace that with some simple code which will read the contents of the input message (a raw byte array stored in the message tree as a BLOB), decode the bytes (using a ByteArrayInputStream in the same way as the TracksideSubscriber class we looked at earlier), and copy the switch number and state information into a new XML message.
-
Replace the entire file with the following code. You may copy and paste from the file C:\PoT-messaging\MQ-POT\MQ71-Lab\EdgeBinaryToXML_BytesToXML.
-
Save the changes to the Java class by using Ctrl-S or the File menu.
-
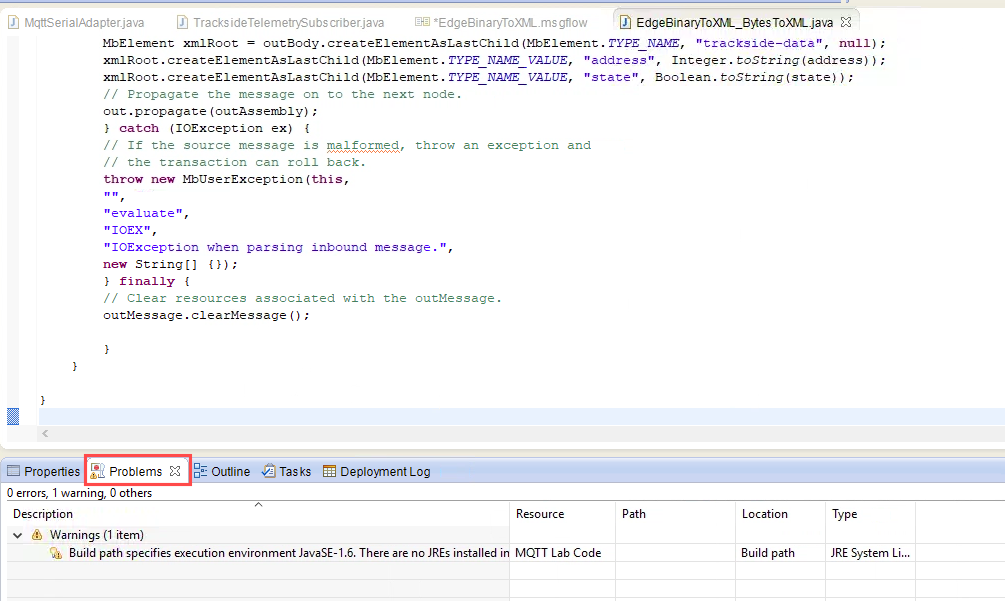
Before continuing, check for problems by clicking the Problems tab. Warnings are OK. Resolve any errors. Ask instructor if you need help.
-
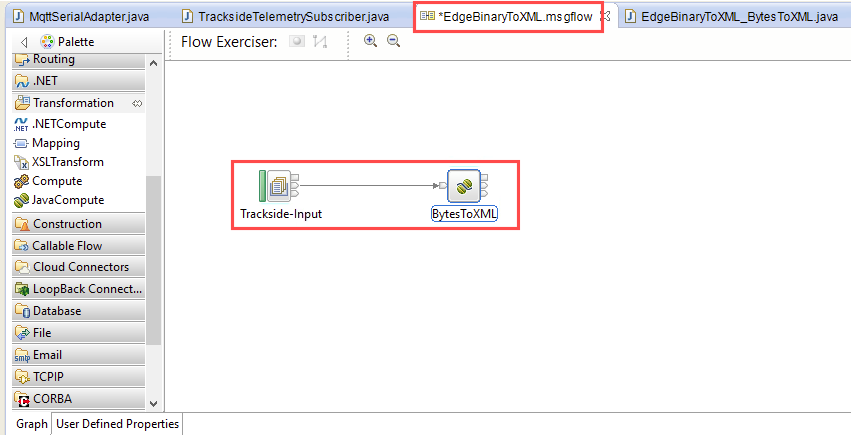
Return to the Message Flow editor. Wire the Out terminal of the MQInput node to the In terminal of the JavaCompute node by clicking each terminal in turn, noting that a arrow appears linking the two nodes together.
-
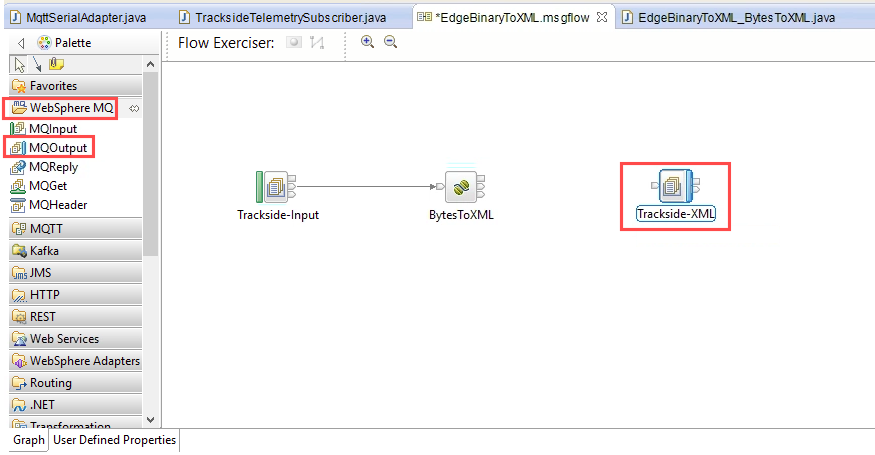
The final step for our flow is to send the XML output we constructed in the JavaCompute node to the destination queue. To do this first click open the WebSphere MQ section of the palette and drag an MQOutput node onto the canvas. Just as before, the name field underneath the icon will be highlighted and focused – name the node Trackside-XML.
-
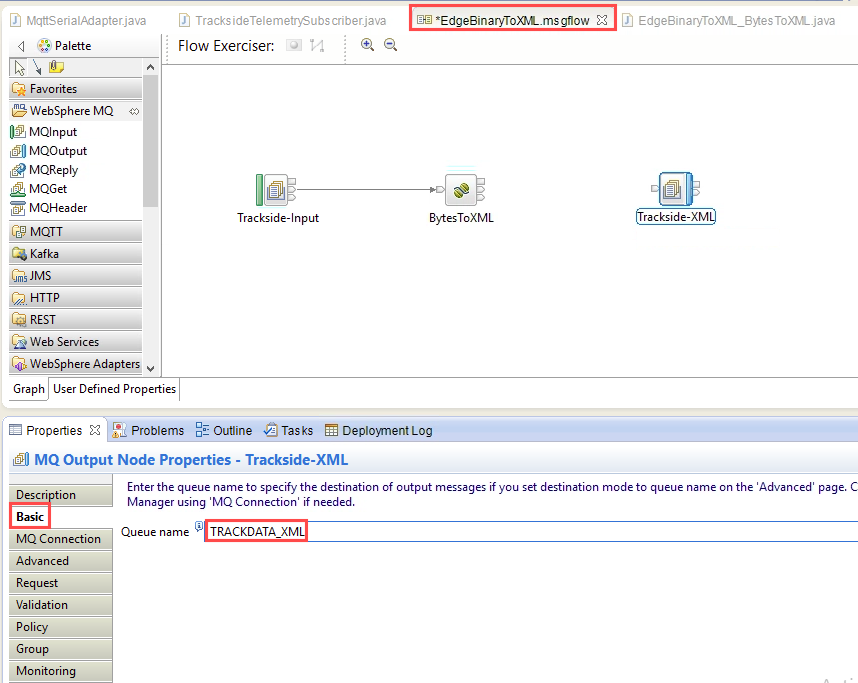
On the Properties view, set the Queue name field to TRACKDATA_XML. Our ACE instance will use our existing Queue Manager by default.
-
Complete the flow by wiring the Out terminal of the JavaCompute node to the In terminal of the MQOutput node.
-
Save the flow using Ctrl-S or the File menu.
Deploy the flow
-
Before we can test our message flow, we must make sure that our integration node is running.
-
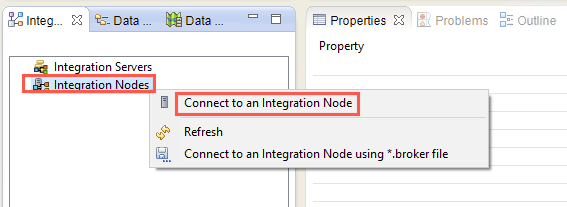
In the Integration Explorer, right click Integration Nodes and select Connect to an Integration Node.
-
Fill in the required parameters according to the table below.
Host Name Port User Name Password localhost 4414 iibadmin passw0rd 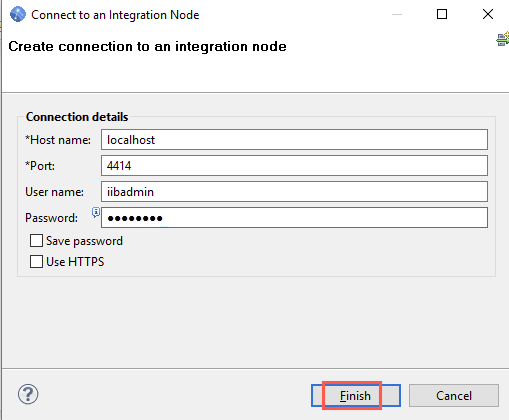
-
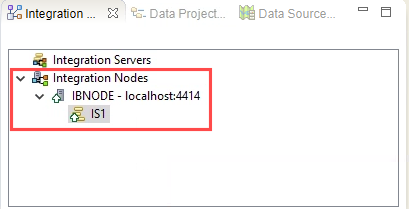
Expand Integration Nodes > IBNODE. Integration server IS1 will appear and should be running.
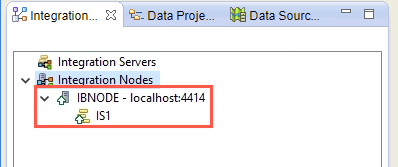
-
If it is not running:
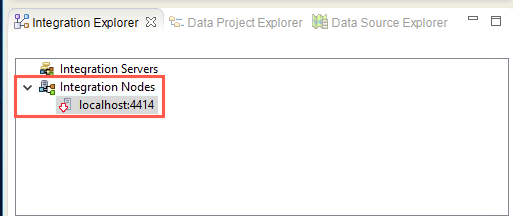
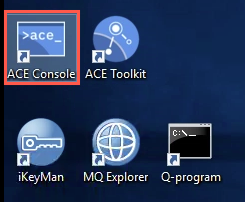
Open an ACE Console by double-clicking the its icon on the desktop.
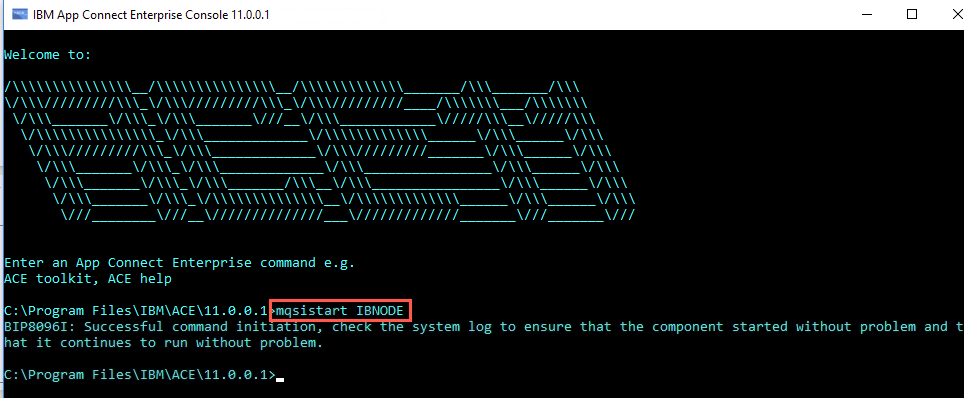
Enter the command mqsistart IBNODE.
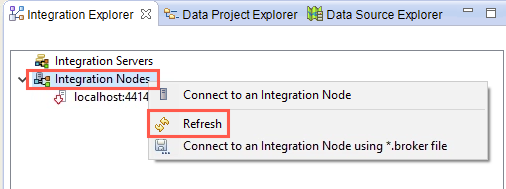
Return to the toolkit, right-click the integration node Integration Nodes and select Refresh.
-
When the integration node has started, you will see the red down arrow turn to a green up arrow. You will also see the default integration server running under the integration node.
-
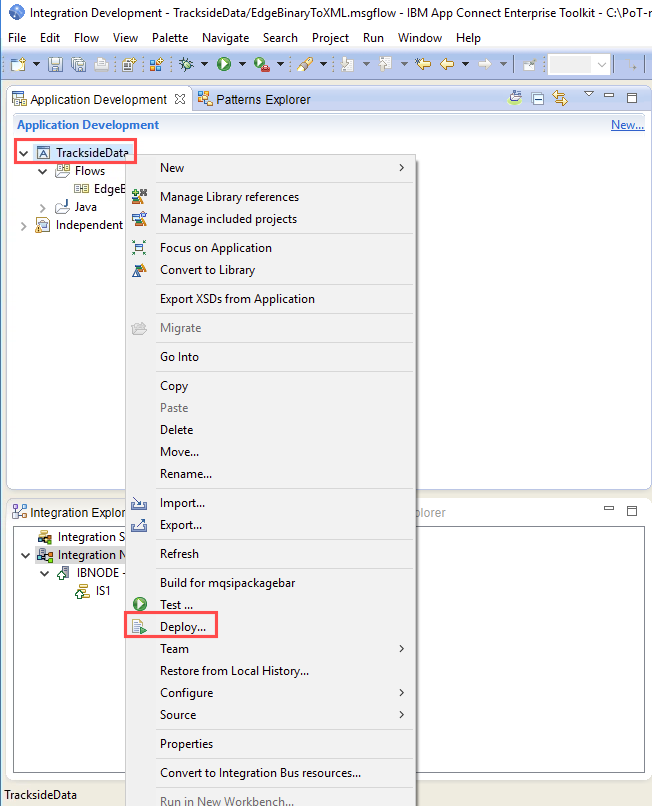
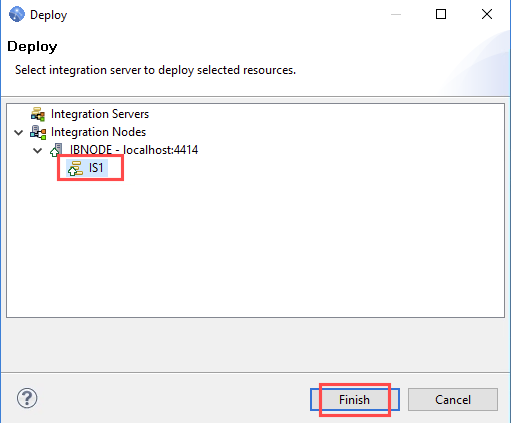
We can now deploy the message flow to the IBNODE instance that has been created. In the Application Development navigator, right-click the application TracksideData and select Deploy… . The Deploy dialog appears.
-
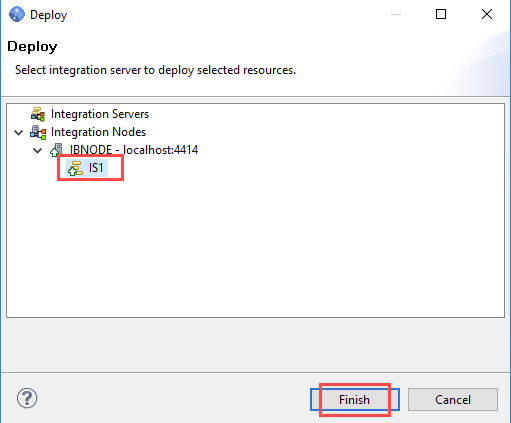
Select the IS1 integration server and click Finish. You will see a series of dialog boxes indicating progress.
-
You can verify that the flow deployed correctly by selecting the Integration Nodes view in the bottom left hand corner, and you should see the following:
-
We are now ready to test the flow.
Testing the ACE flow
We will now test the ACE flow using the sample we created previously in Eclipse.
-
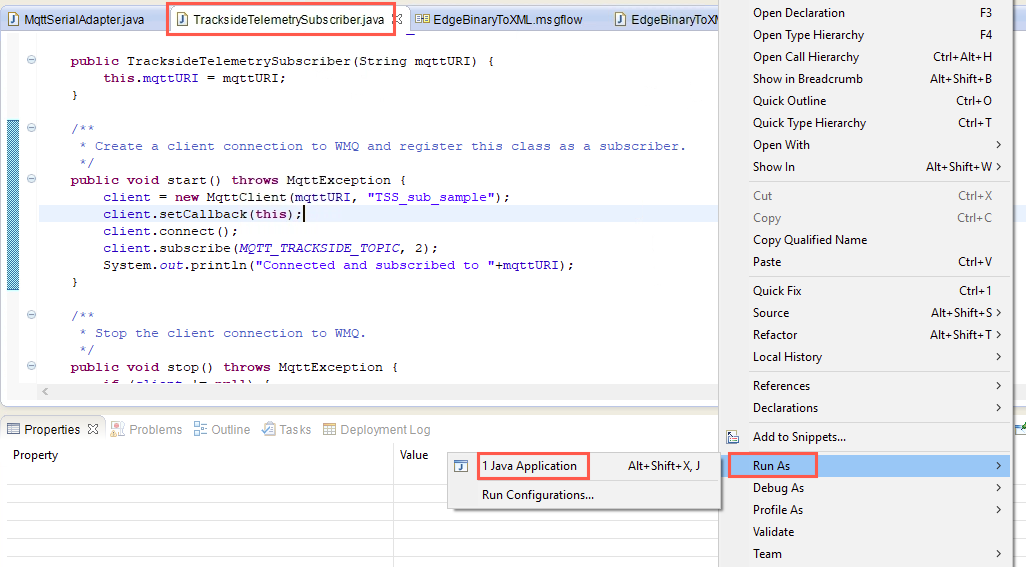
Click the tab for the TracksideTelemetrySubscriber.java program. Right-click anywhere on the edit panel and select Run As > Java Application.
As before, confirm that there is output on the Console view indicating that the application has successfully connected to MQ. You should see the Console pop up for the TracksideTelemetrySubscriber and a message saying that it is connected and subscribed to port 1883.
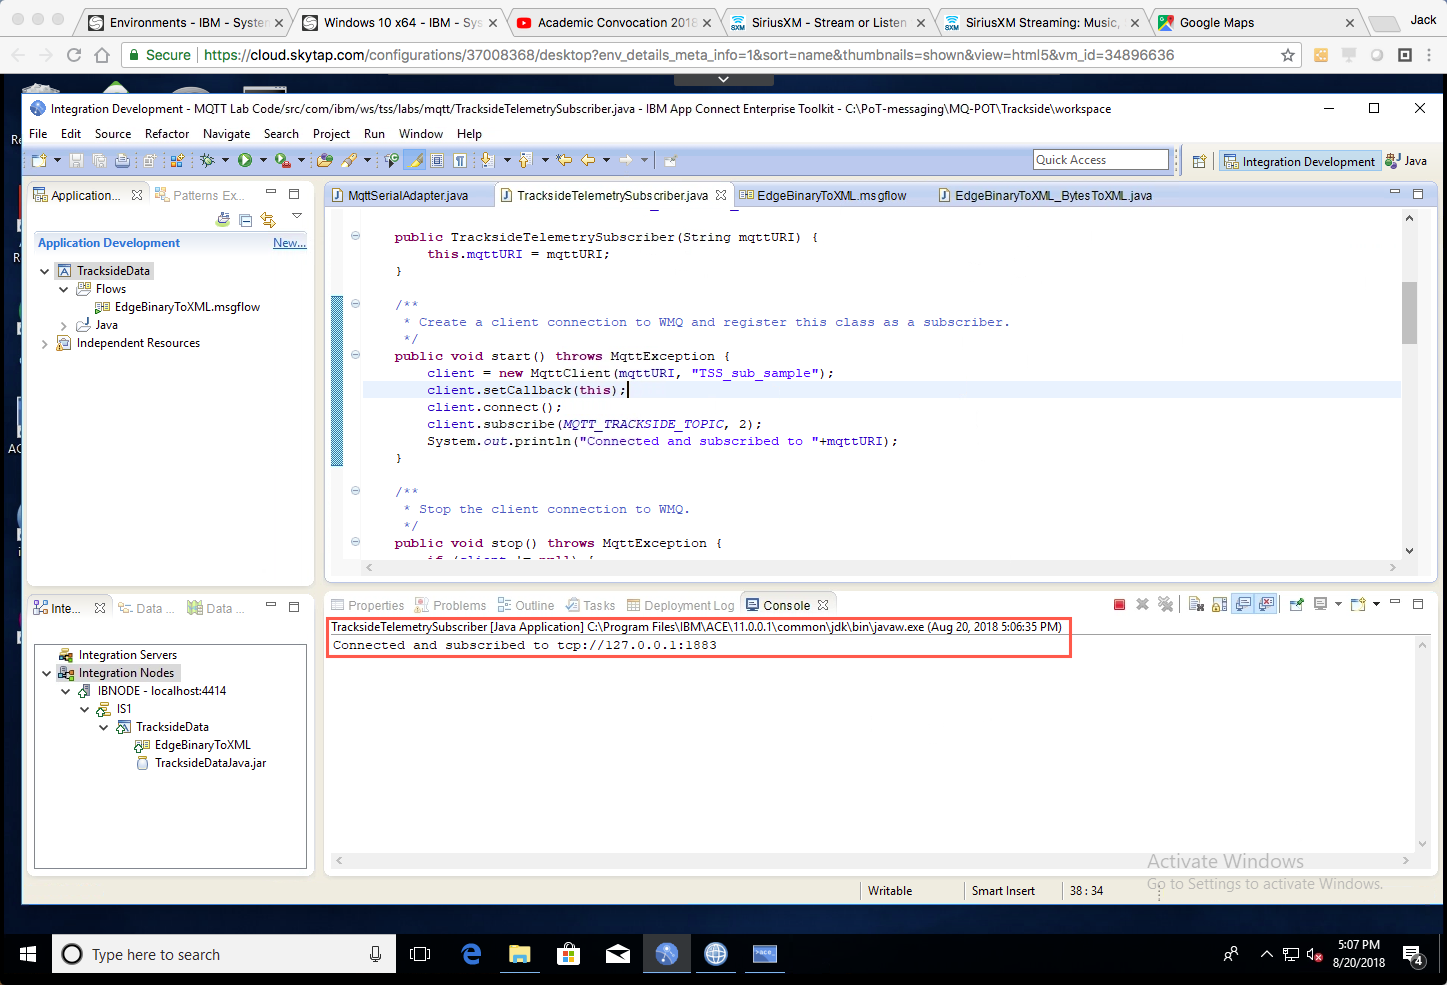
If the connection to MQ Explorer has been lost, repeat the Run-As Java Application again.
-
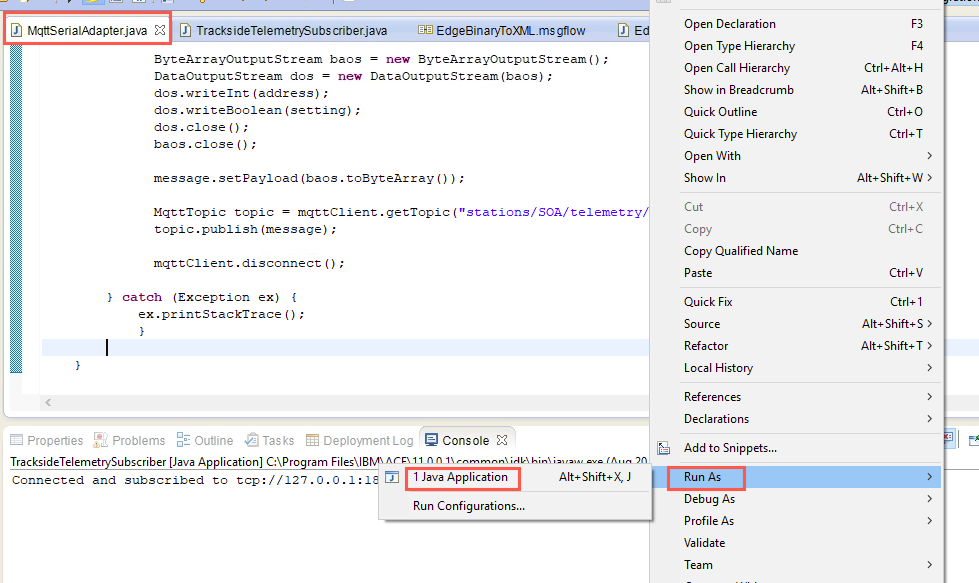
Now run the MqttSerialAdapter.java application once again. Click the tab for MqttSerialAdapter.java. Right-click anywhere on the edit panel and select Run As > Java Application.
-
You should see output on the Console view indicating a switch state.

-
In this case, switch 405 has been set to the ON state.
-
As well as the subscriber application, our ACE flow also has picked up the message via our subscription in MQ and the TRACKDATA_INPUT queue, processed it into XML and put it in the TRACKDATA_XML queue. We will now verify the case using the RFHUtil utility.
-
Open RFHUtil from a command prompt with the command: \PoT-messaging\MQ-POT\tools\rfhutil\rfhutil. Alternatively, you can double-click the RFHUtil icon on the desktop.
-
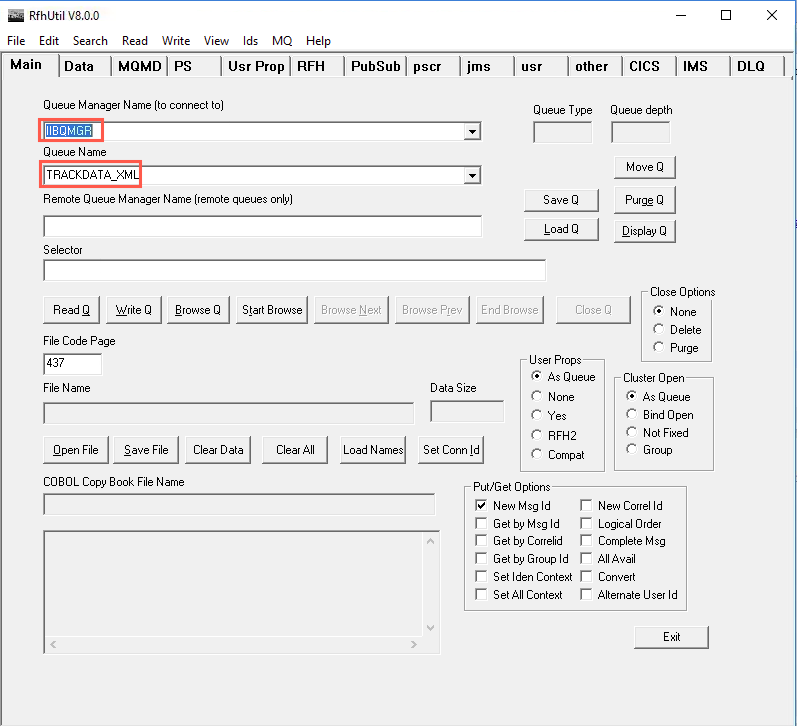
When RFHUtil opens, select the IIBQMGR Queue Manager and the TRACKDATA_XML queue using the drop down fields as shown below.
-
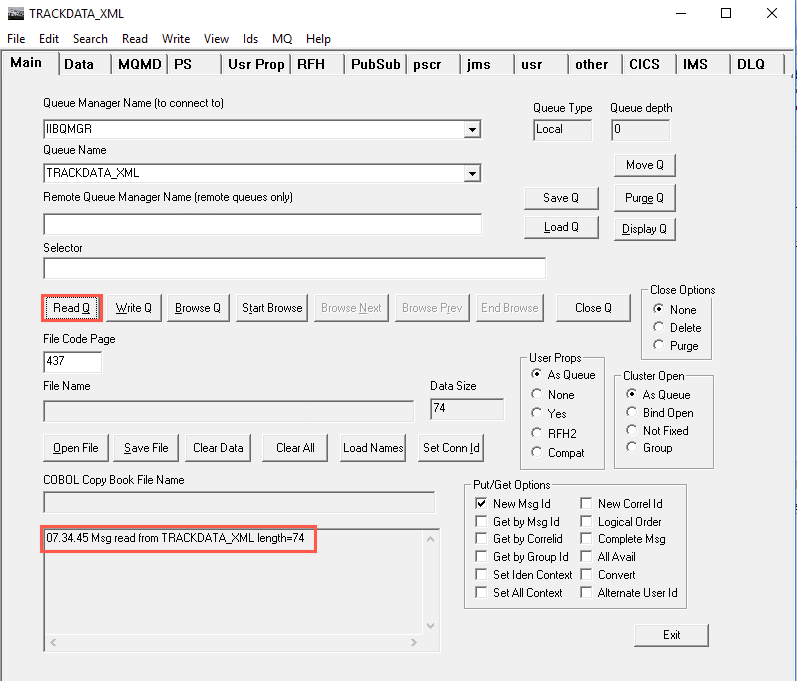
We should have a message waiting on the queue. Press the Read Q button to pull the message off the queue.
-
You should see the text area in the bottom left corner is updated.
 Note:
Note:
If you receive a message that there are No messages in queue, then the channel MARS.IIBQMGR may have timed out. Restart the channel per instructions in Section Setting Up MQ steps 32 - 33.Note If you receive a message that there are No messages in queue, then the channel MARS.IIBQMGR may have timed out. Restart the channel per instructions in Section “Setting Up MQ” steps 32 - 33.
-
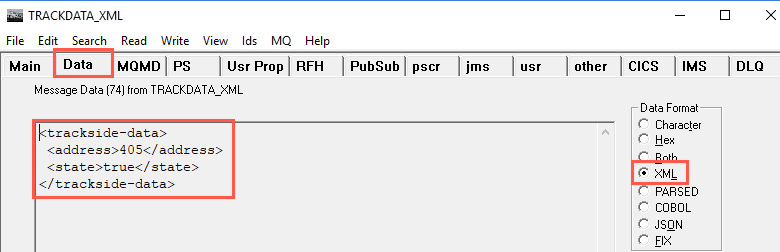
You can now view the content of the message by selecting the Data tab on RFHUtil and XML radio button for Data Format. You should see a dump of the message content formatted in XML according to the logic specified earlier in the JavaCompute node in ACE.
 Note:
Note:
Your test results will vary. Switch numbers will be different on your tests as well as the settings. Notice that the message length is 75 for false settings and 74 for true settings. -
As you can see in this case the setting for address 405 has been set to true (i.e. ON), as indicated on the Eclipse console.
-
Compare the XML message to the Console message in the ACE Toolkit. The switch number and the setting should match.
-
Repeat section “Testing the ACE Flow” steps 2 - 12 a few more times and check the results.
-
This lab session is now complete. You have seen that a telemetry application using the MQTT protocol can integrate with an enterprise application running in IBM App Connect Enterprise.
Summary
We have now taken a quick look at the MQ Telemetry product offering. Although the sample is relatively simple, you can now see how this pattern of deployment would form a part of a solution. To recap, in this lab we did the following:
-
Examined a MQ Telemetry installation.
-
Developed a simple Java publisher application using Eclipse and the MQTT version 3 client.
-
Explored and tested an MQTT subscriber application.
-
Tested the publisher application using the subscriber application.
-
Developed an ACE message flow to take the raw MQTT binary data and transformed it into enterprise-friendly XML.
CONGRATULATIONS!
You have completed this hands-on lab.