Configuring MQTT Telemetry in IBM MQ
This document is a short hands-on lab that provides a look at the MQTT support now available as a product extension for IBM MQ (MQ), known as IBM MQ Telemetry. The lab is based on the production release of the code.
Product versions:
-
IBM MQ
-
IBM MQ Telemetry
-
IBM App Connect Enterprise (formerly known as IBM Integration Bus)
-
Target Audience: IT Specialists and Architects with a basic understanding of messaging
Course Objectives
The material presented in this course is intended to accomplish the following:
-
Familiarize you with IBM MQ Telemetry.
-
Gain hands-on experience coding a Java telemetry program
-
Gain hands-on-experience administering a telemetry application
Sample Scenario
The scenario for this lab is a “Smarter Transport” solution to enable a railway operator to monitor trains in a railway network. The movement of trains around the track is determined by the operation of particular known switches on the railway network. At the side of the track, data regarding the state of each given switch is collected from the hardware using an RS-232 serial link by a low-powered controller unit. The controller unit runs a cut-down version of the Linux operating system and has a J2ME Java environment installed. The link between the controller box and the enterprise is provided by a GPRS network that is relatively slow, prone to failure and has an expensive tariff based on data consumption.
Using MQTT, the operator can make more efficient use of the GPRS network, whilst realizing the benefits of a reliable MOM protocol. Furthermore, by standardizing the data link over MQTT, the operator is able to decouple the overall system from the sensor hardware which is a number of years old and due for replacement.
Within the enterprise the operator has a number of proprietary visualization tools that reconcile the switch operations together to determine the location of a given train on the track. These proprietary applications are integrated with the MQTT data feed via an ACE integration hub.
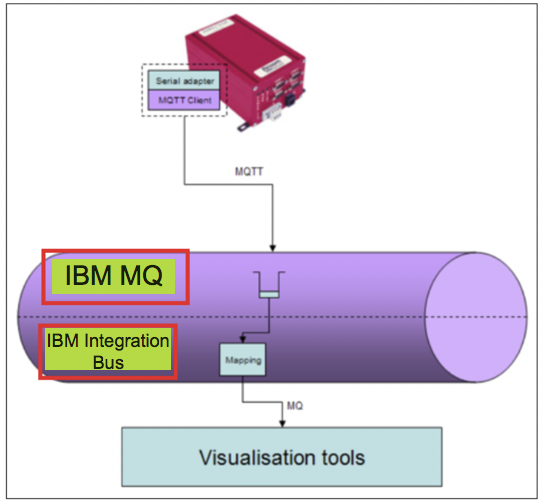
This lab will demonstrate the basics of writing an MQTT application using this worked scenario, both in terms of producing messages and consuming them. The lab includes a look at how to write a simple Java application, and how to handle MQTT messages within ACE.
This document was written using IBM Integration Bus V9 (IIB). IBM App Connect Enterprise V11 (ACE) is the next version of IBM Integration Bus. IIB and ACE are used interchangebly.
Executing Scenario
Starting up and exploring lab image
The VMware image for the lab comes pre-installed with all the software you need. Once you have started the image, you will see a Windows 10 desktop.
-
If you are already logged on the VMware image as mqlab, go to step 2. If logged on as Administrator (or other user), log-off and logon as mqlab according to the following instructions:
-
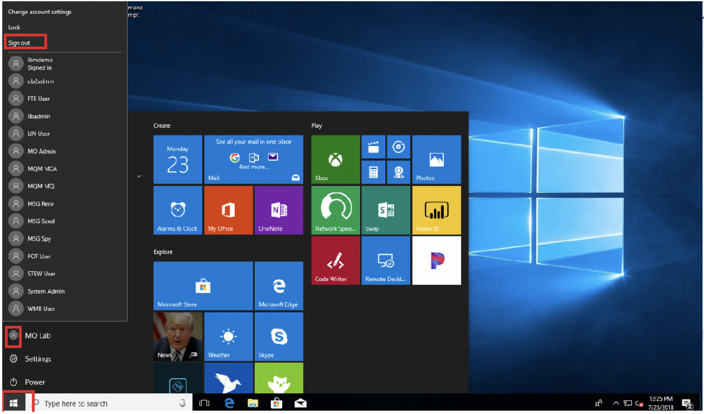
Click the Windows icon in the lower left portion of your screen.
Next, click the Person icon. If not logged in as MQ Lab, click the “Sign out” button.
-
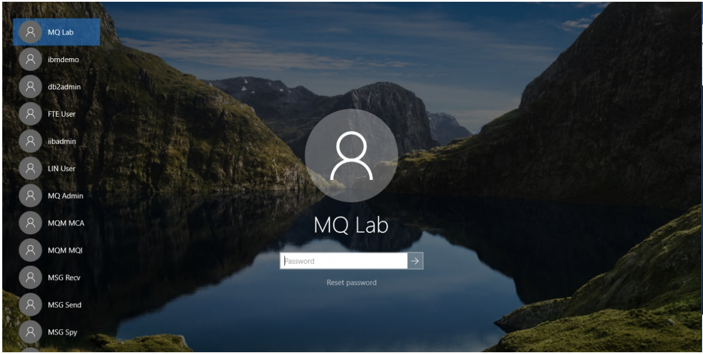
Log in as MQ Lab.
Enter password for Password and click the arrow to log on as mqlab.
-
Close or dismiss any pop-ups about DB2 or Filezilla.
-
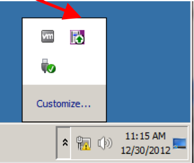
After a short time the Windows System Tray should indicate that IBM MQ is up and running.
-
In MQ V9, the Telemetry feature is now part of the base system install. MQ Telemetry was one of the options chosen when IBM MQ was installed on this system. IBM MQ is up and running, and we can now use the MQ Explorer to inspect the installation.
-
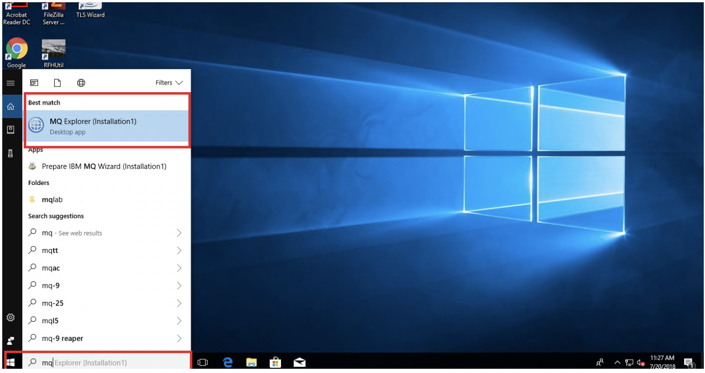
Click the Windows search bar at the bottom left corner of your screen and begin typing in “MQ Explorer”.
When MQ Explorer shows up at the top as “Best match” click it to open the MQ Explorer program.
-
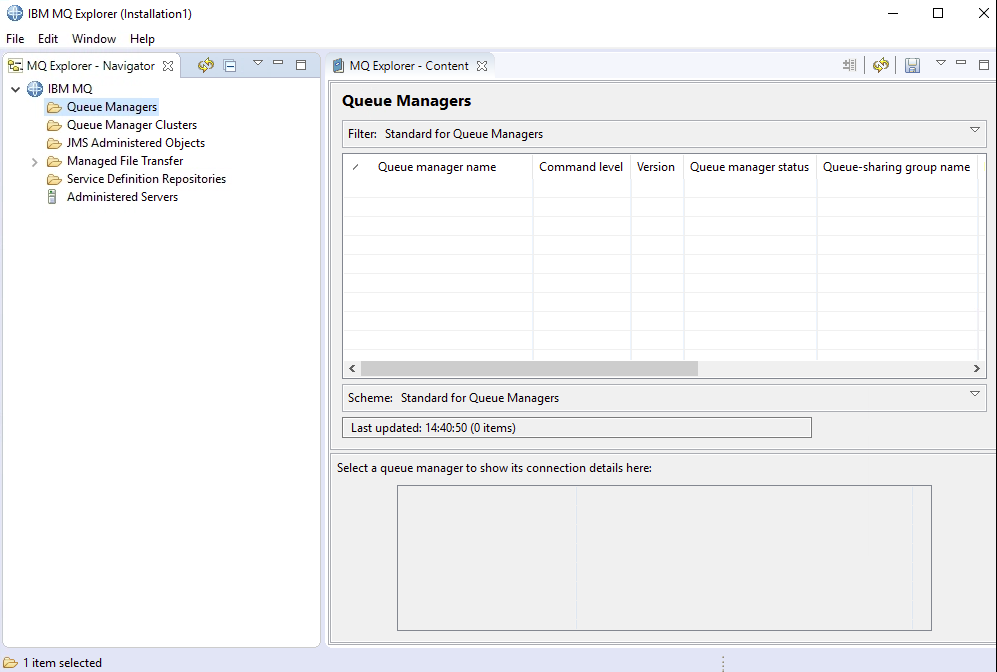
The MQ Explorer application will open.
-
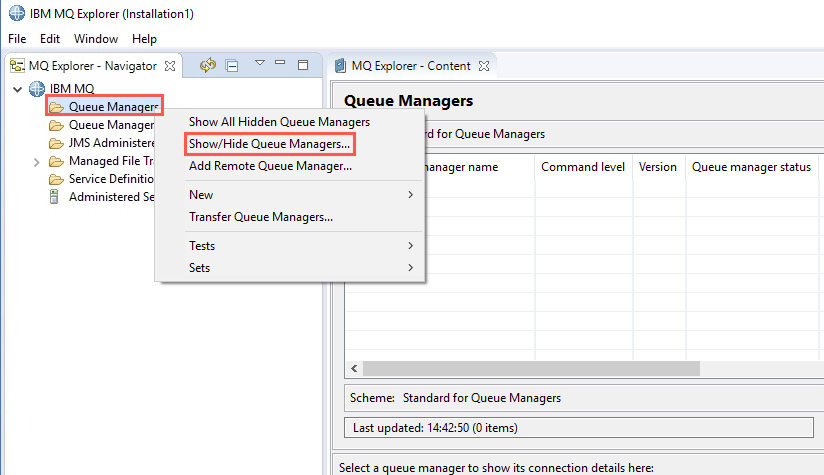
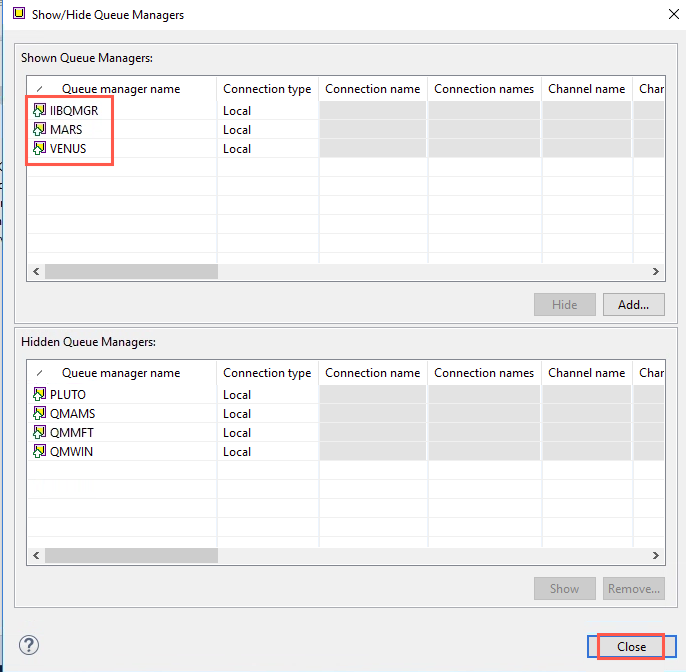
We will be using three queue managers in this lab – MARS, VENUS, and IIBQMGR which are defined but not shown. Since they have already been defined, you need to un-hide them. Right-click queue managers and select Show/Hide Queue Managers.
-
Select MARS, hold down the Ctrl key, then select IIBQMGR, and VENUS. Then click Show. Make sure to select the ones without the hostname and port number. Those represent remote queue managers. We want to use the local ones.
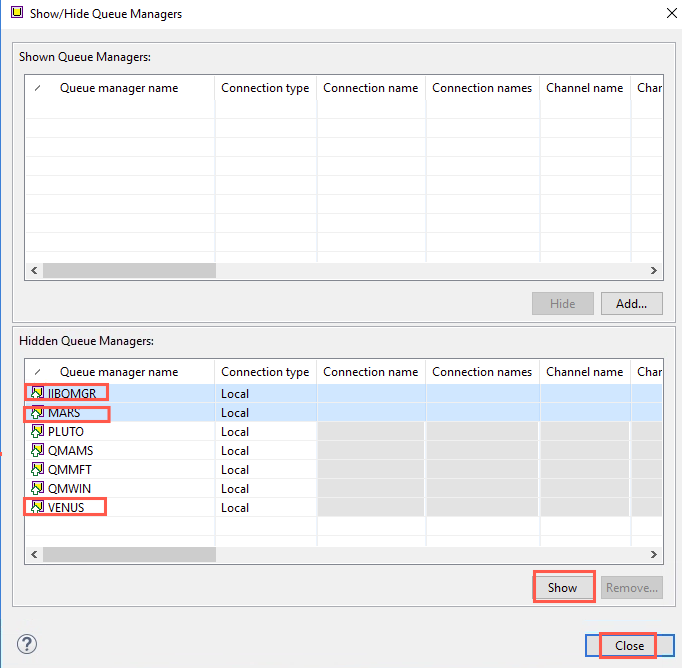
You will now see MARS, PLUTO, and VENUS with the other queue managers in the Shown Queue Managers panel.
-
Click Close.
-
The VMWare image we will be using has a simple setup with two queue managers associated with MQ V9 called MARS and VENUS, and also another queue manager called IIBQMGR. We will use MARS to explore IBM MQ Telemetry.
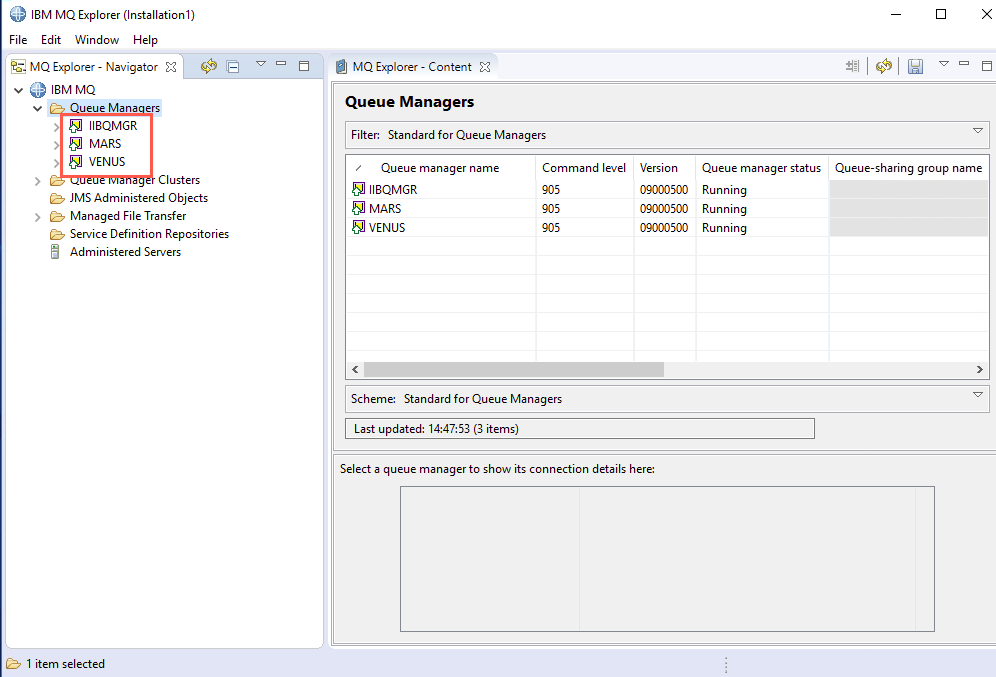
-
Expand queue manager MARS folder.
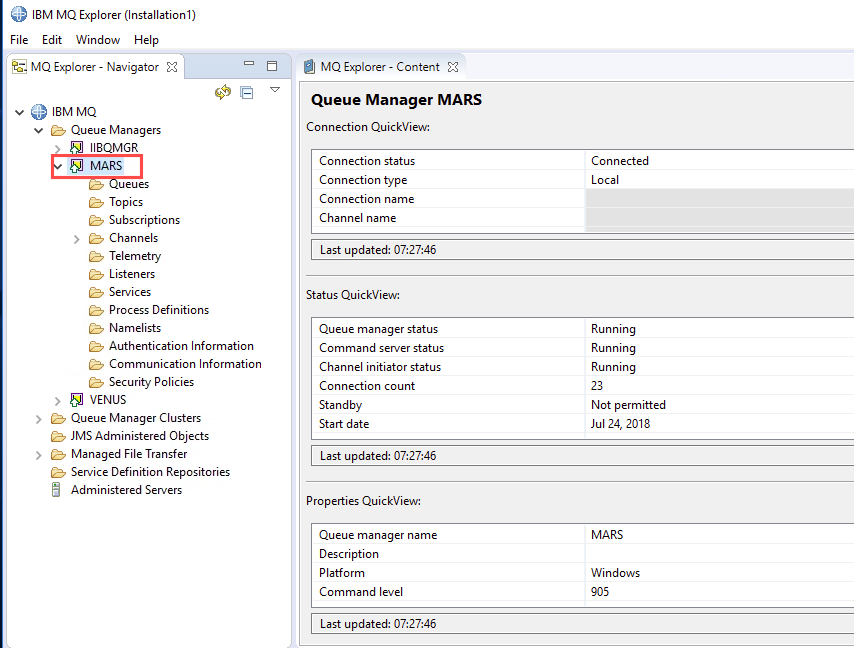
-
One of the things which differs between a queue manager with the Telemetry feature installed and one without it is that there are some new objects visible in MQ Explorer.
Click the Telemetry folder under MARS. There you will find a Welcome page that will enable the Telemetry support to be configured.
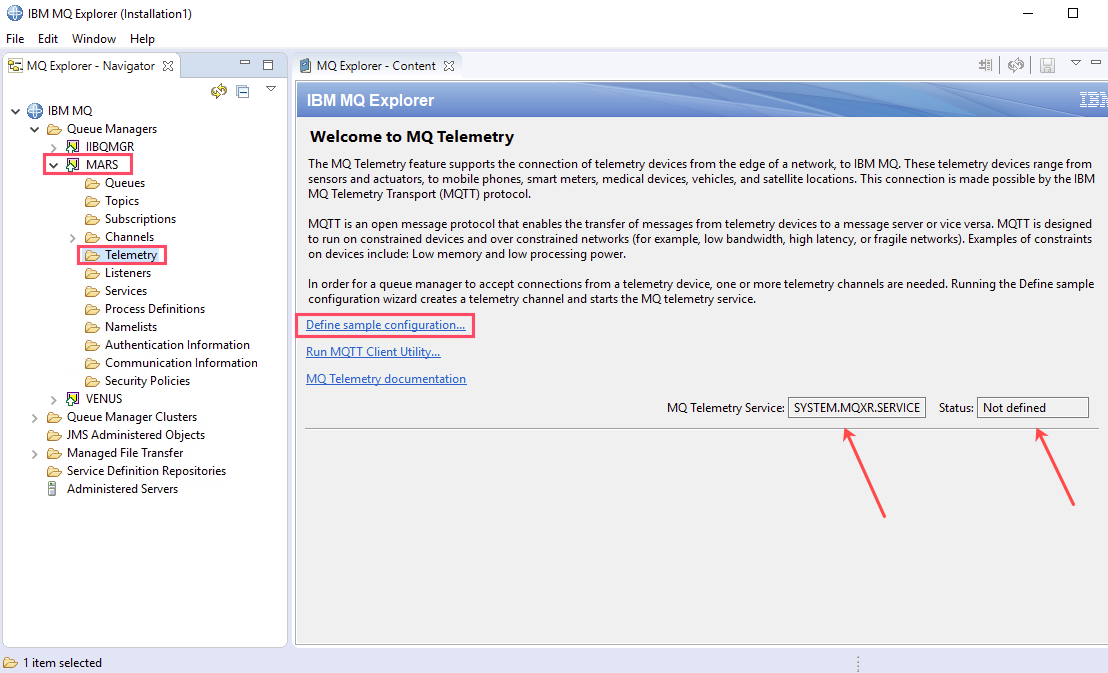
-
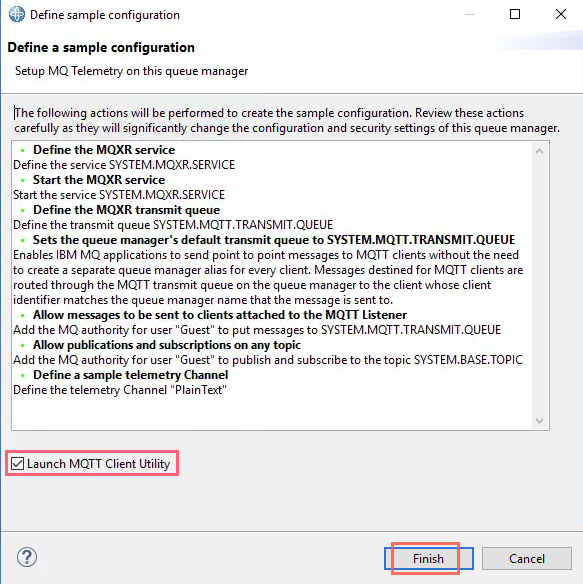
Click the link Define sample configuration… and a dialog will appear describing the steps that will be taken to enable the queue manager for Telemetry support.
-
This will configure and start a new MQ Service SYSTEM.MQXR.SERVICE, a new transmission queue, set some permissions, and finally create a new Telemetry channel called PlainText (MQXR is the name of the component that enables Telemetry support, and stands for MQ eXtended Reach).
-
After these definitions have been created there is an option to launch the MQTT Client Utility to enable testing of the configuration. Leave this option selected and click Finish to continue.
-
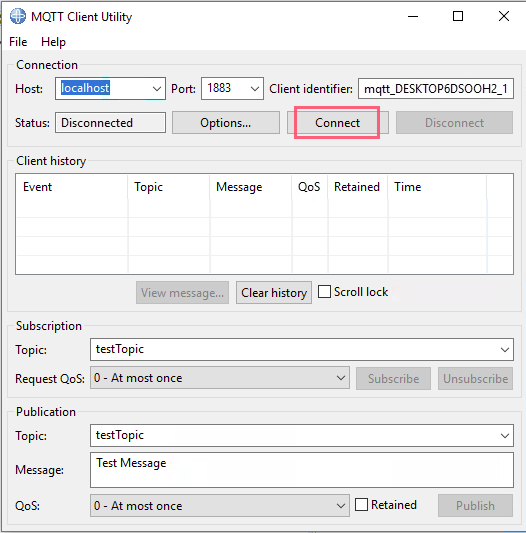
Once the sample definitions have been created, the MQTT Client Utility will launch. We will use this to test that the Telemetry setup has been completed correctly. If you are familiar with MQTT then you may find that this user interface resembles the MQTT Java Client GUI that was shipped in a former IBM MQ Integrator SupportPac (IA92). The functionality it offers is similar, but it is enhanced and integrated into MQ Explorer for easy testing.
-
Connect to MQ by clicking the Connect button.
-
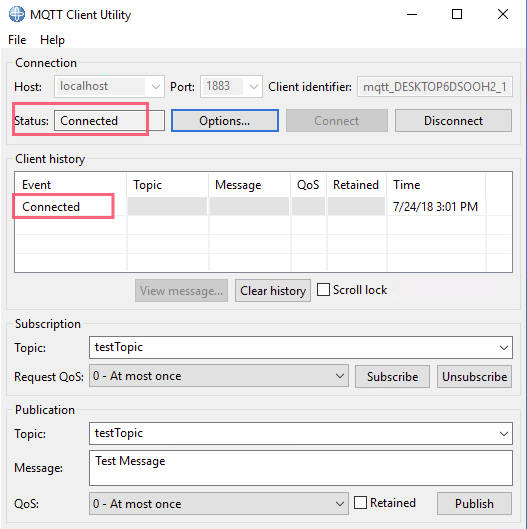
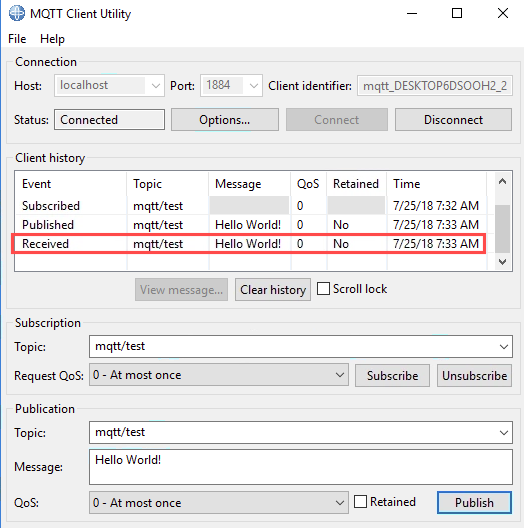
You should see the Disconnect button become enabled and a message appear in the history table indicating that the client utility is connected.
-
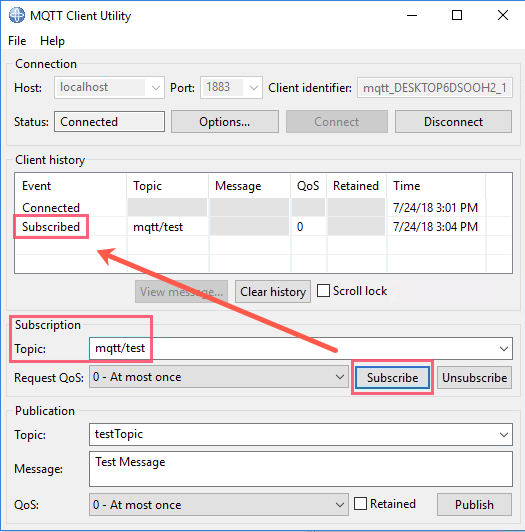
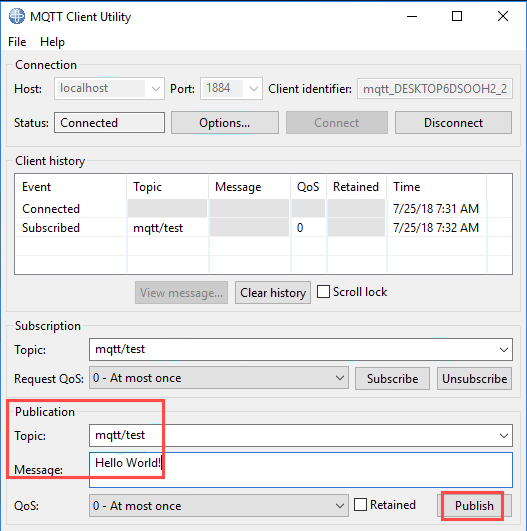
We will now do a simple test where we create a subscription and publish message. Subscribe to the topic mqtt/test by filling in the Subscription Topic field with mqtt/test and pressing the Subscribe button.
-
Now publish a message by filling in the Publication Topic field with mqtt/test. Enter “Hello World!” into the Message field below and press the Publish button.
-
You should see the following (you may need to resize the window slightly to see the Client history table contents fully):
-
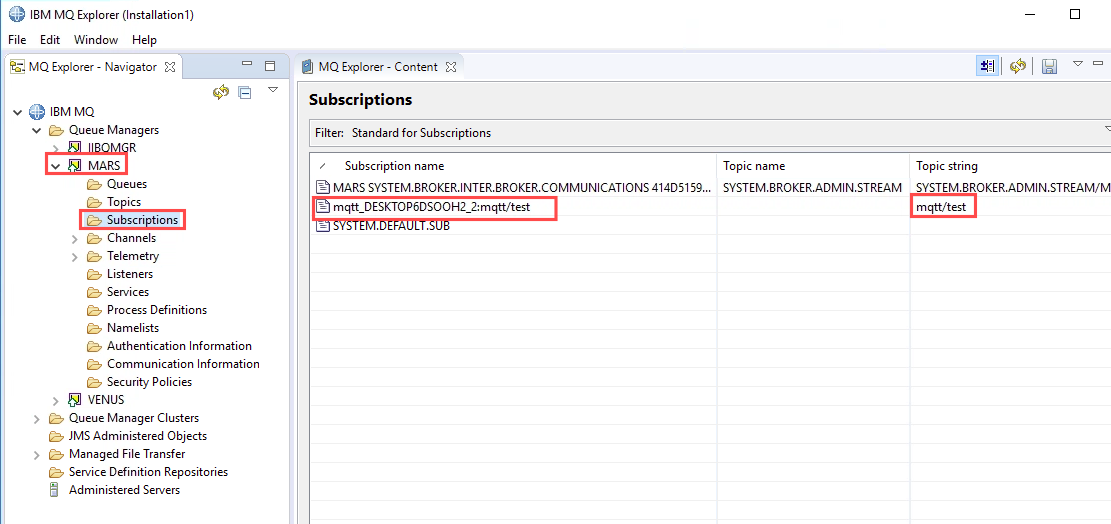
We have now setup and run a basic test of the MQTT functionality. We will now explore what effect this has had in IBM MQ. Leave the MQTT Client Utility window open. In the main MQ Explorer window locate and select the Subscriptions folder on the Navigator tree. You will notice that the subscription from our MQTT Client Utility appears on the list of subscriptions inside MQ – i.e. the MQTT subscription is just the same as a conventional MQ subscription. This indicates that MQ publications and subscriptions will interoperable with MQTT.
-
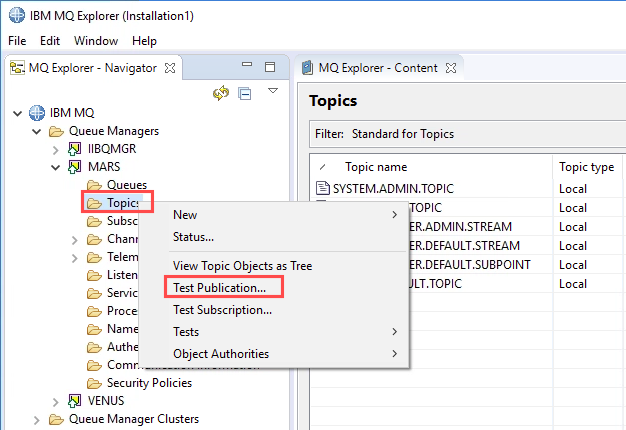
To demonstrate that MQ and MQTT are interoperable, right-click the Topics folder and select Test Publication… from the pop-up menu.
-
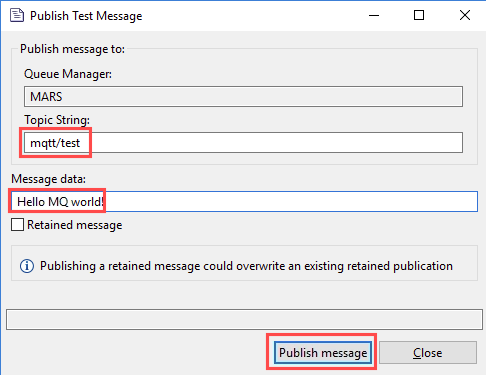
The Publish Test Message dialog box will appear. Set the Topic String field to mqtt/test and the Message data field to “Hello MQ world!”.
-
Click the Publish message button followed by the Close button.
-
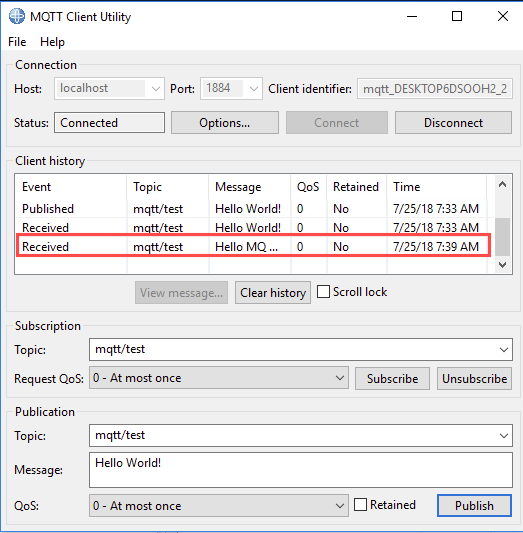
Go back to the MQTT Client Utility window. You should see that the message we just published directly through MQ was received via MQTT.
-
This demonstrates that MQTT clients can receive messages published using MQ.
-
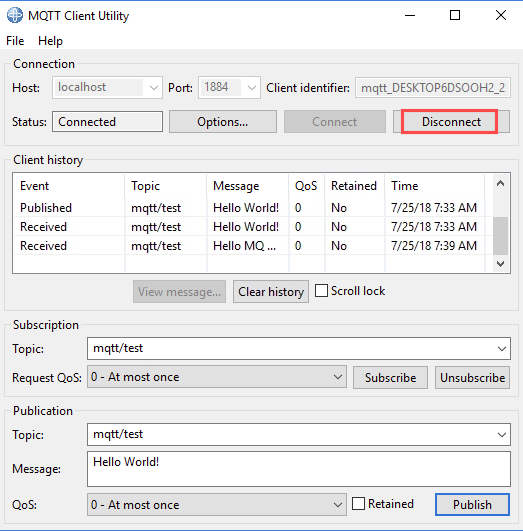
Click the Disconnect button on the MQTT Client Utility and close the window.
-
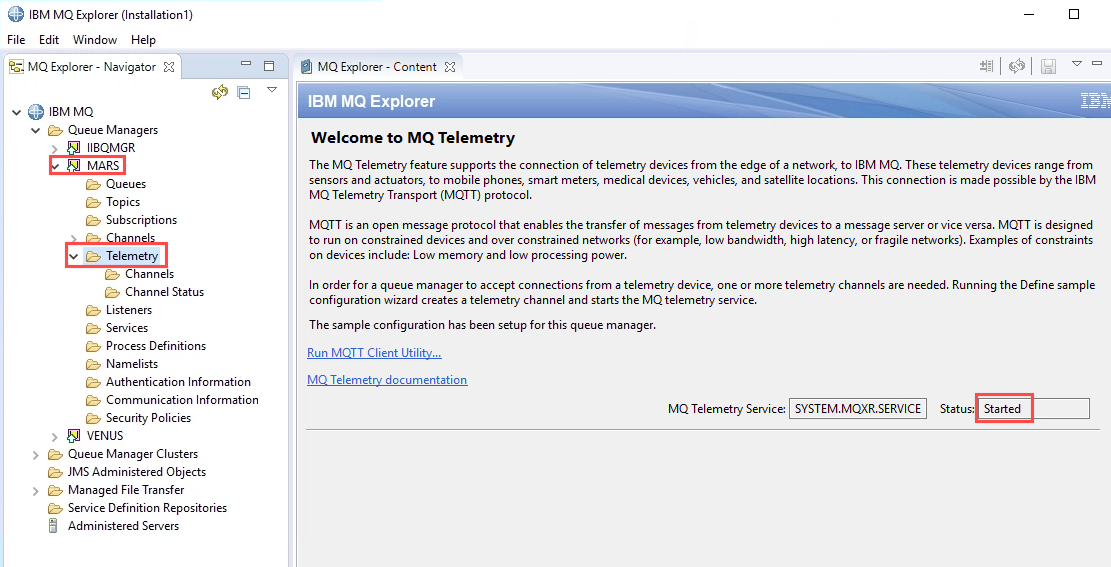
Using MQ Explorer, take a look at some of the other objects that have been created when the Telemetry feature was installed and configured. Under the queue manager MARS, expand the Telemetry folder to show the Channels and Channel Status entries. Click the top-level Telemetry folder. In the Content page, notice that there is a reference to an MQ Telemetry service called SYSTEM.MQXR.SERVICE. The service should show Started. If not, refresh MQ Explorer.
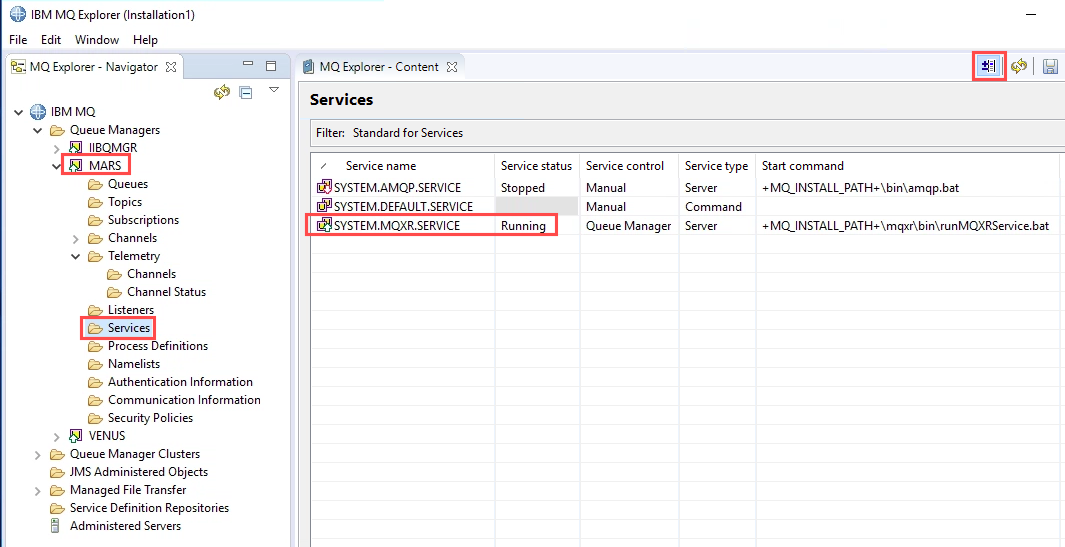
The Telemetry support augments the base MQ installation with an additional MQ Service to handle the MQTT protocol translation into MQ. Click the Services folder. Initially the content panel will be empty. Click the Show System Objects button at the top right of the table, and the system ser enables interoperability between the MQ and Telemetry protocols.
-
Another set of objects created by the Telemetry feature are some additional system queues. Click the Queues folder below MARS in the Navigator, ensure that the Show System Objects toggle is still enabled, and scroll down the list in the content panel.
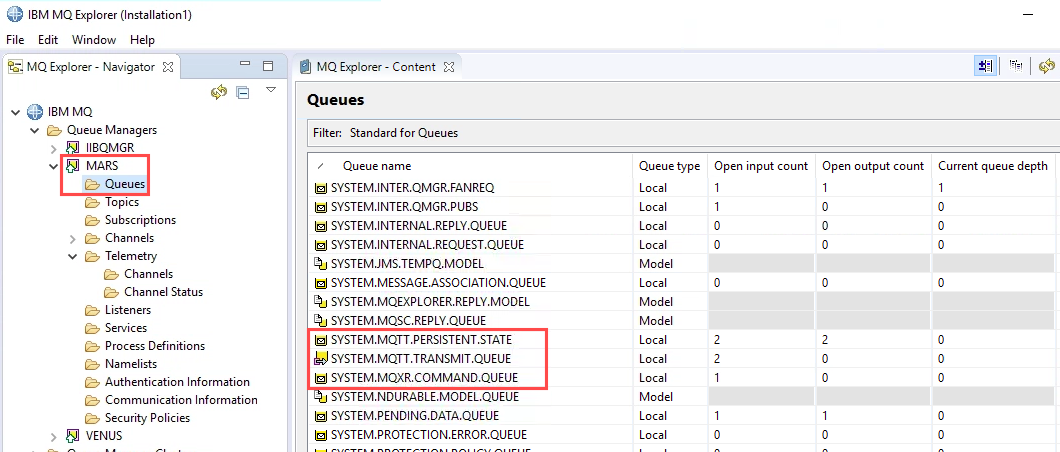
There are 3 new, MQTT-related queues created to support the Telemetry feature. There is no need to modify these objects – this part of the exercise is just enabling you to explore the new feature.
-
Finally in this section, we will investigate the Telemetry Channels. Click the Telemetry > Channels folder in the Navigator view.
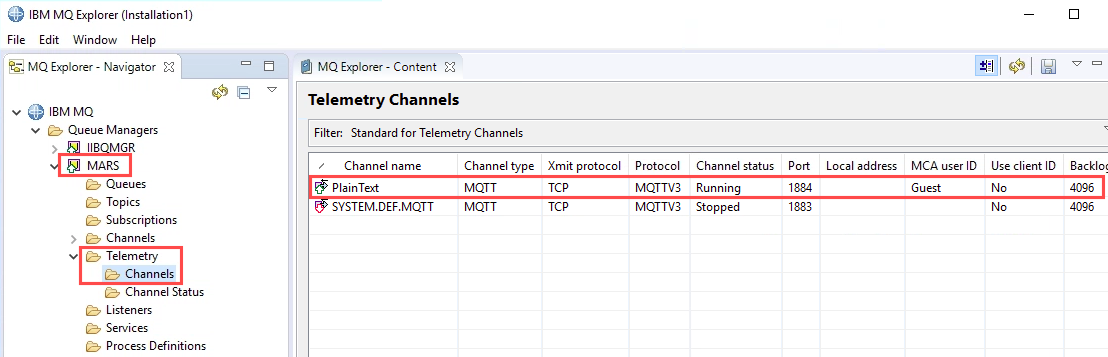
The “PlainText” channel configured by the wizard we used previously is shown and is running on port 1883 (the default MQTT port). This has been configured to allow Guest access for ease of quick testing. It is possible to configure multiple Telemetry channels with different characteristics depending on the client requirements.
-
This section is now complete. The required components should now all be started ready for the next labs.
CONGRATULATIONS!
You have completed this hands-on lab.