Lab 1 - Creating an MQ Instance Using the Platform Navigator
Starting with this lab, each attendee will be assigned an ID number (01 - 30) by the instructor if running a PoT. This number will have been included in your attendee email. If (IBMers) running this lab independently, choose any number between 01 - 30. ID 00 is always reserved for the instructor during PoTs.
These instructions assume you are using the Virtual Desktop Image (VDI) from the IBM Technology Zone for the MQ on CP4I PoT.
Getting Started with MQ on Cloud Pak for Integration
These instructions document how to setup MQ within Cloud Pak for Integration which is accessible from within the OpenShift Cluster. The instructions have been created using a Red Hat OpenShift environment deployed on bare metal servers on IBM Cloud however the process should be similar on other environments.
Important points
The lab guide assumes you are using the RHEL Virtual Desktop Image (VDI) VM from the IBM Technology Zone. If you are using another platform, you can download the necessary artifacts from the github repo. The instructor will provide directions.
If running as part of a PoT, you will only see your project (namespace). The name will be of the form clustername + your student number. For instance if the cluster name is chopper and your student number is 10, your namespace will be chopper10. So each attendee has a unique namespace and will only be authorized to see that namespace. Within your namespace you will only find your queue manager mq10mi in this example. You will also find a previously configured queue manager qmgrxx, where xx = your student number. That queue manager will not be used in this PoT and can be ignored.
You will see other projects such as cp4i-ace, cp4i-api, cp4i-mq. Since this cluster will be shared with other PoTs those have been predefined. They are not to be used for this PoT and can be ignored. You will only use your assigned namespace and at times cp4i. cp4i-mq was used to document part of this lab. Where you see cp4i-mq, you will substitute your assigned namespace.
The screen shots were taken on a test cluster and many will not match what you see when running the lab. Particularly URL values will be different depending on the cluster where CP4I is running. Projects (Namespaces) may also vary. It is important to follow the directions, not the pictures.
Deploying IBM MQ for internal consumers
-
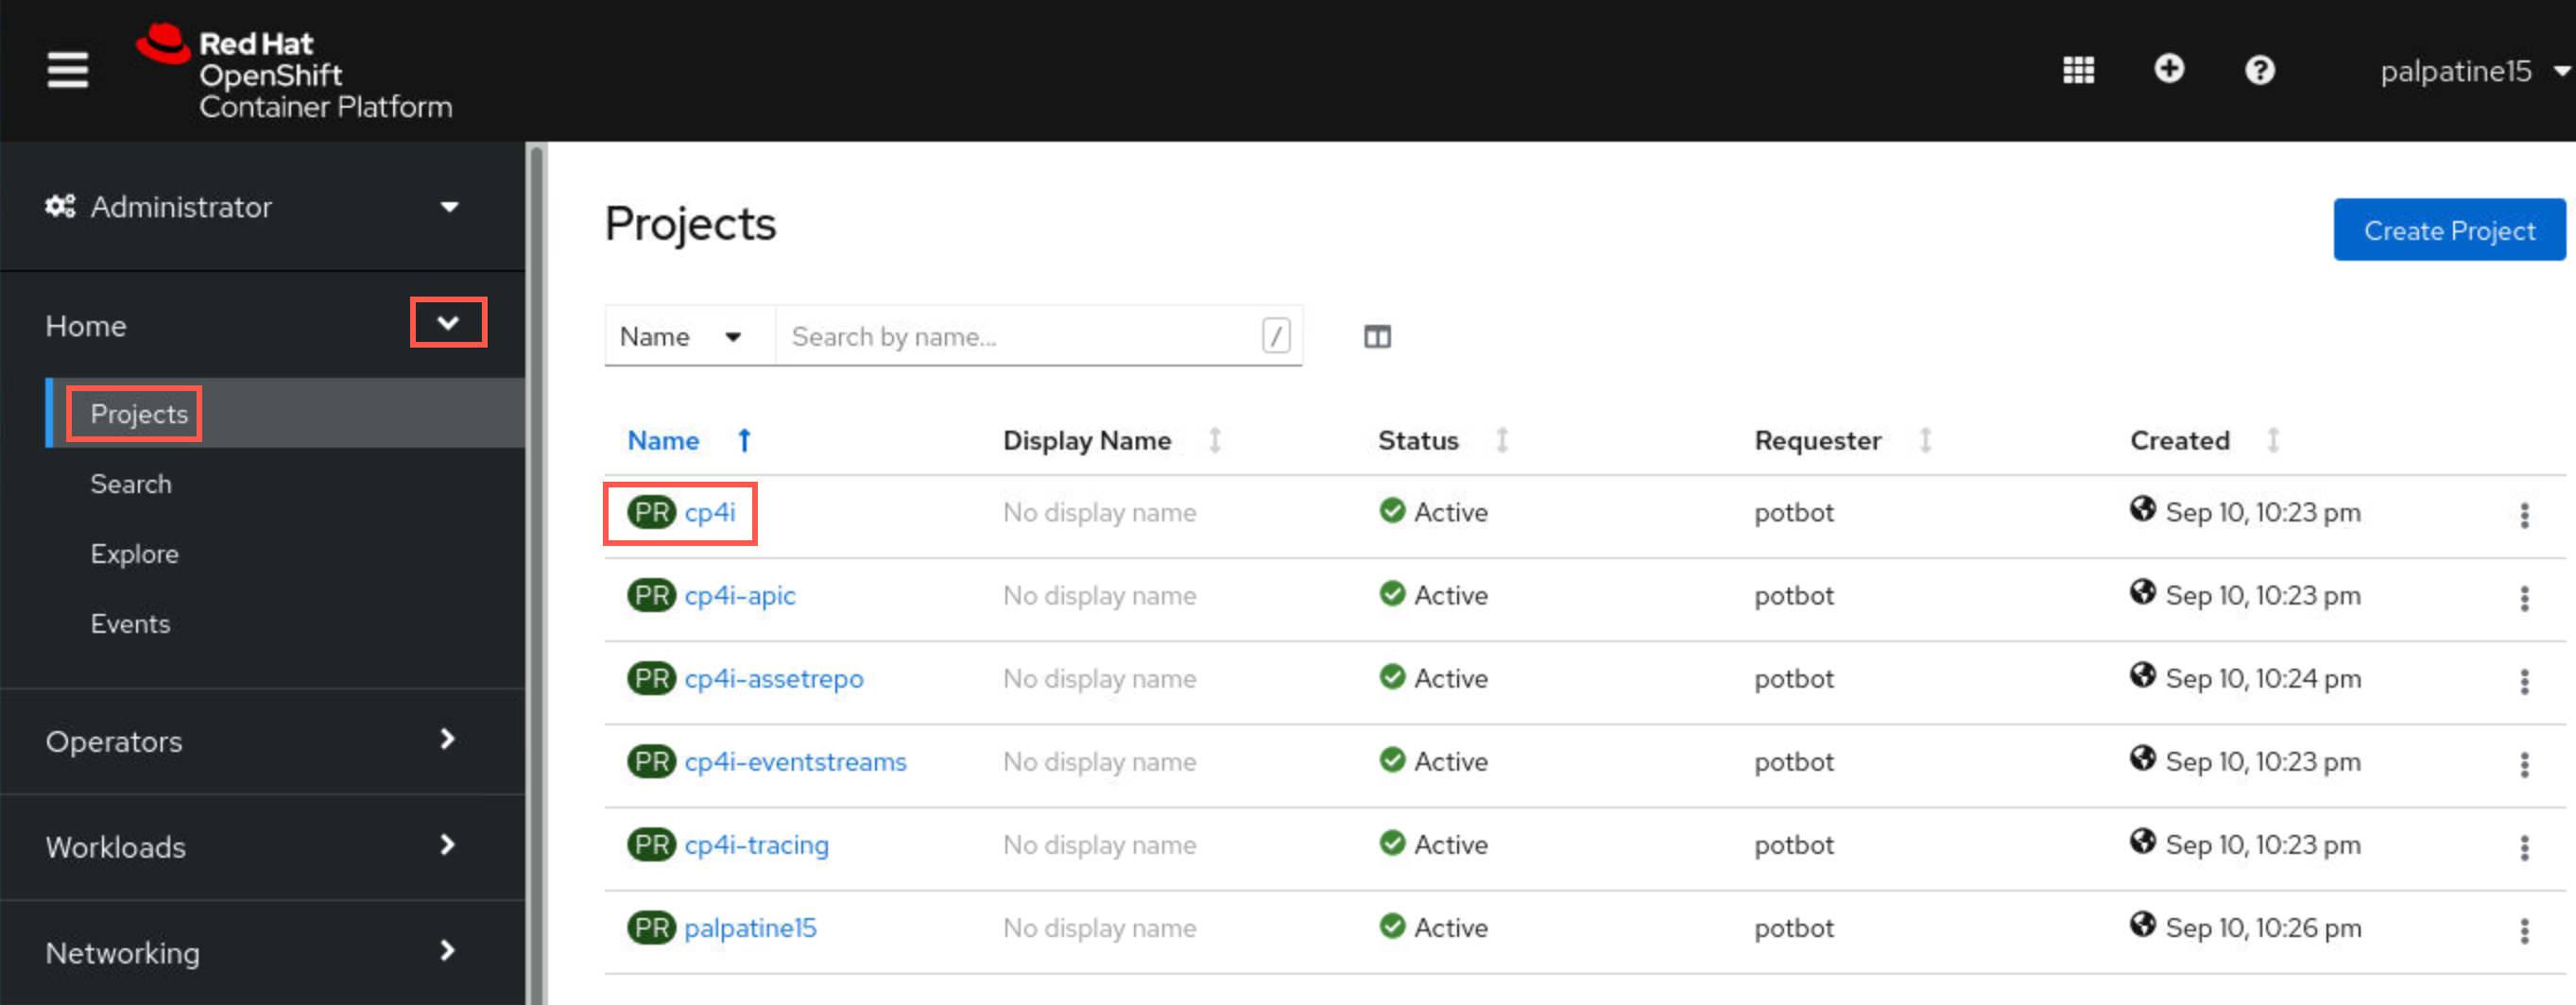
You should have already connected to the OpenShift cluster via the URL provided in your student email. Click Projects, locate the cp4i project. Click the hyperlink to select the project.
-
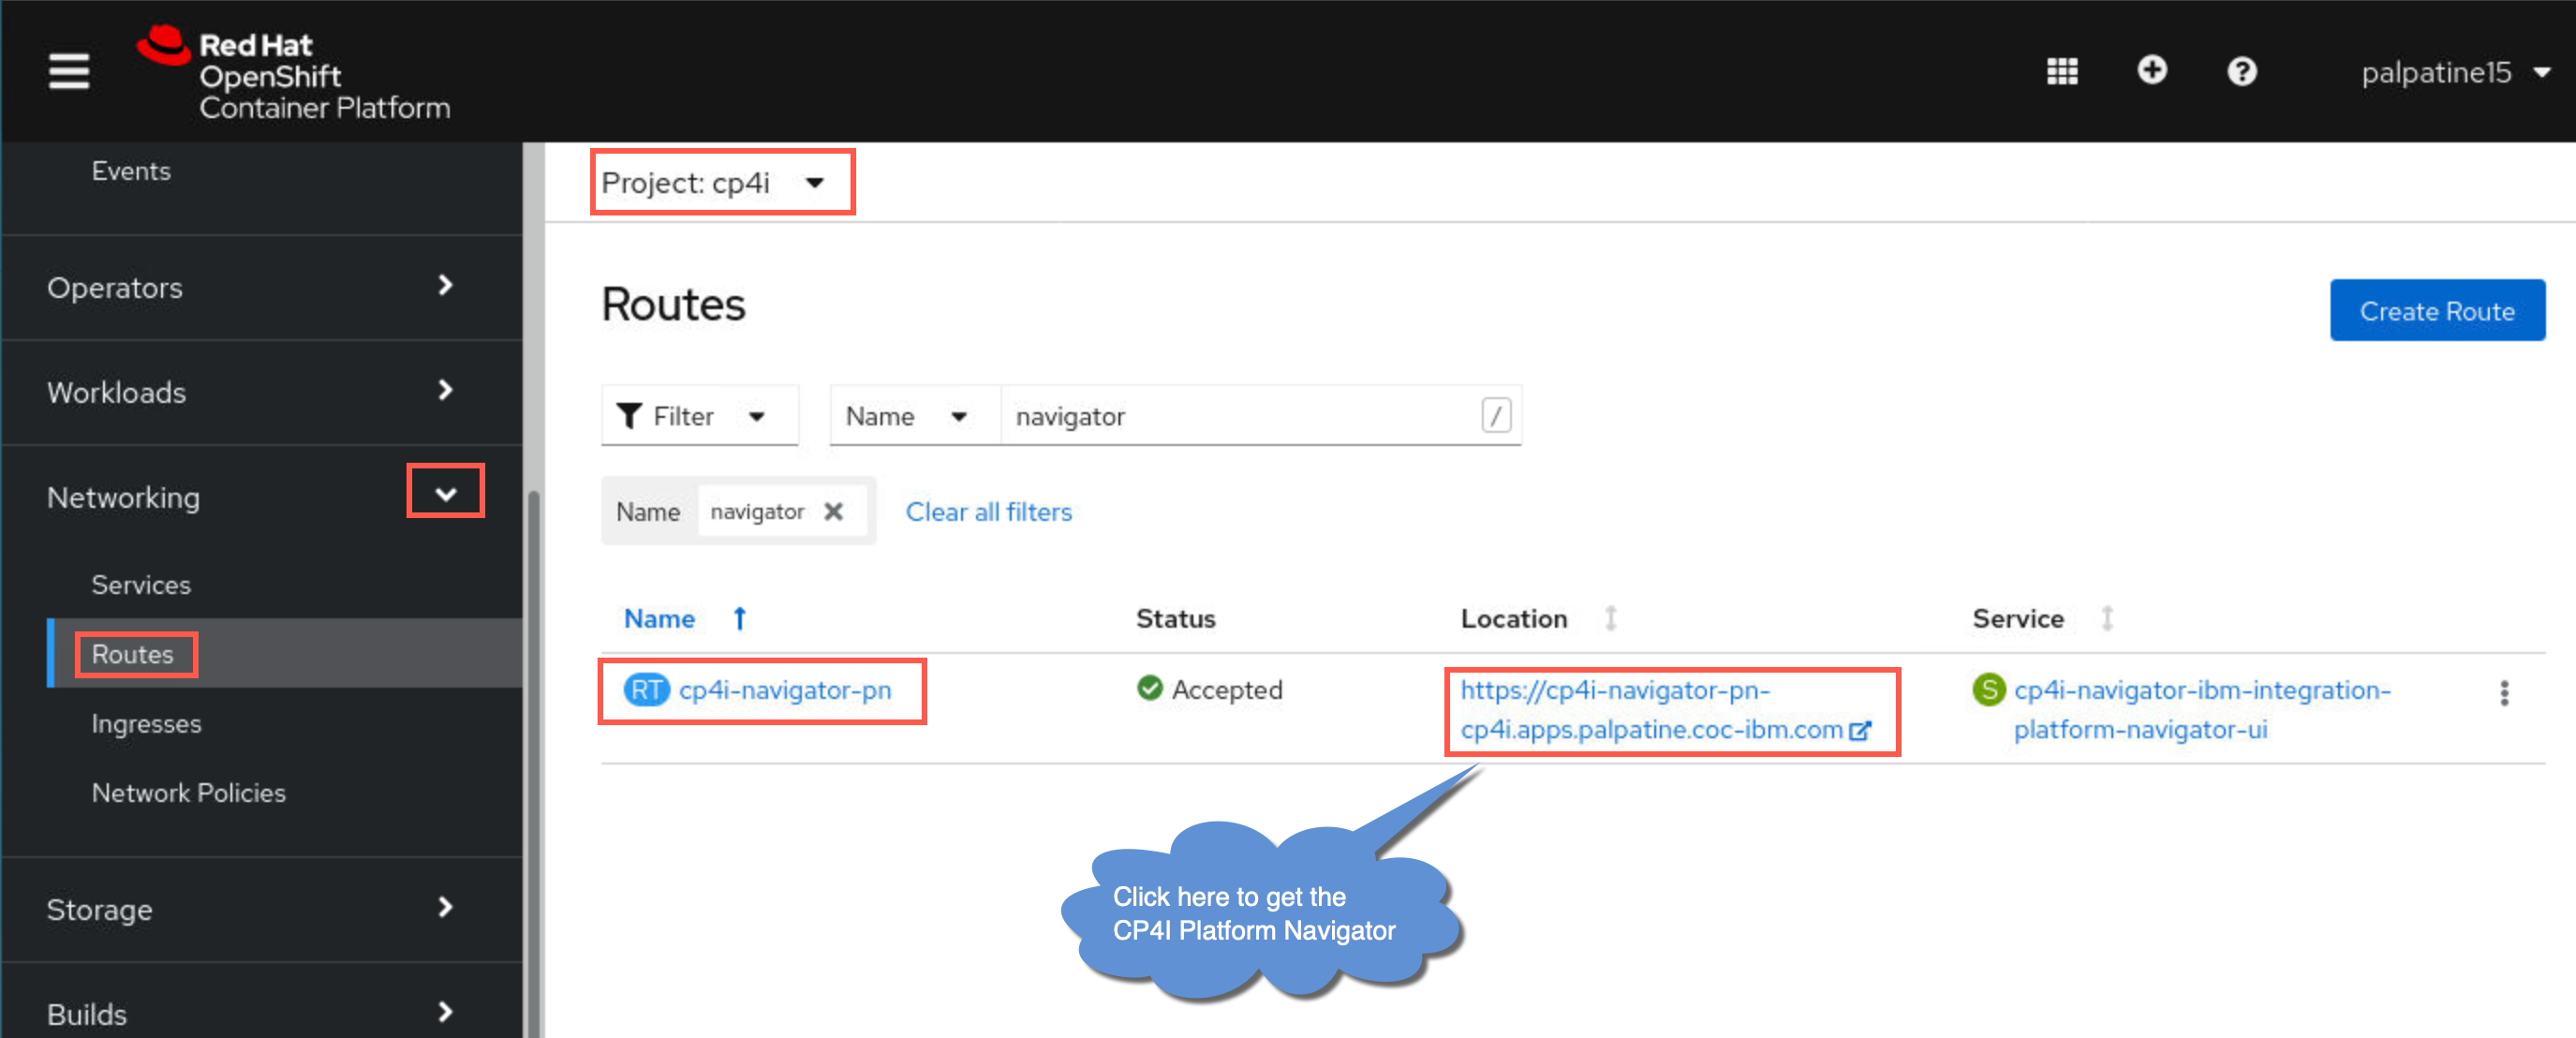
Scroll down again to find Networking on the left side bar menu. Click the drop-down for Networking and select Routes. Type navigator in the Filter field. Click the URL hyperlink for the cp4i-navigator-pn route.
-
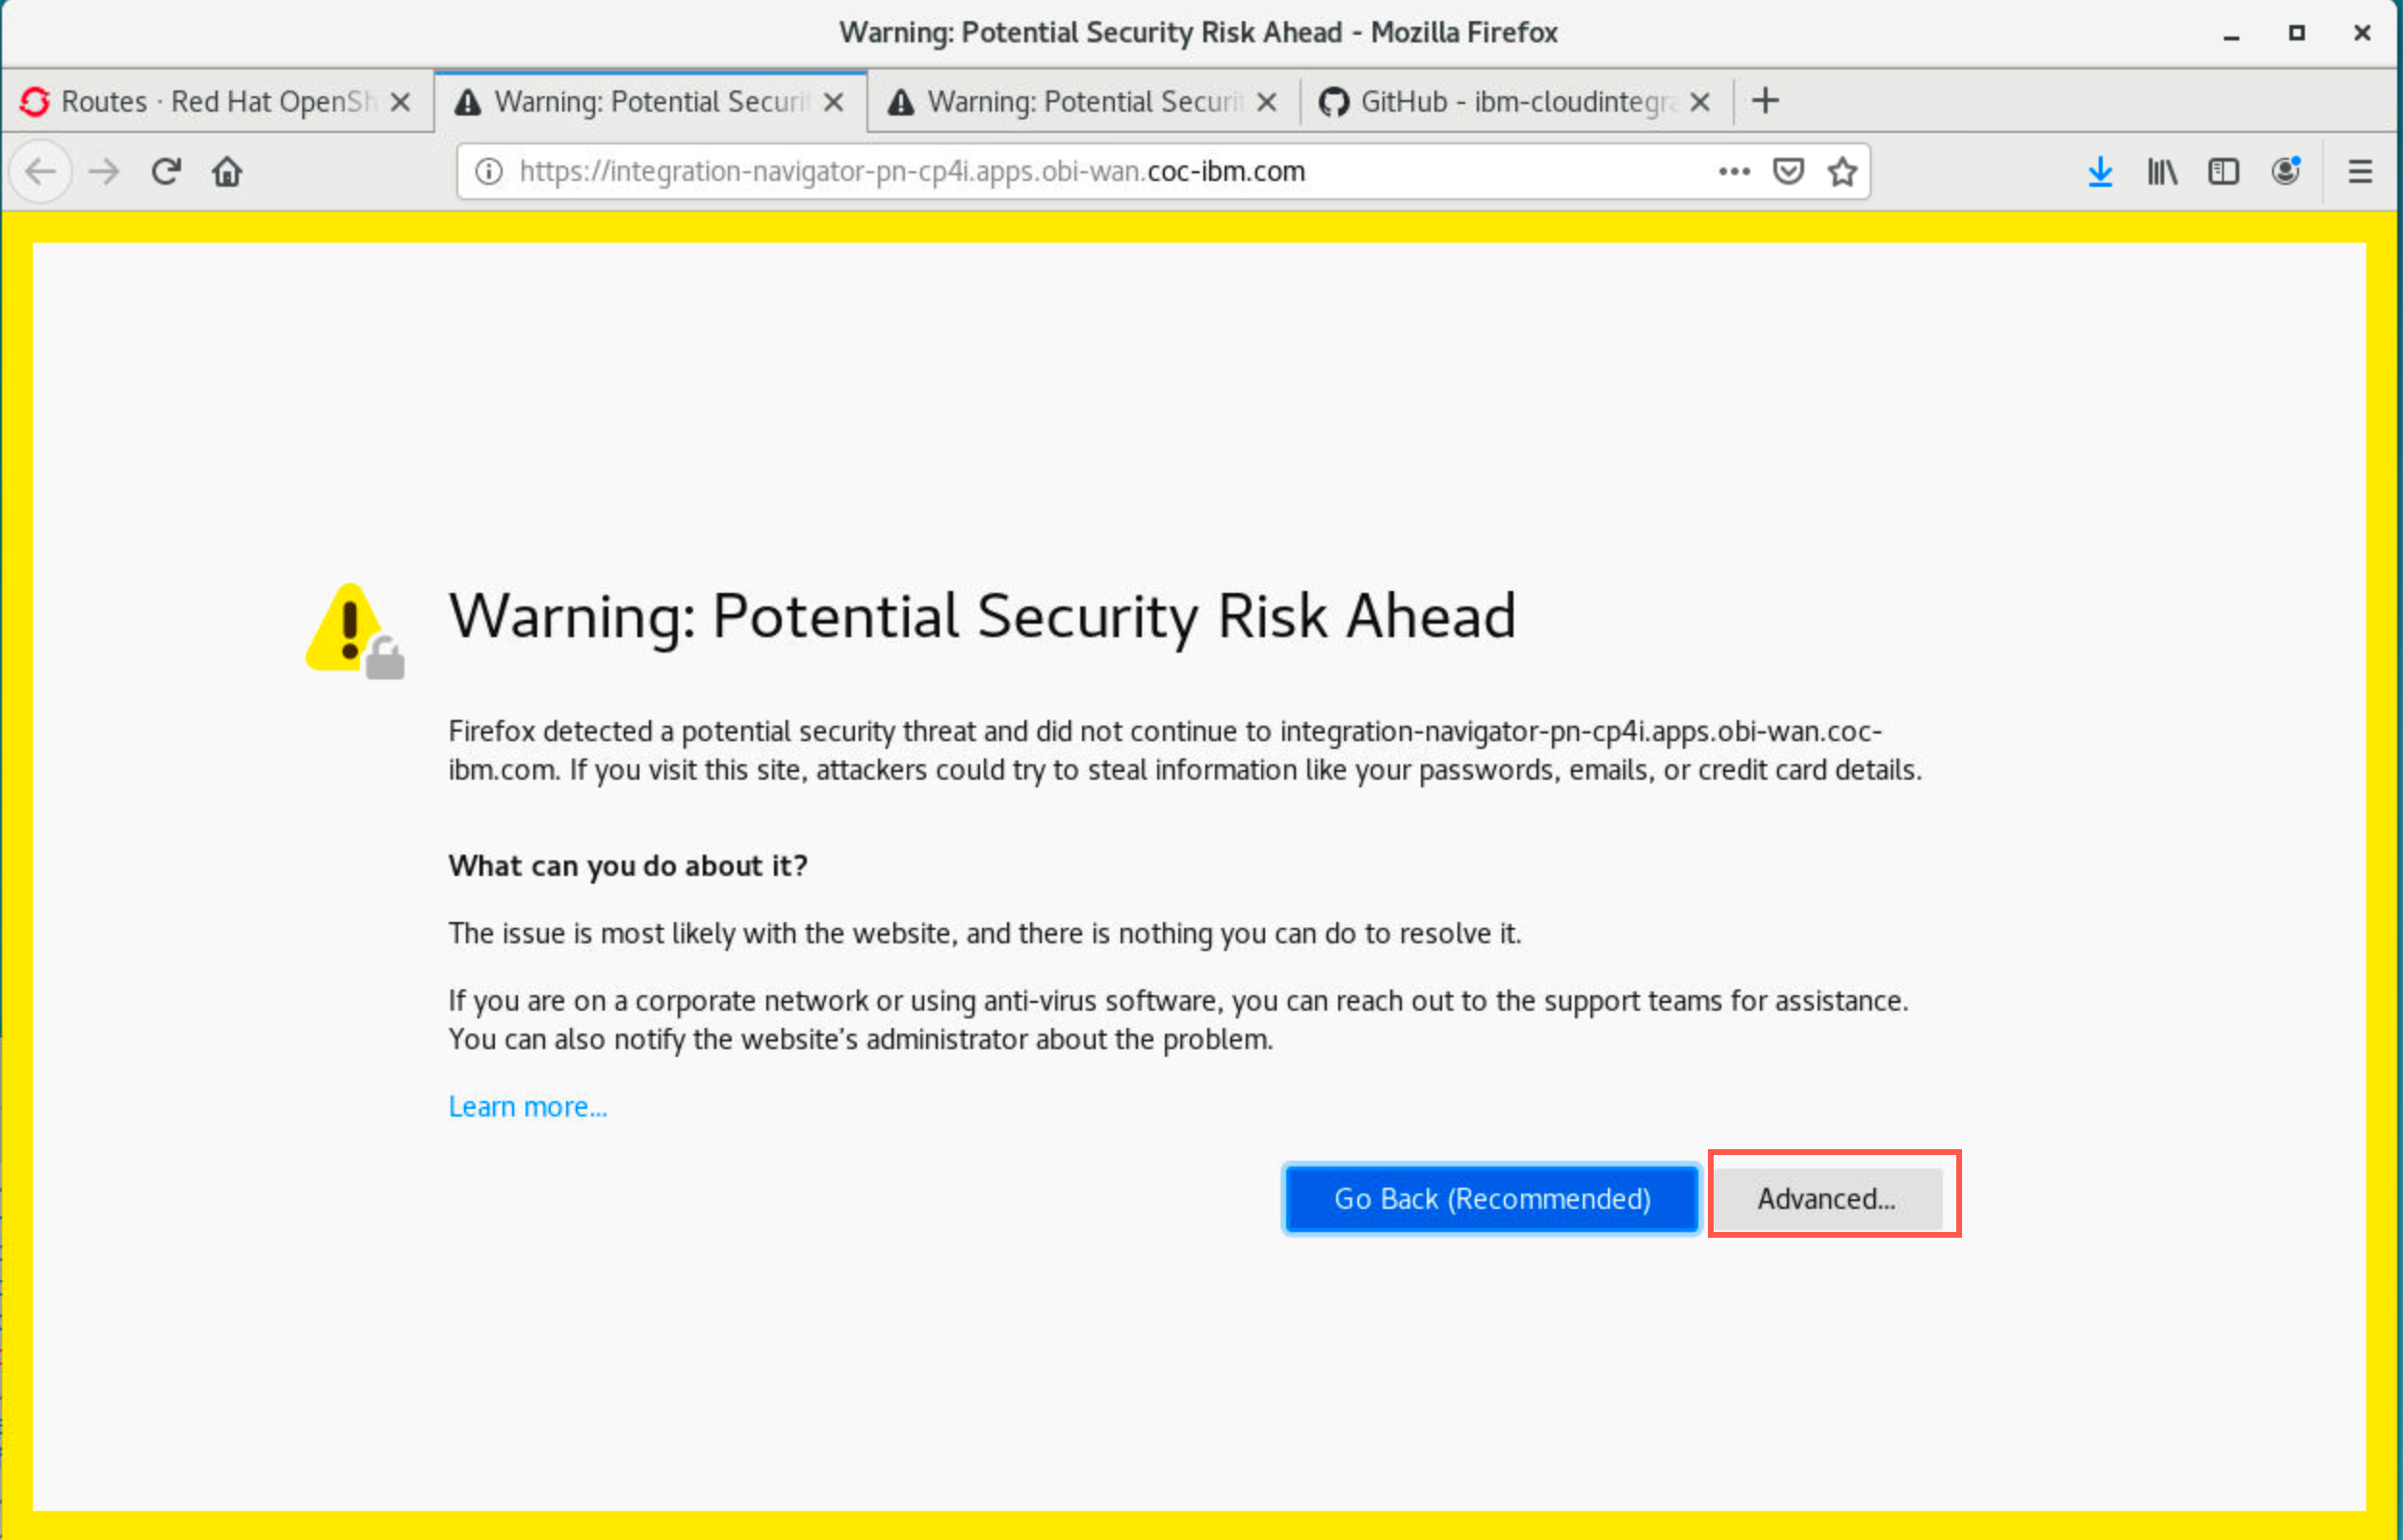
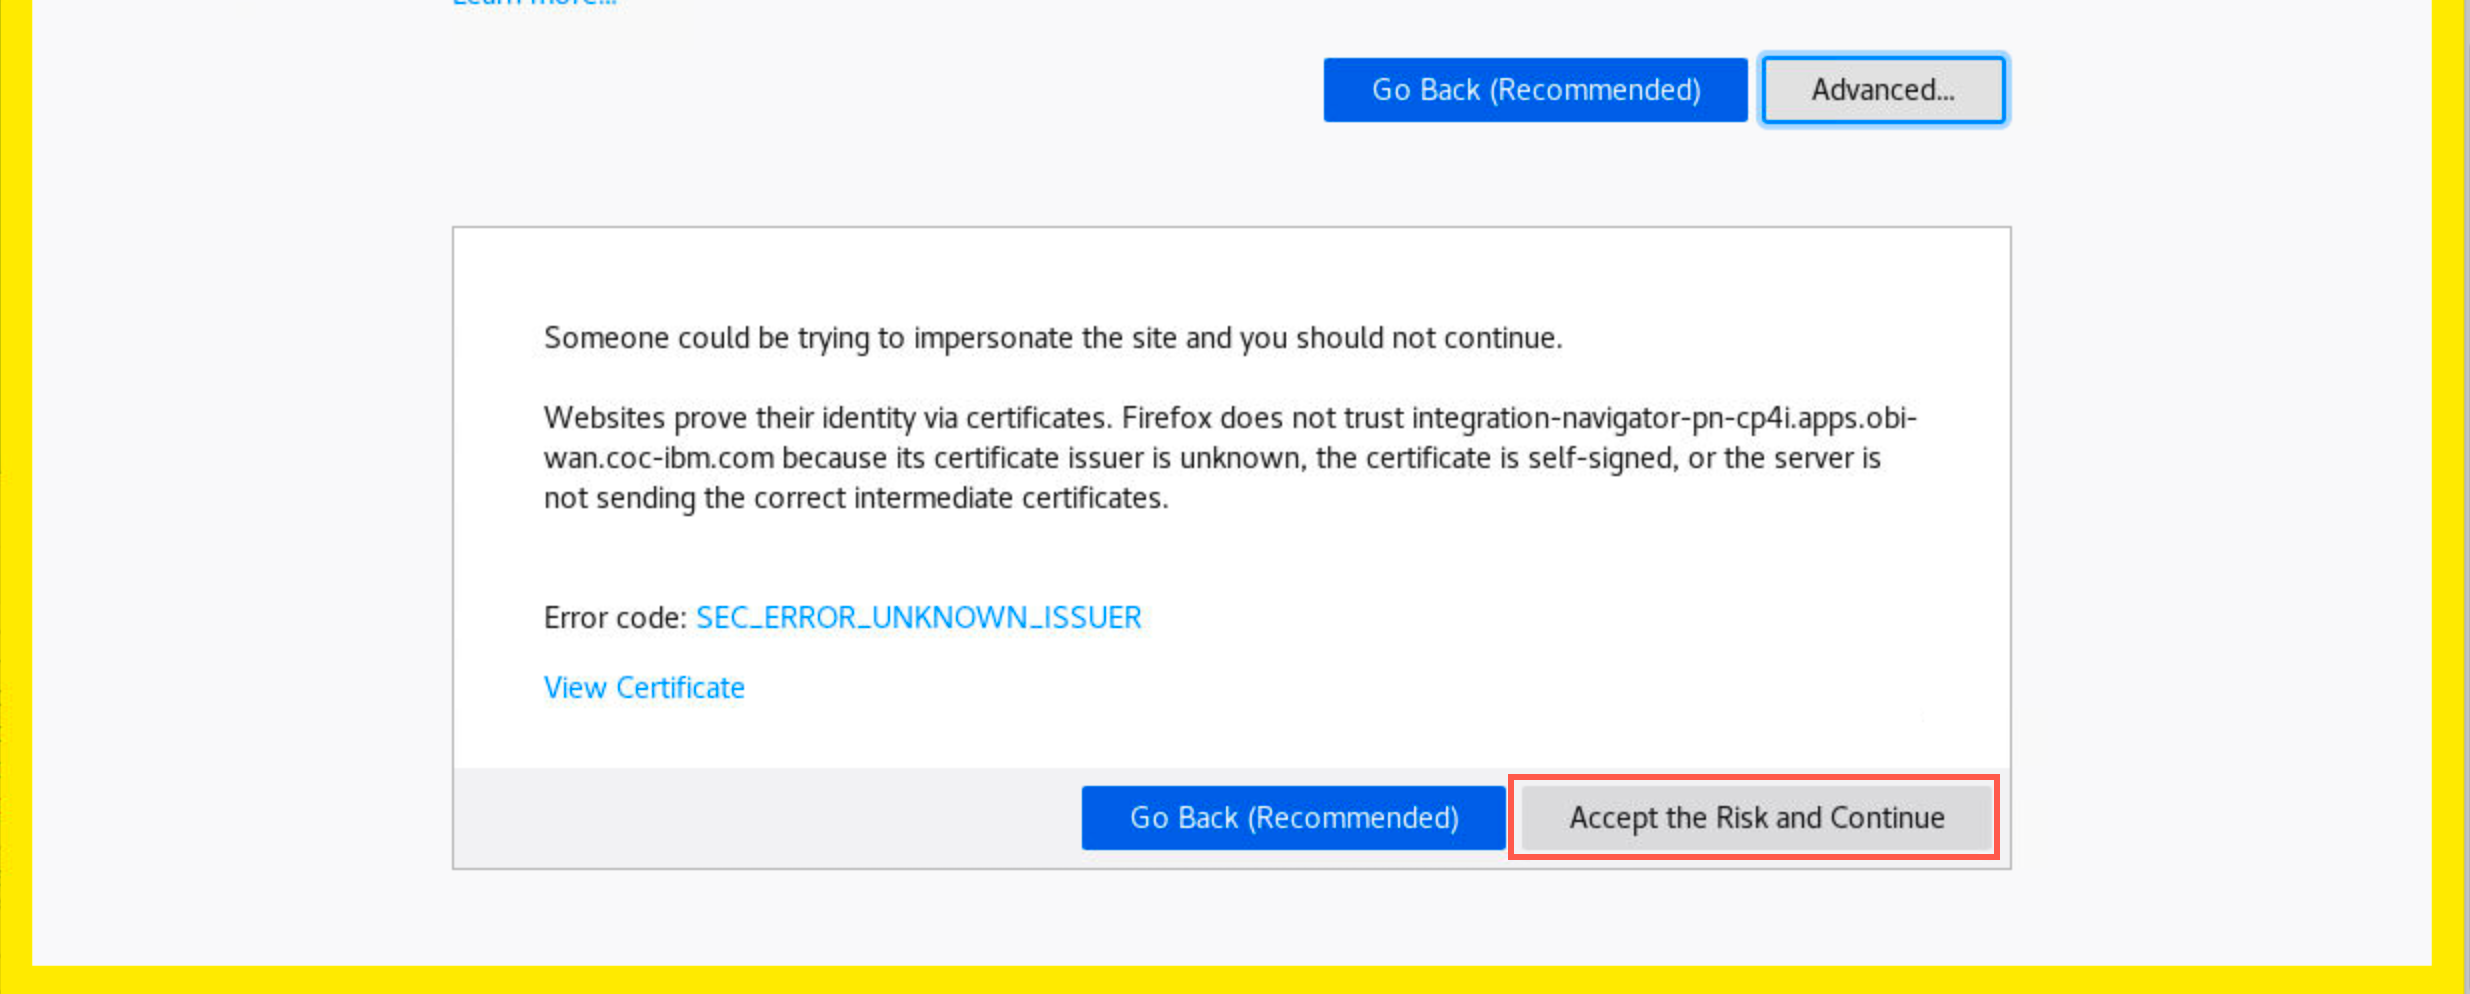
When prompted with the potential security risk, click Advanced.
-
Scroll down and click the Accept the Risk and Continue button.
-
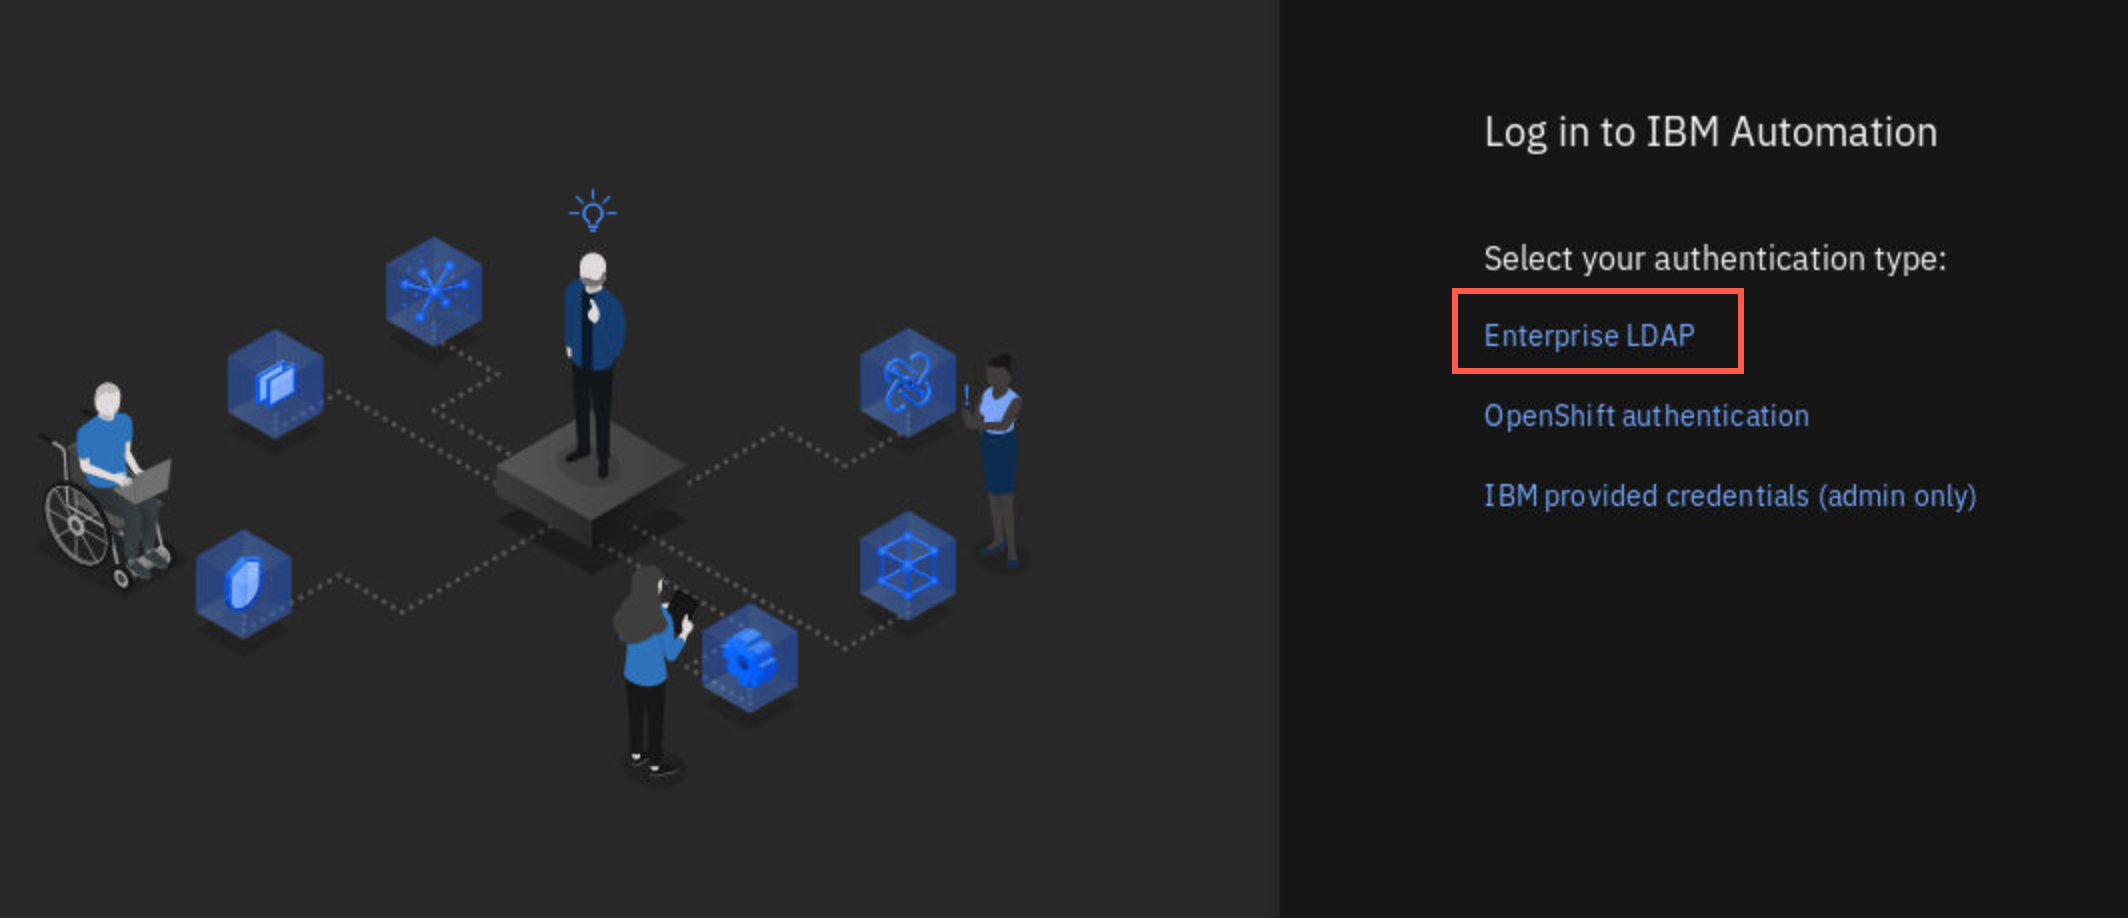
If prompted again, respond as you did above. Finally you are routed to the IBM Automation log in page. Click the Enterprise LDAP hyperlink.
-
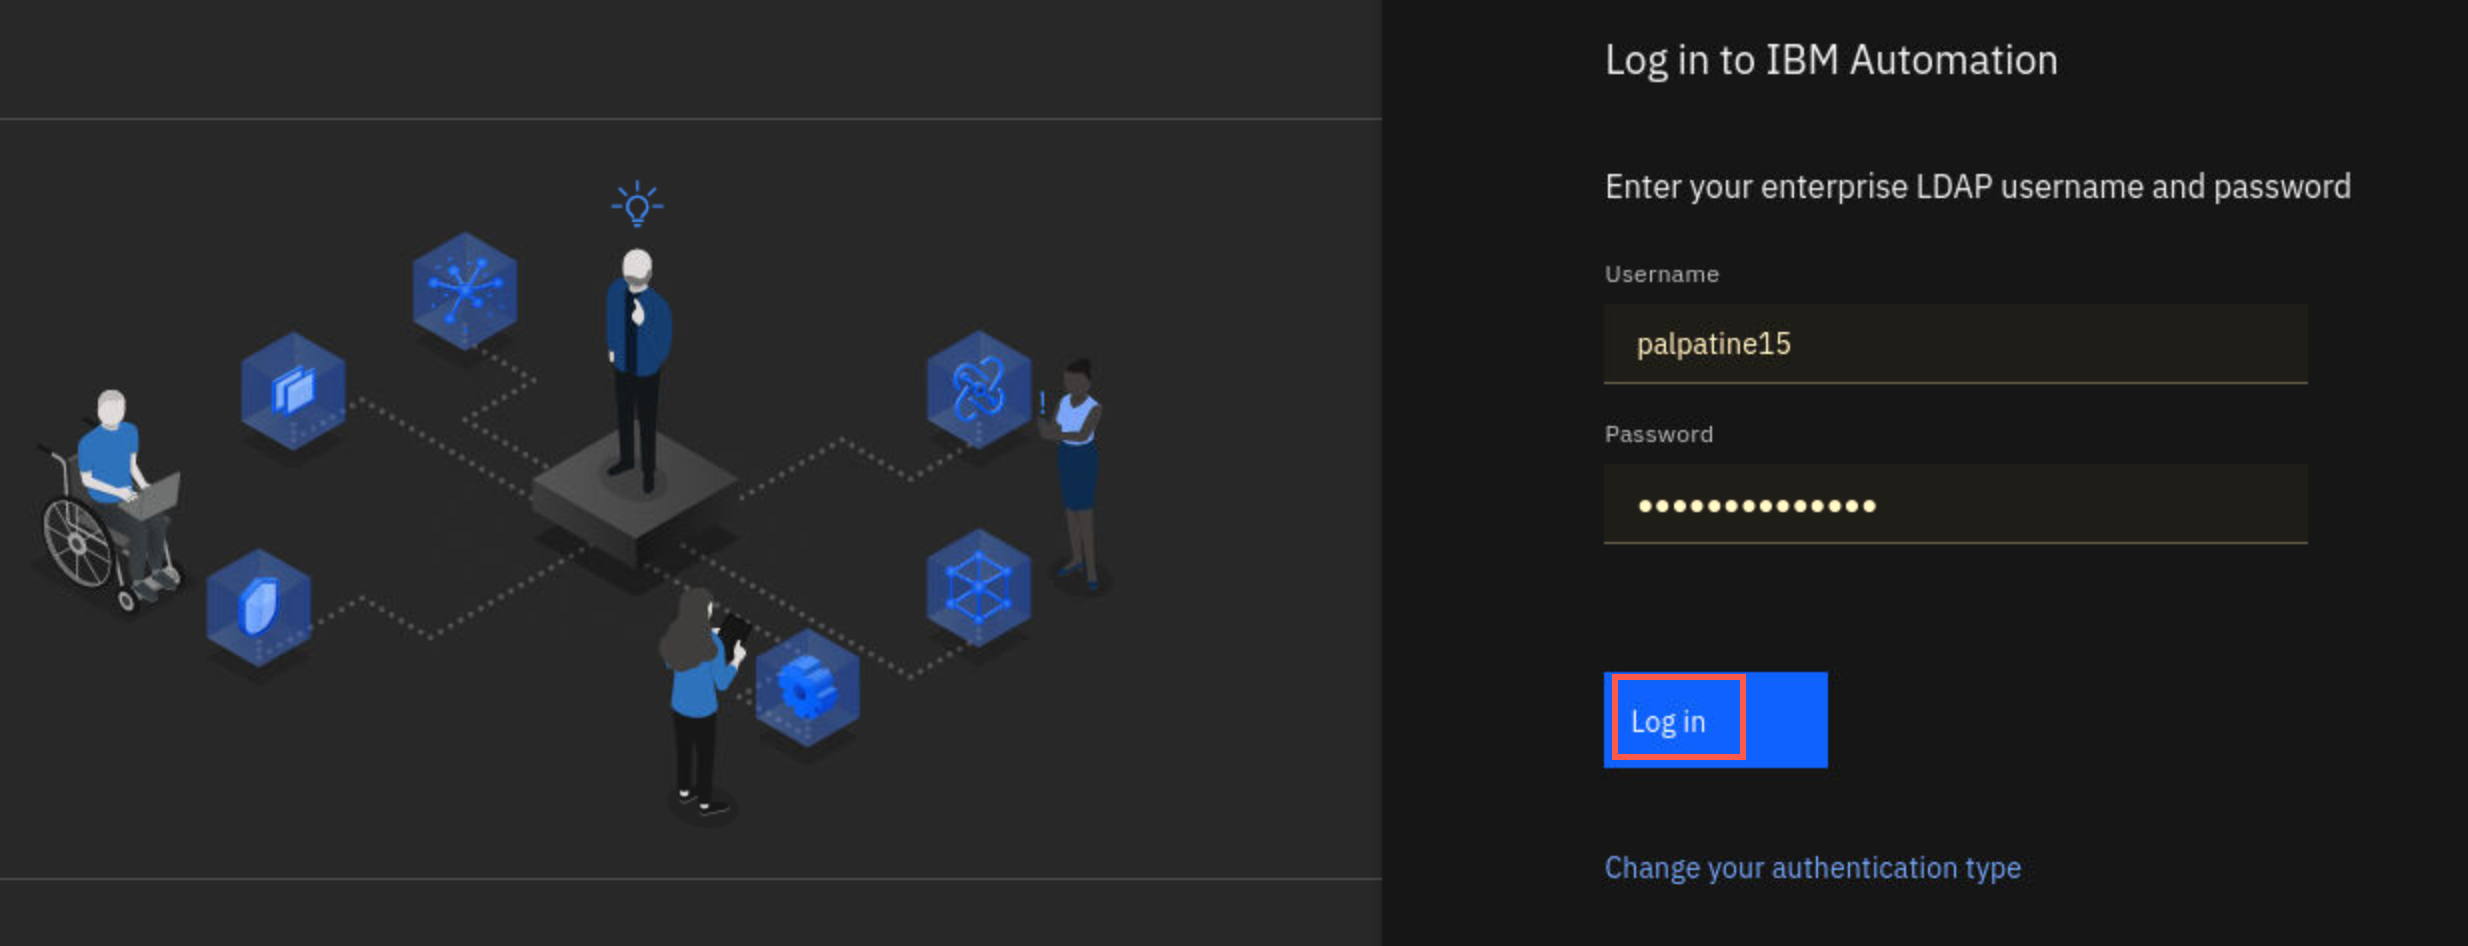
Enter the user name and password that was provided in your email to log on.
-
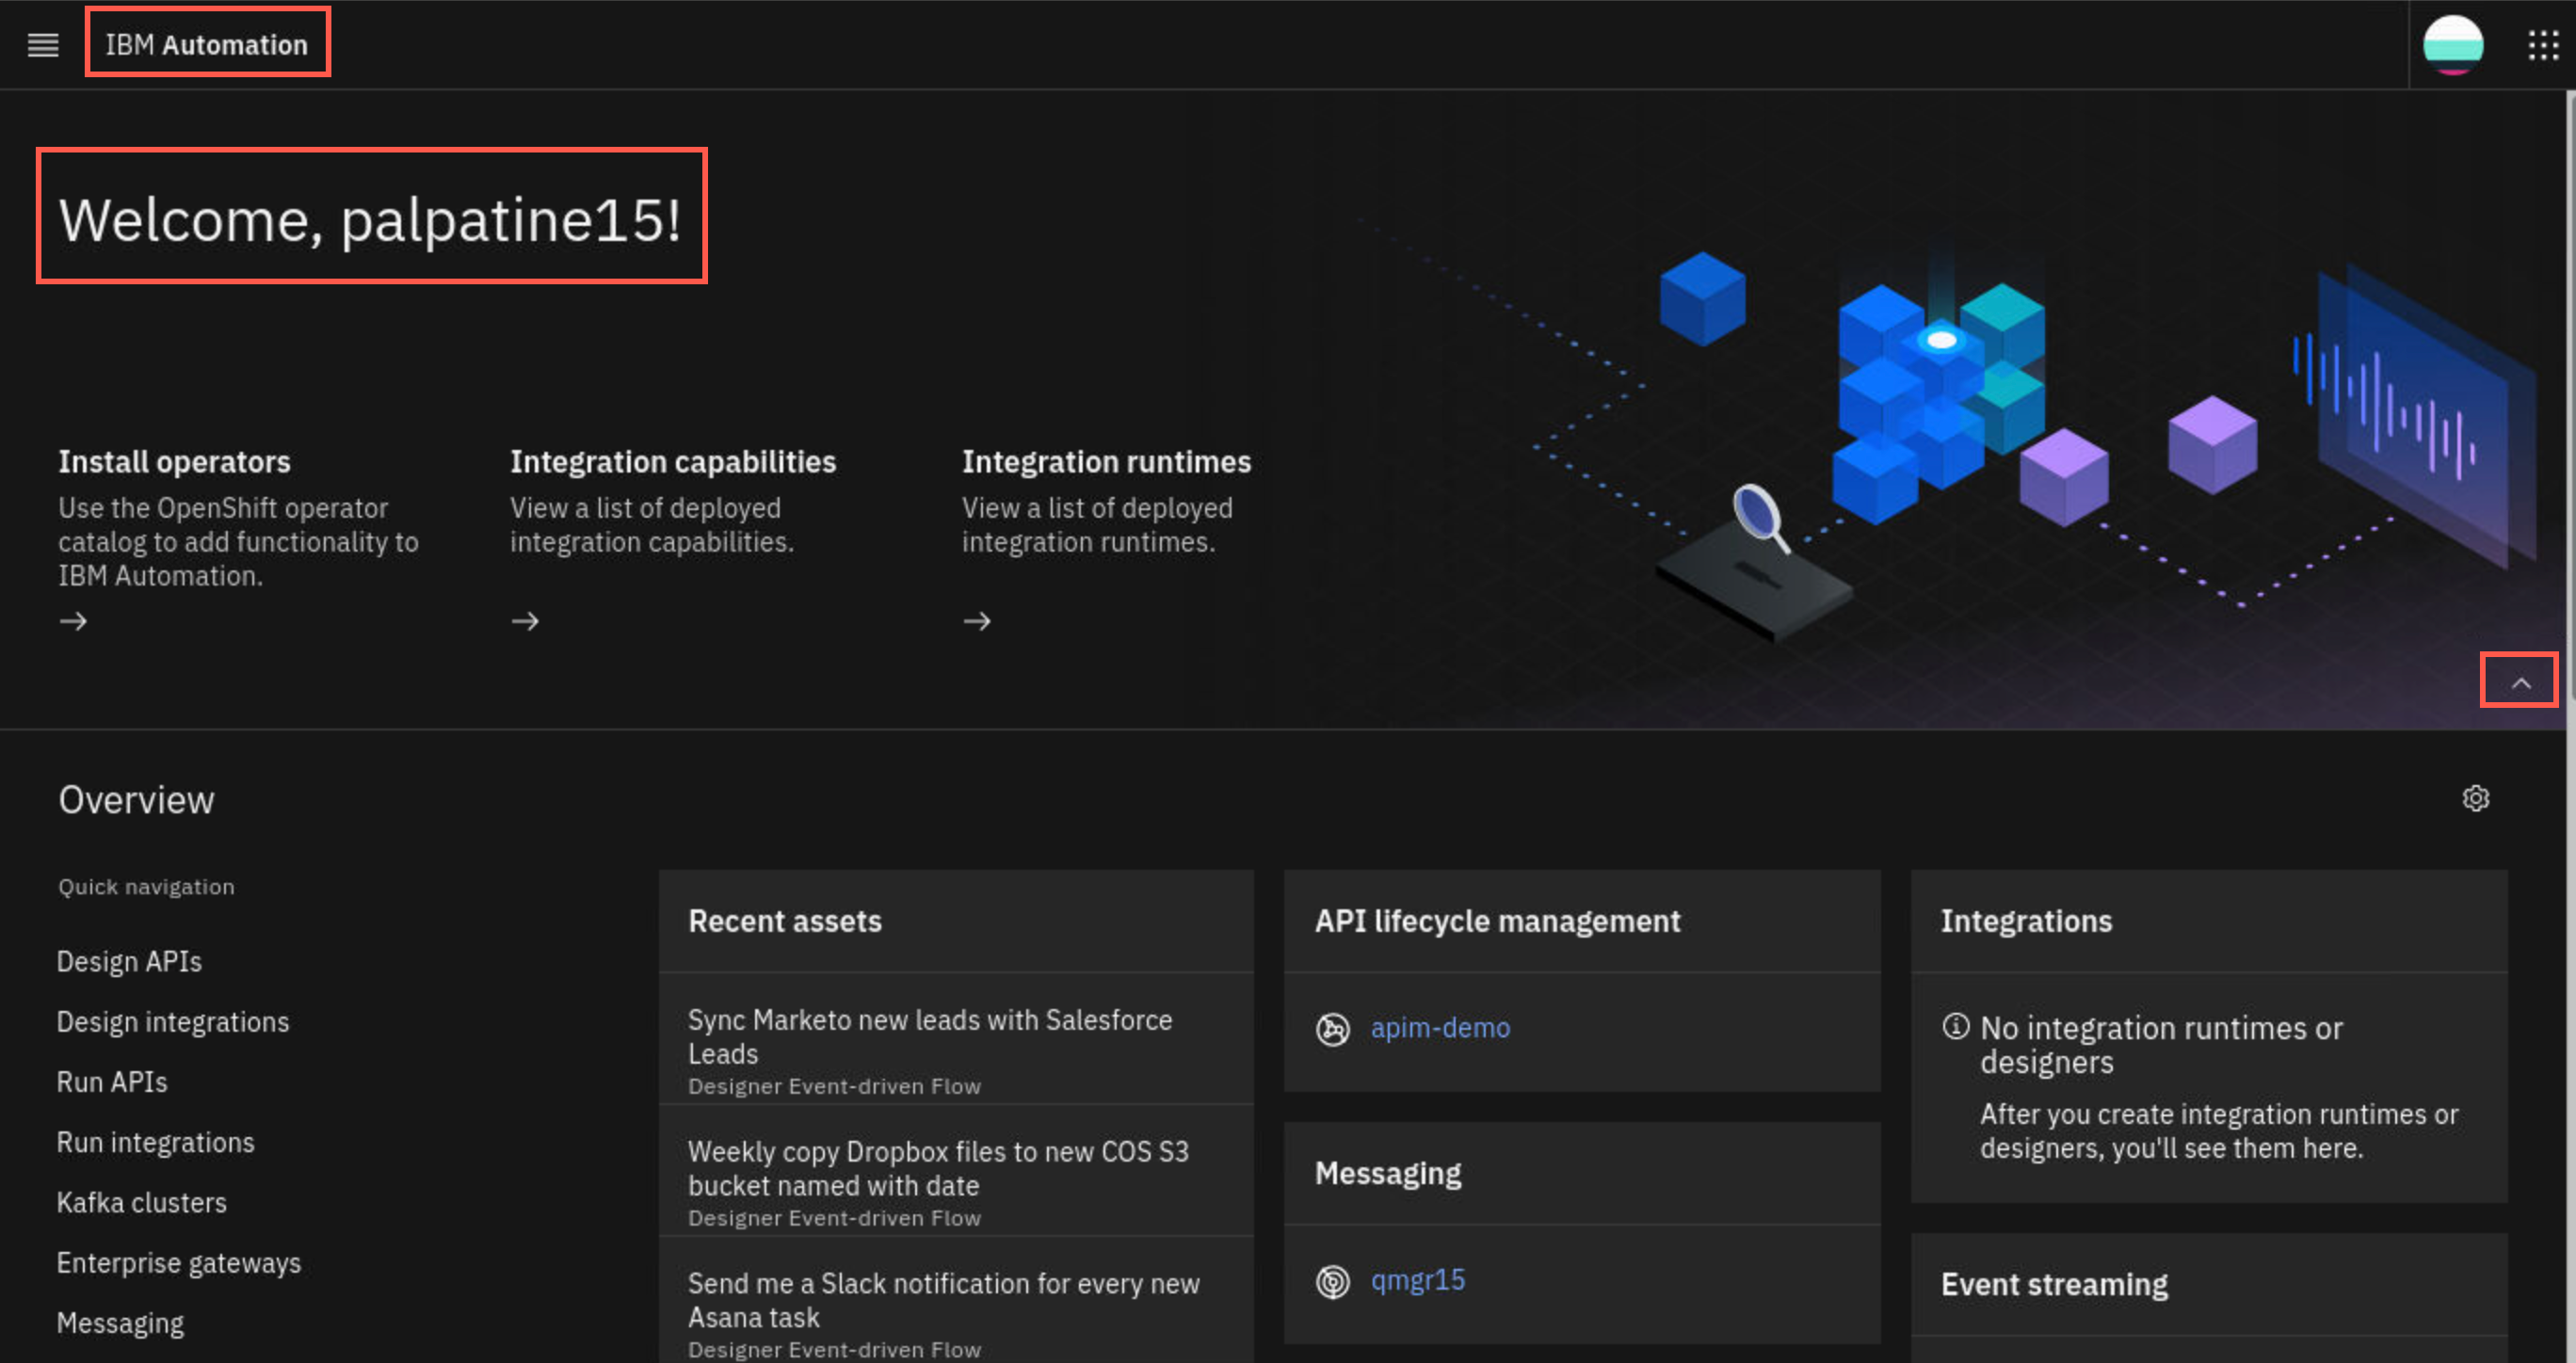
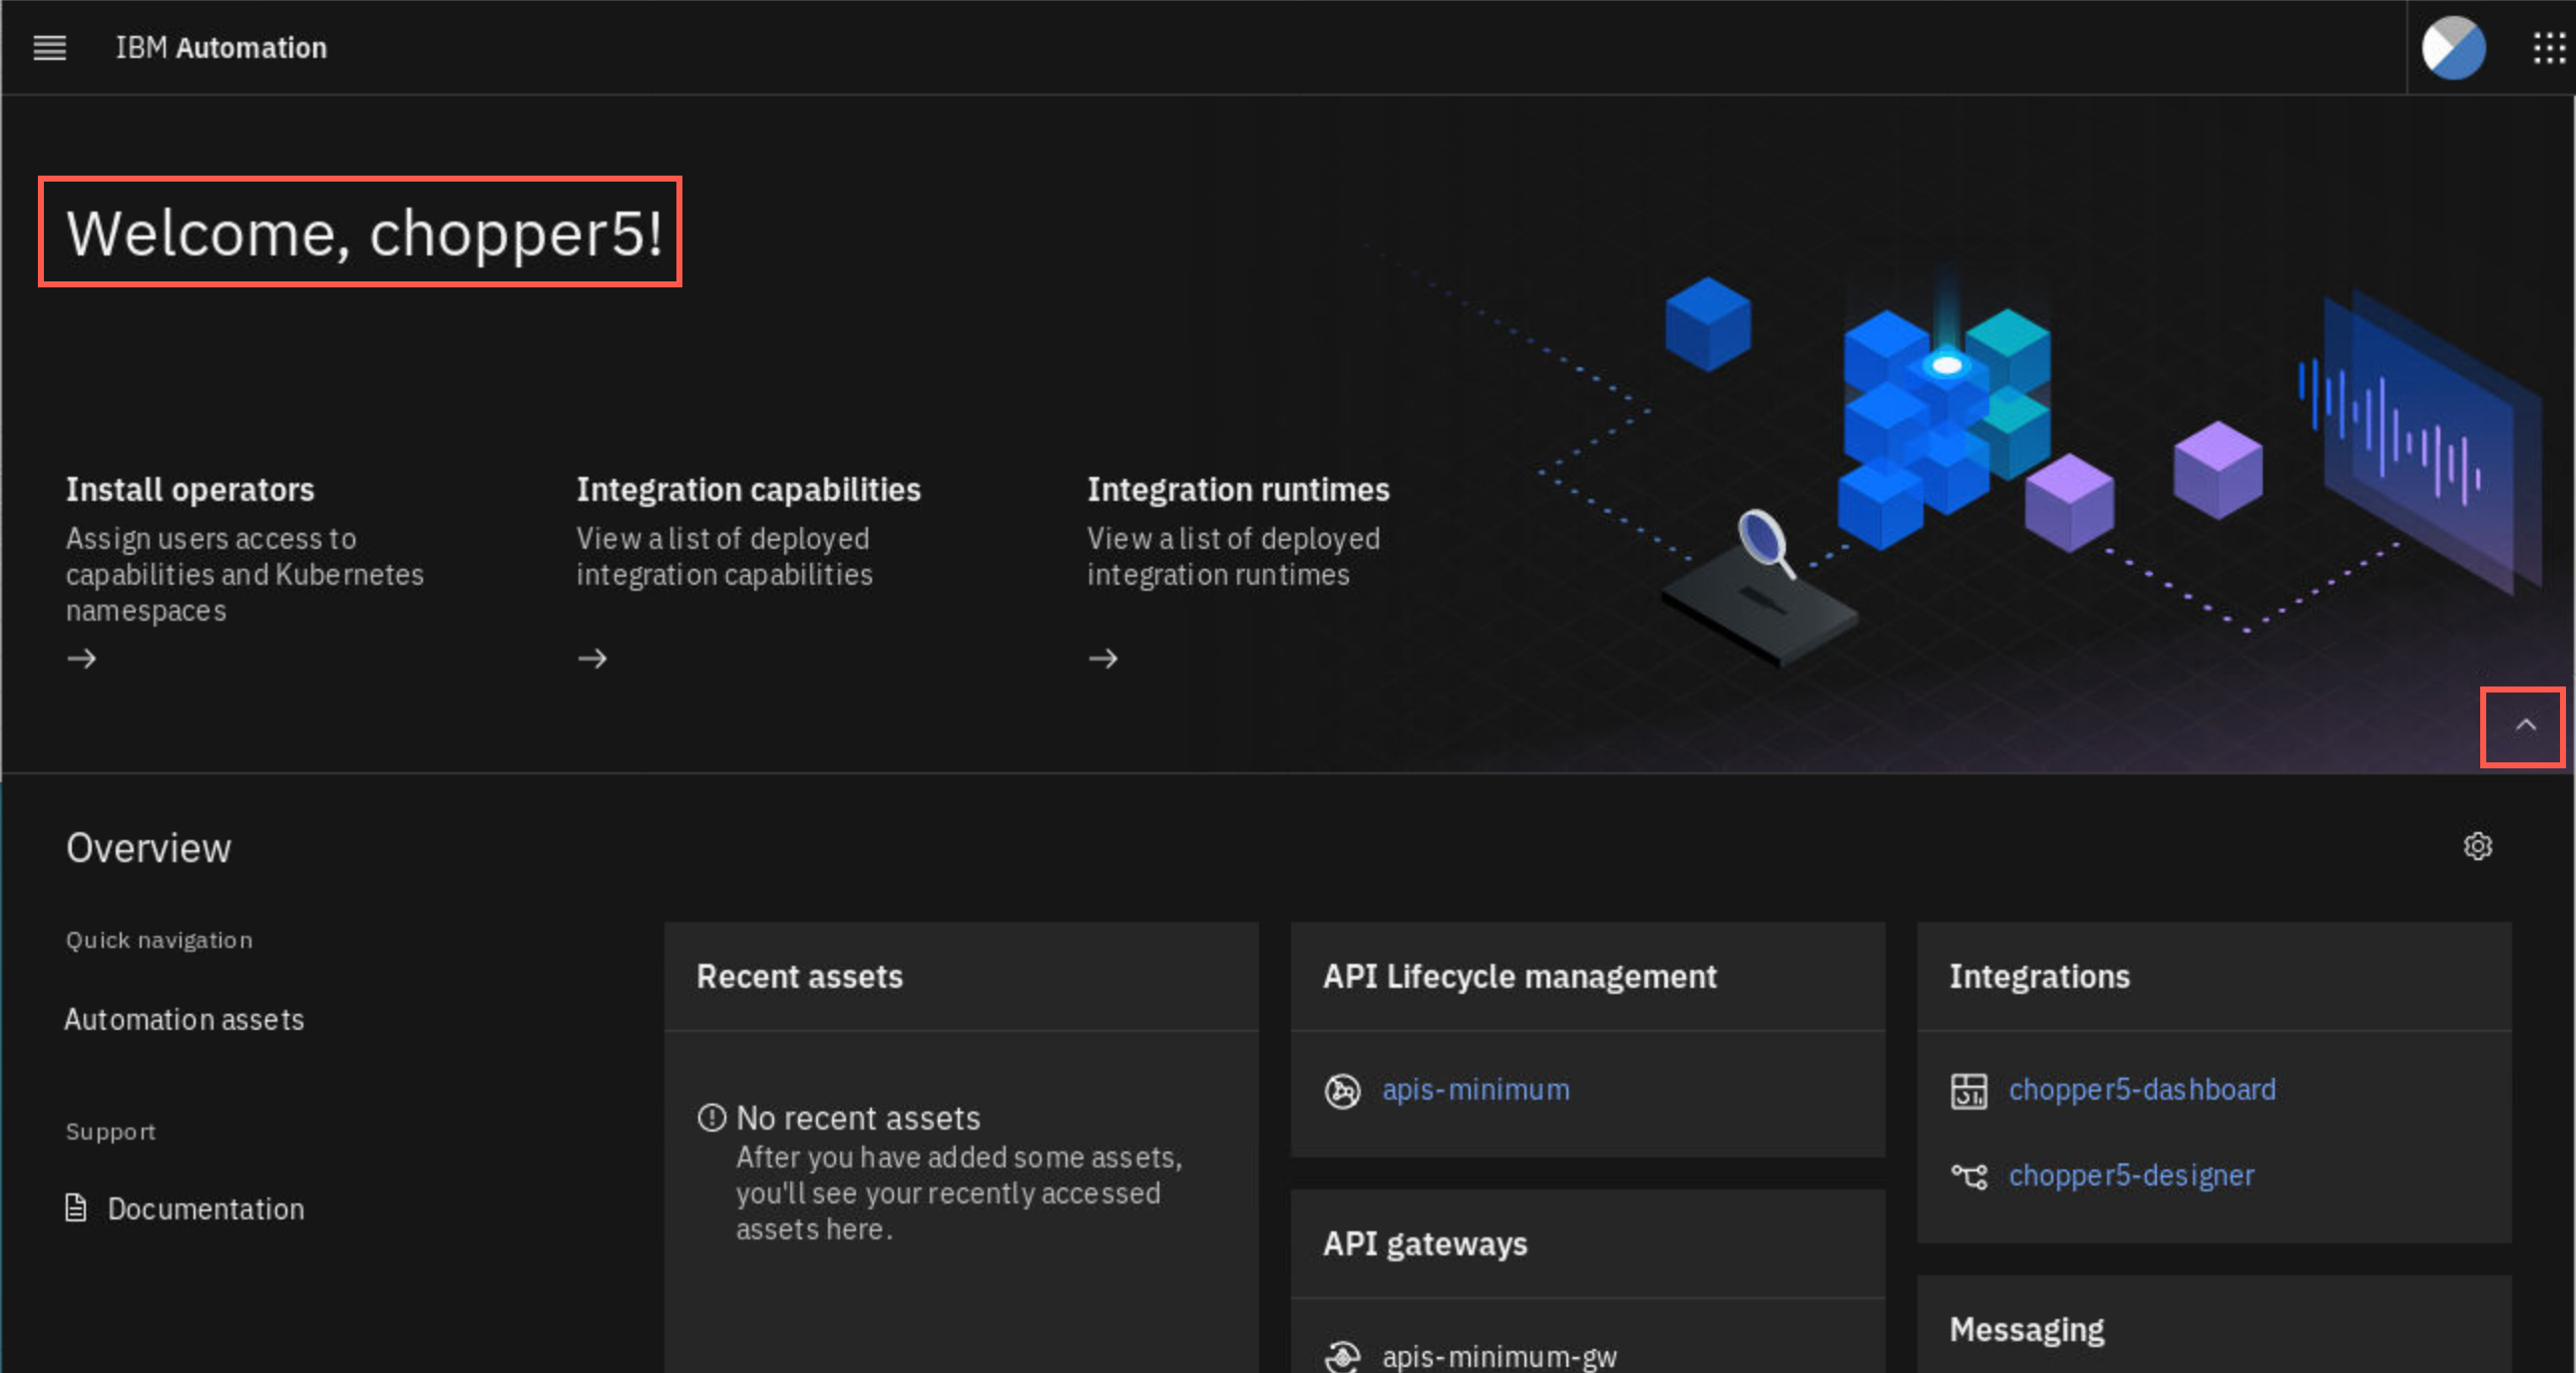
The IBM Automation page appears. This is also referred to as the Integration Platform Navigator. You may click the up arrow on the right side of window to reduce screen space.
-
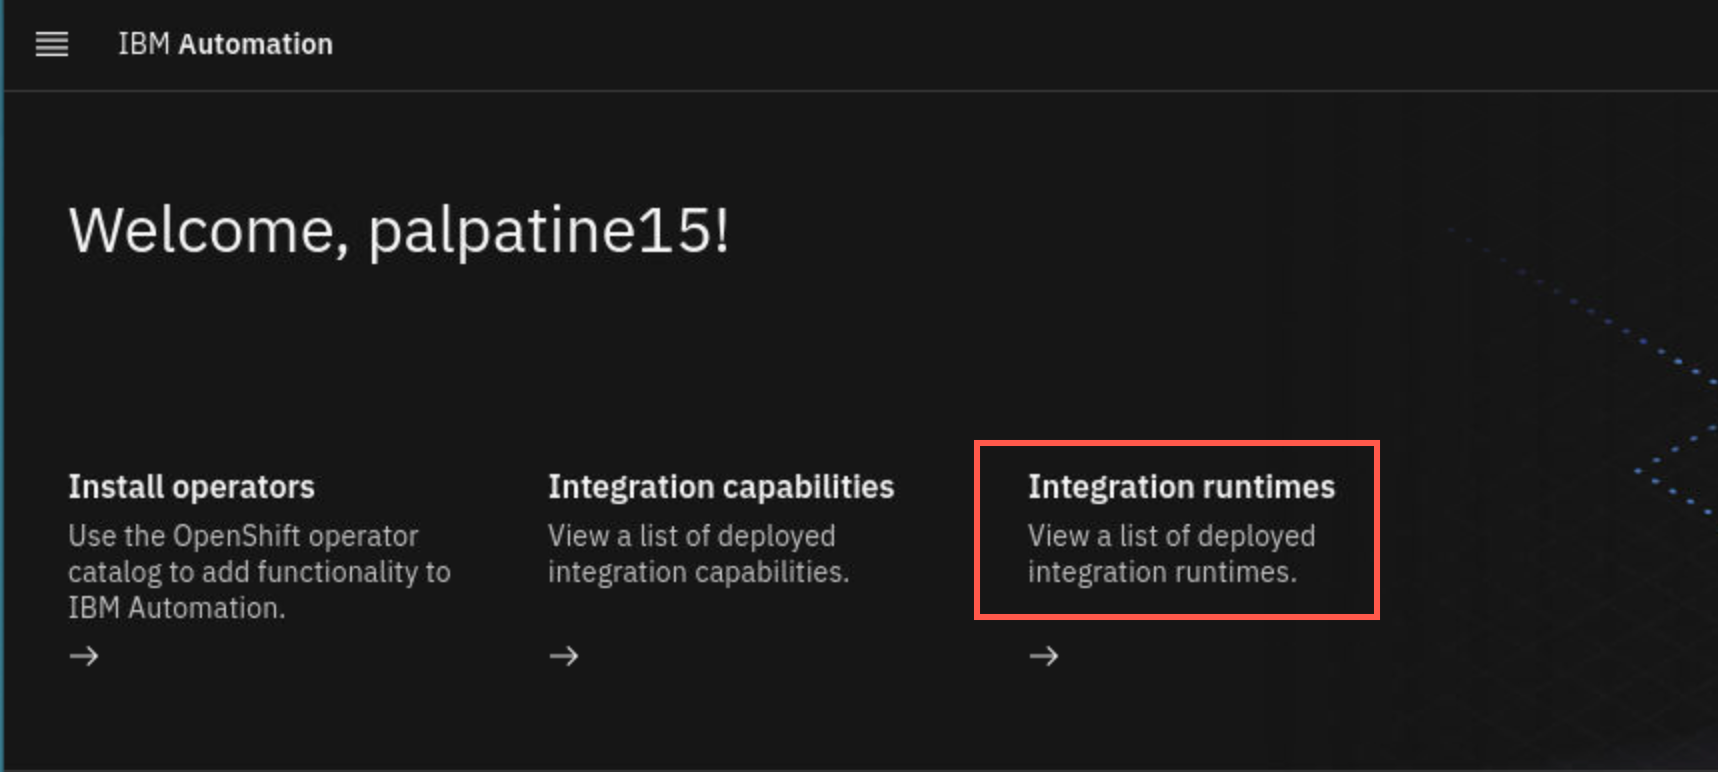
Under your user name, click Integration runtimes.
-
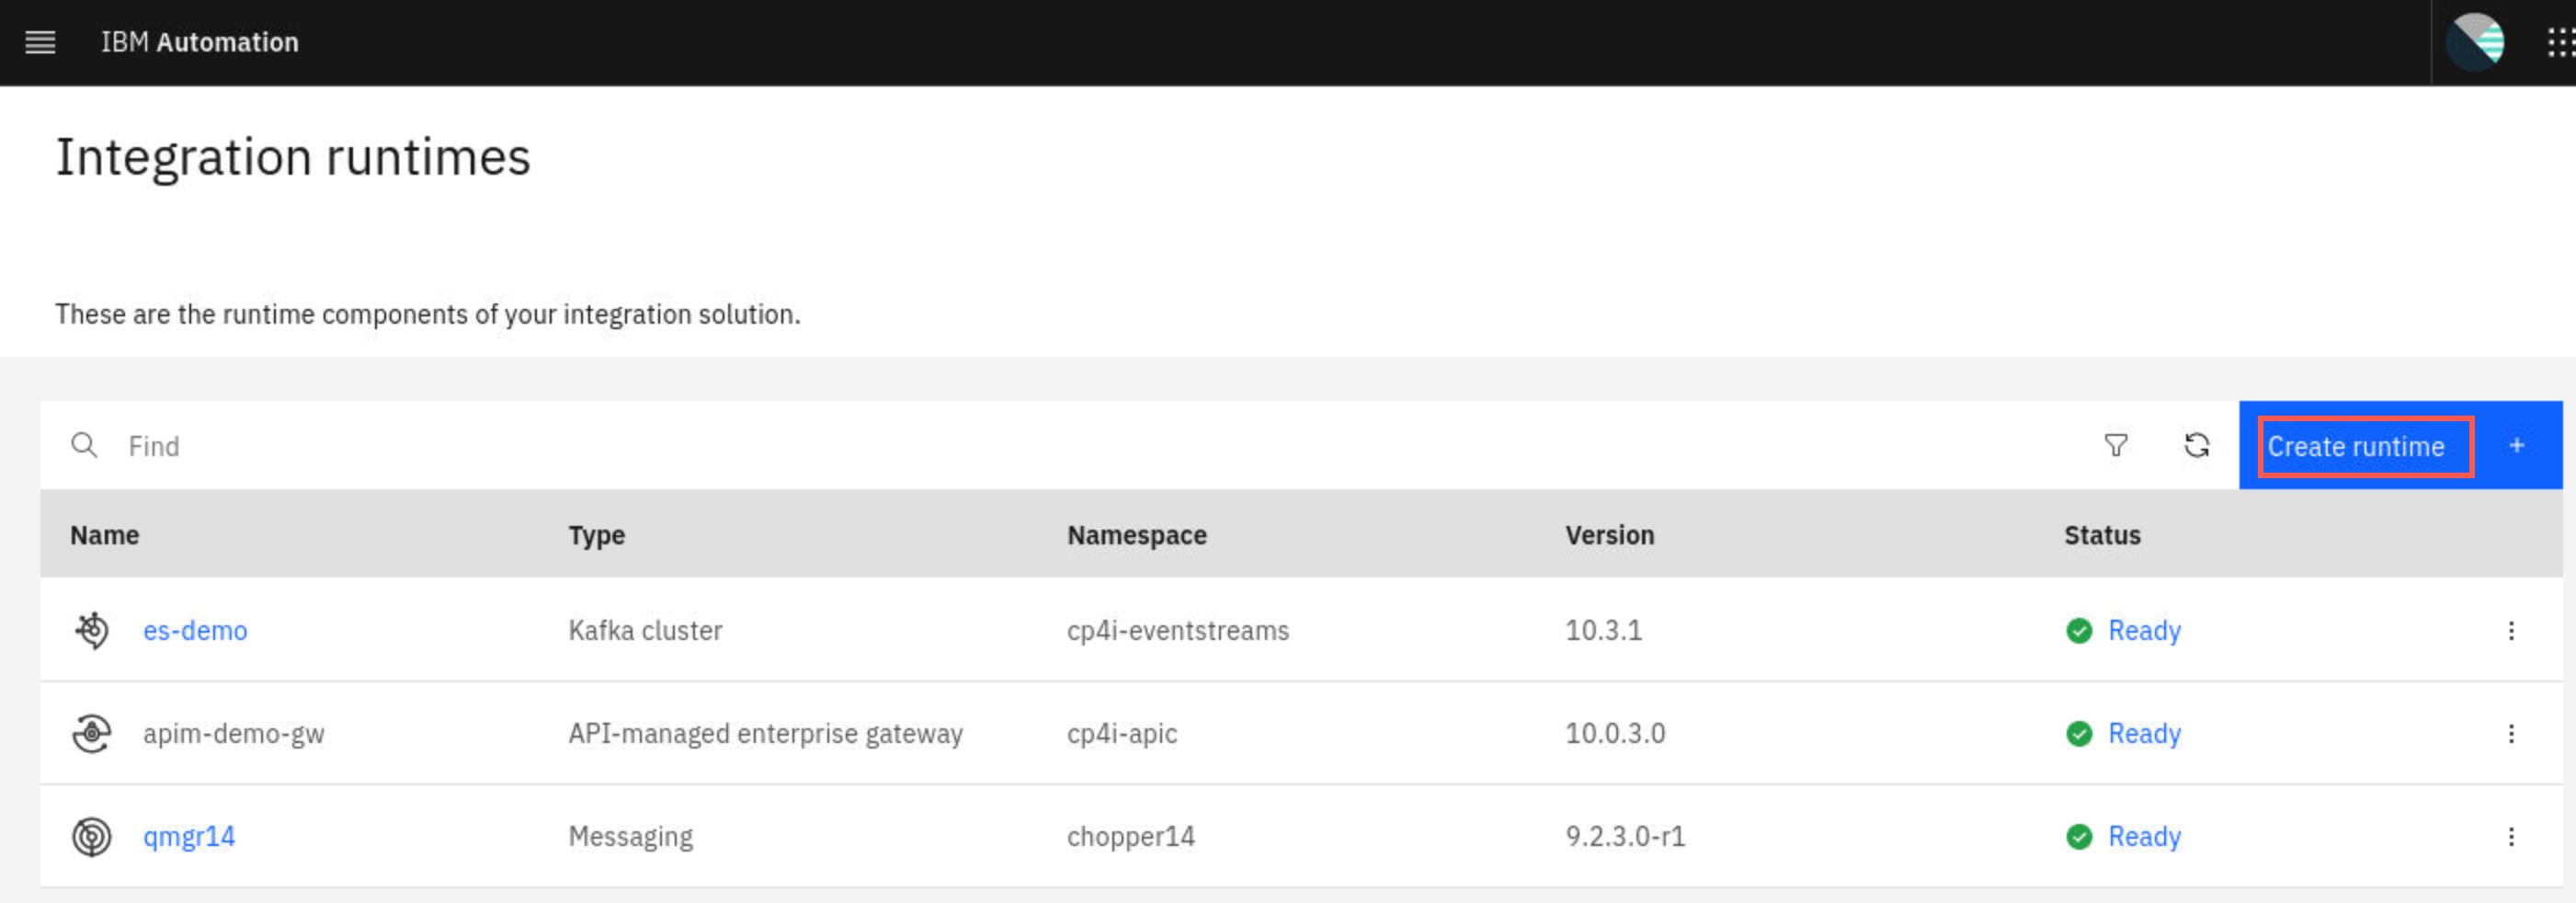
You’ll notice that there are a few runtimes which were created previously. Click Create runtime to display the various runtimes available in CP4I.
-
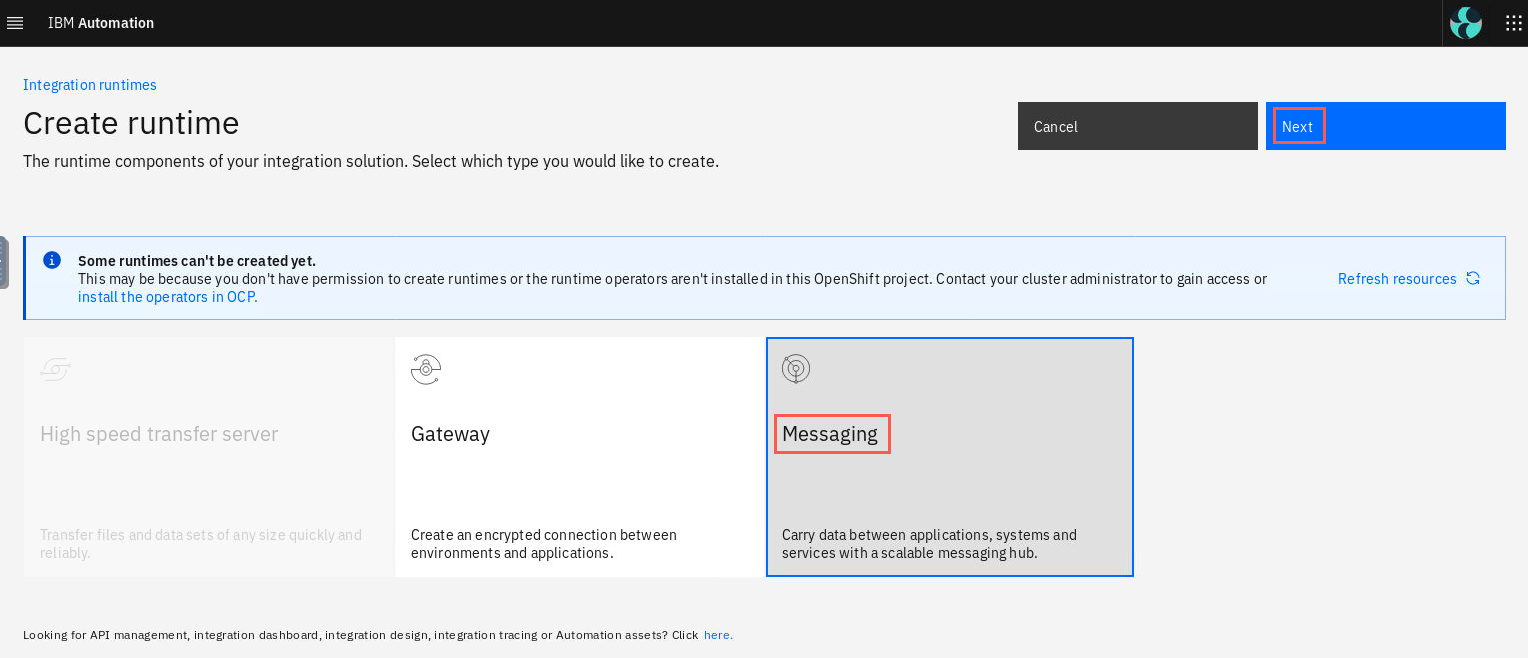
A number of tiles are displayed. Click the Messaging tile, then click Next.
-
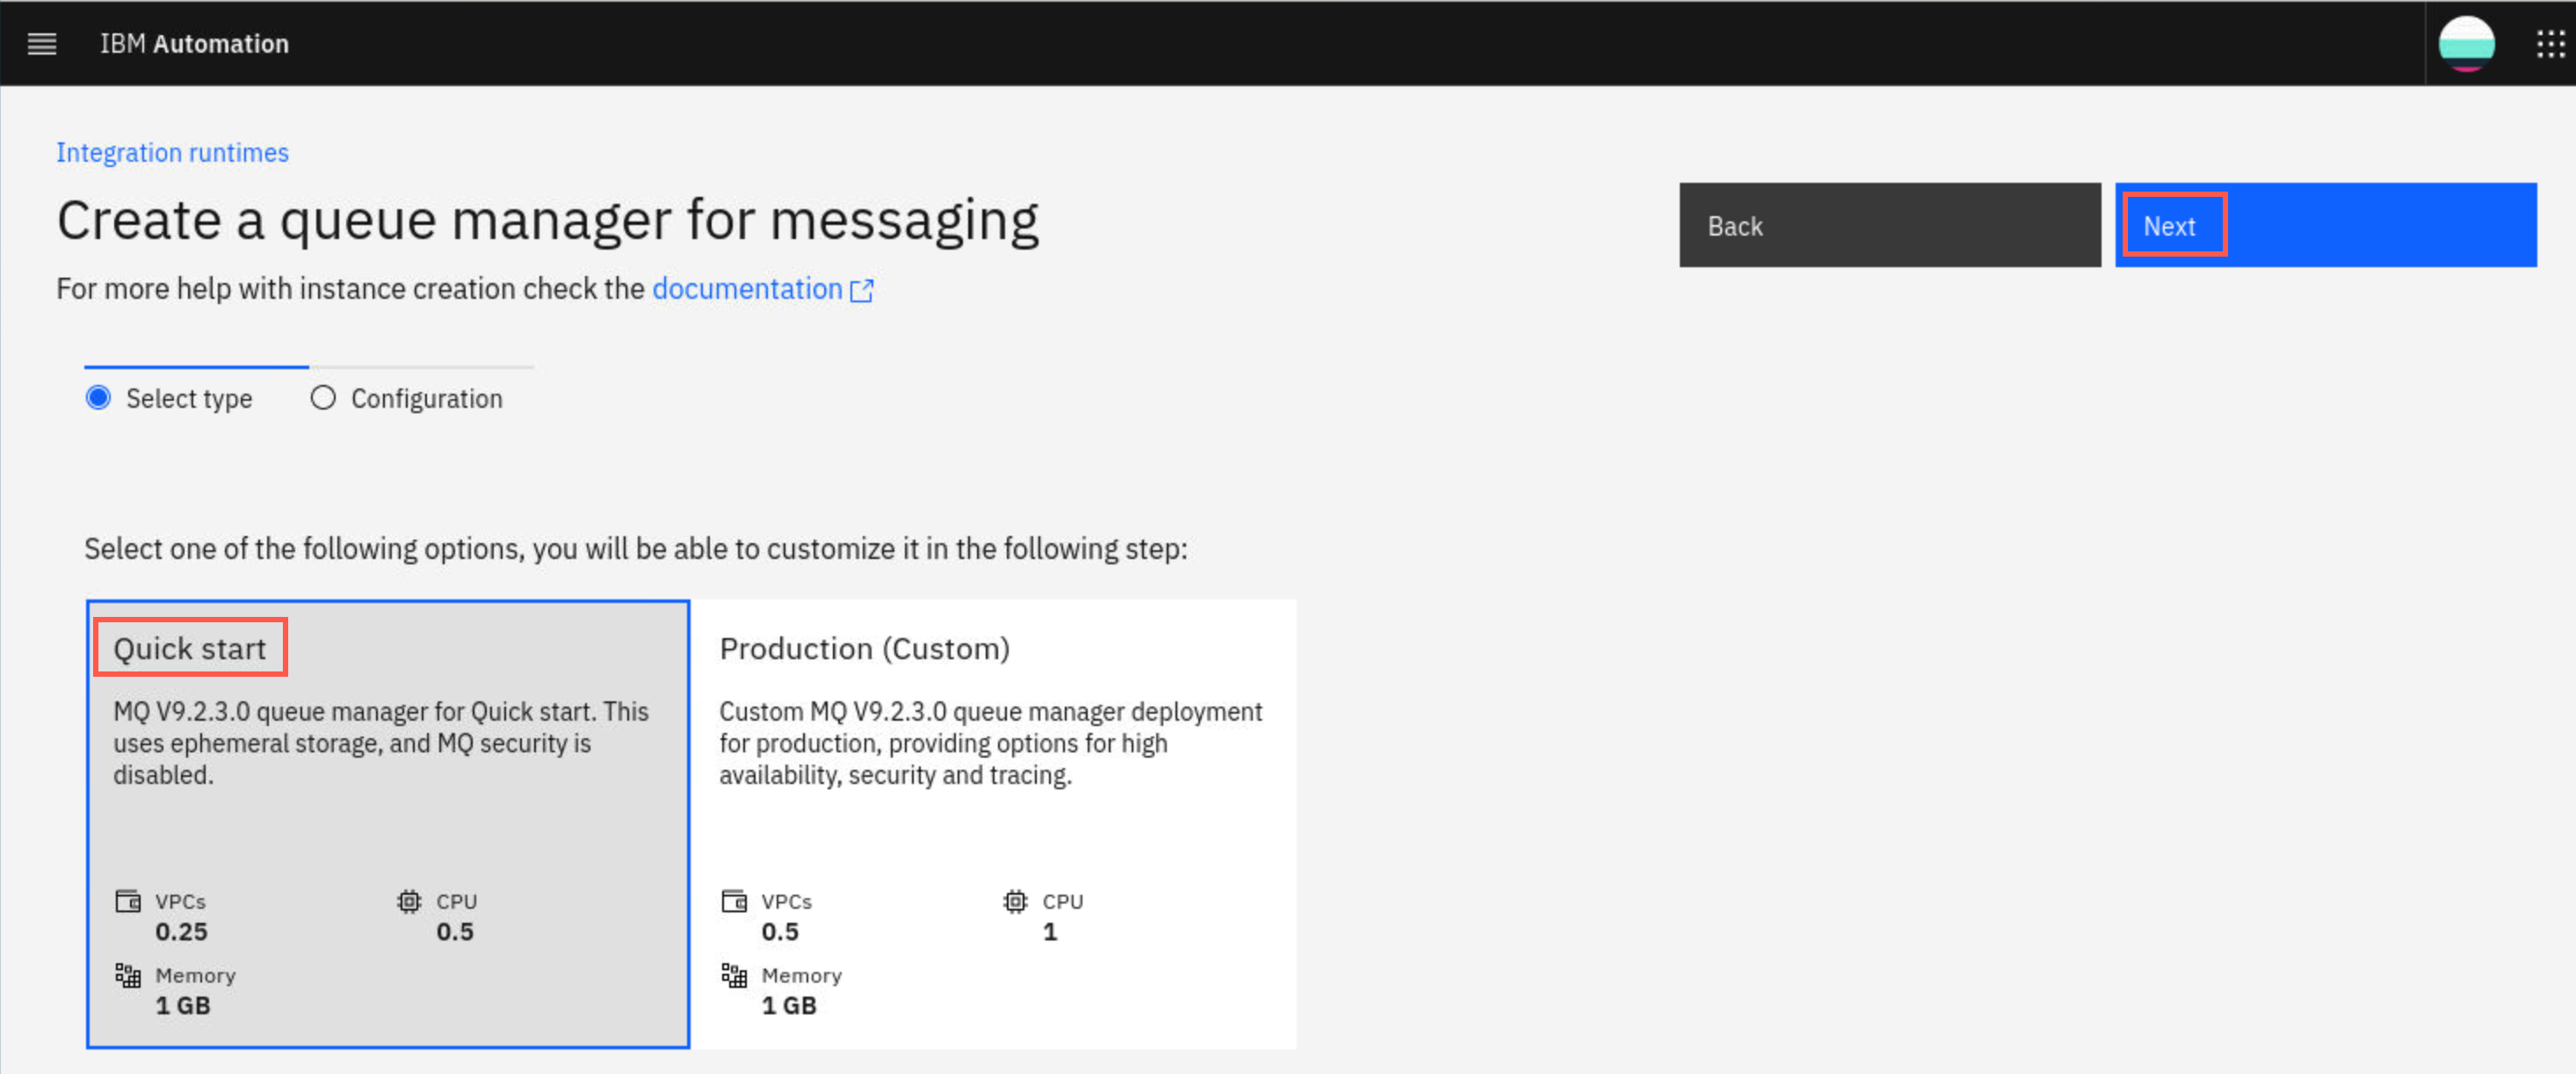
You will use the option called Quick start which will deploy an MQ container with 0.5 cpu, 1 GB of memory, and measured at 0.25 vpc (Virtual Processor Core). Click the Quick start tile then click Next.
-
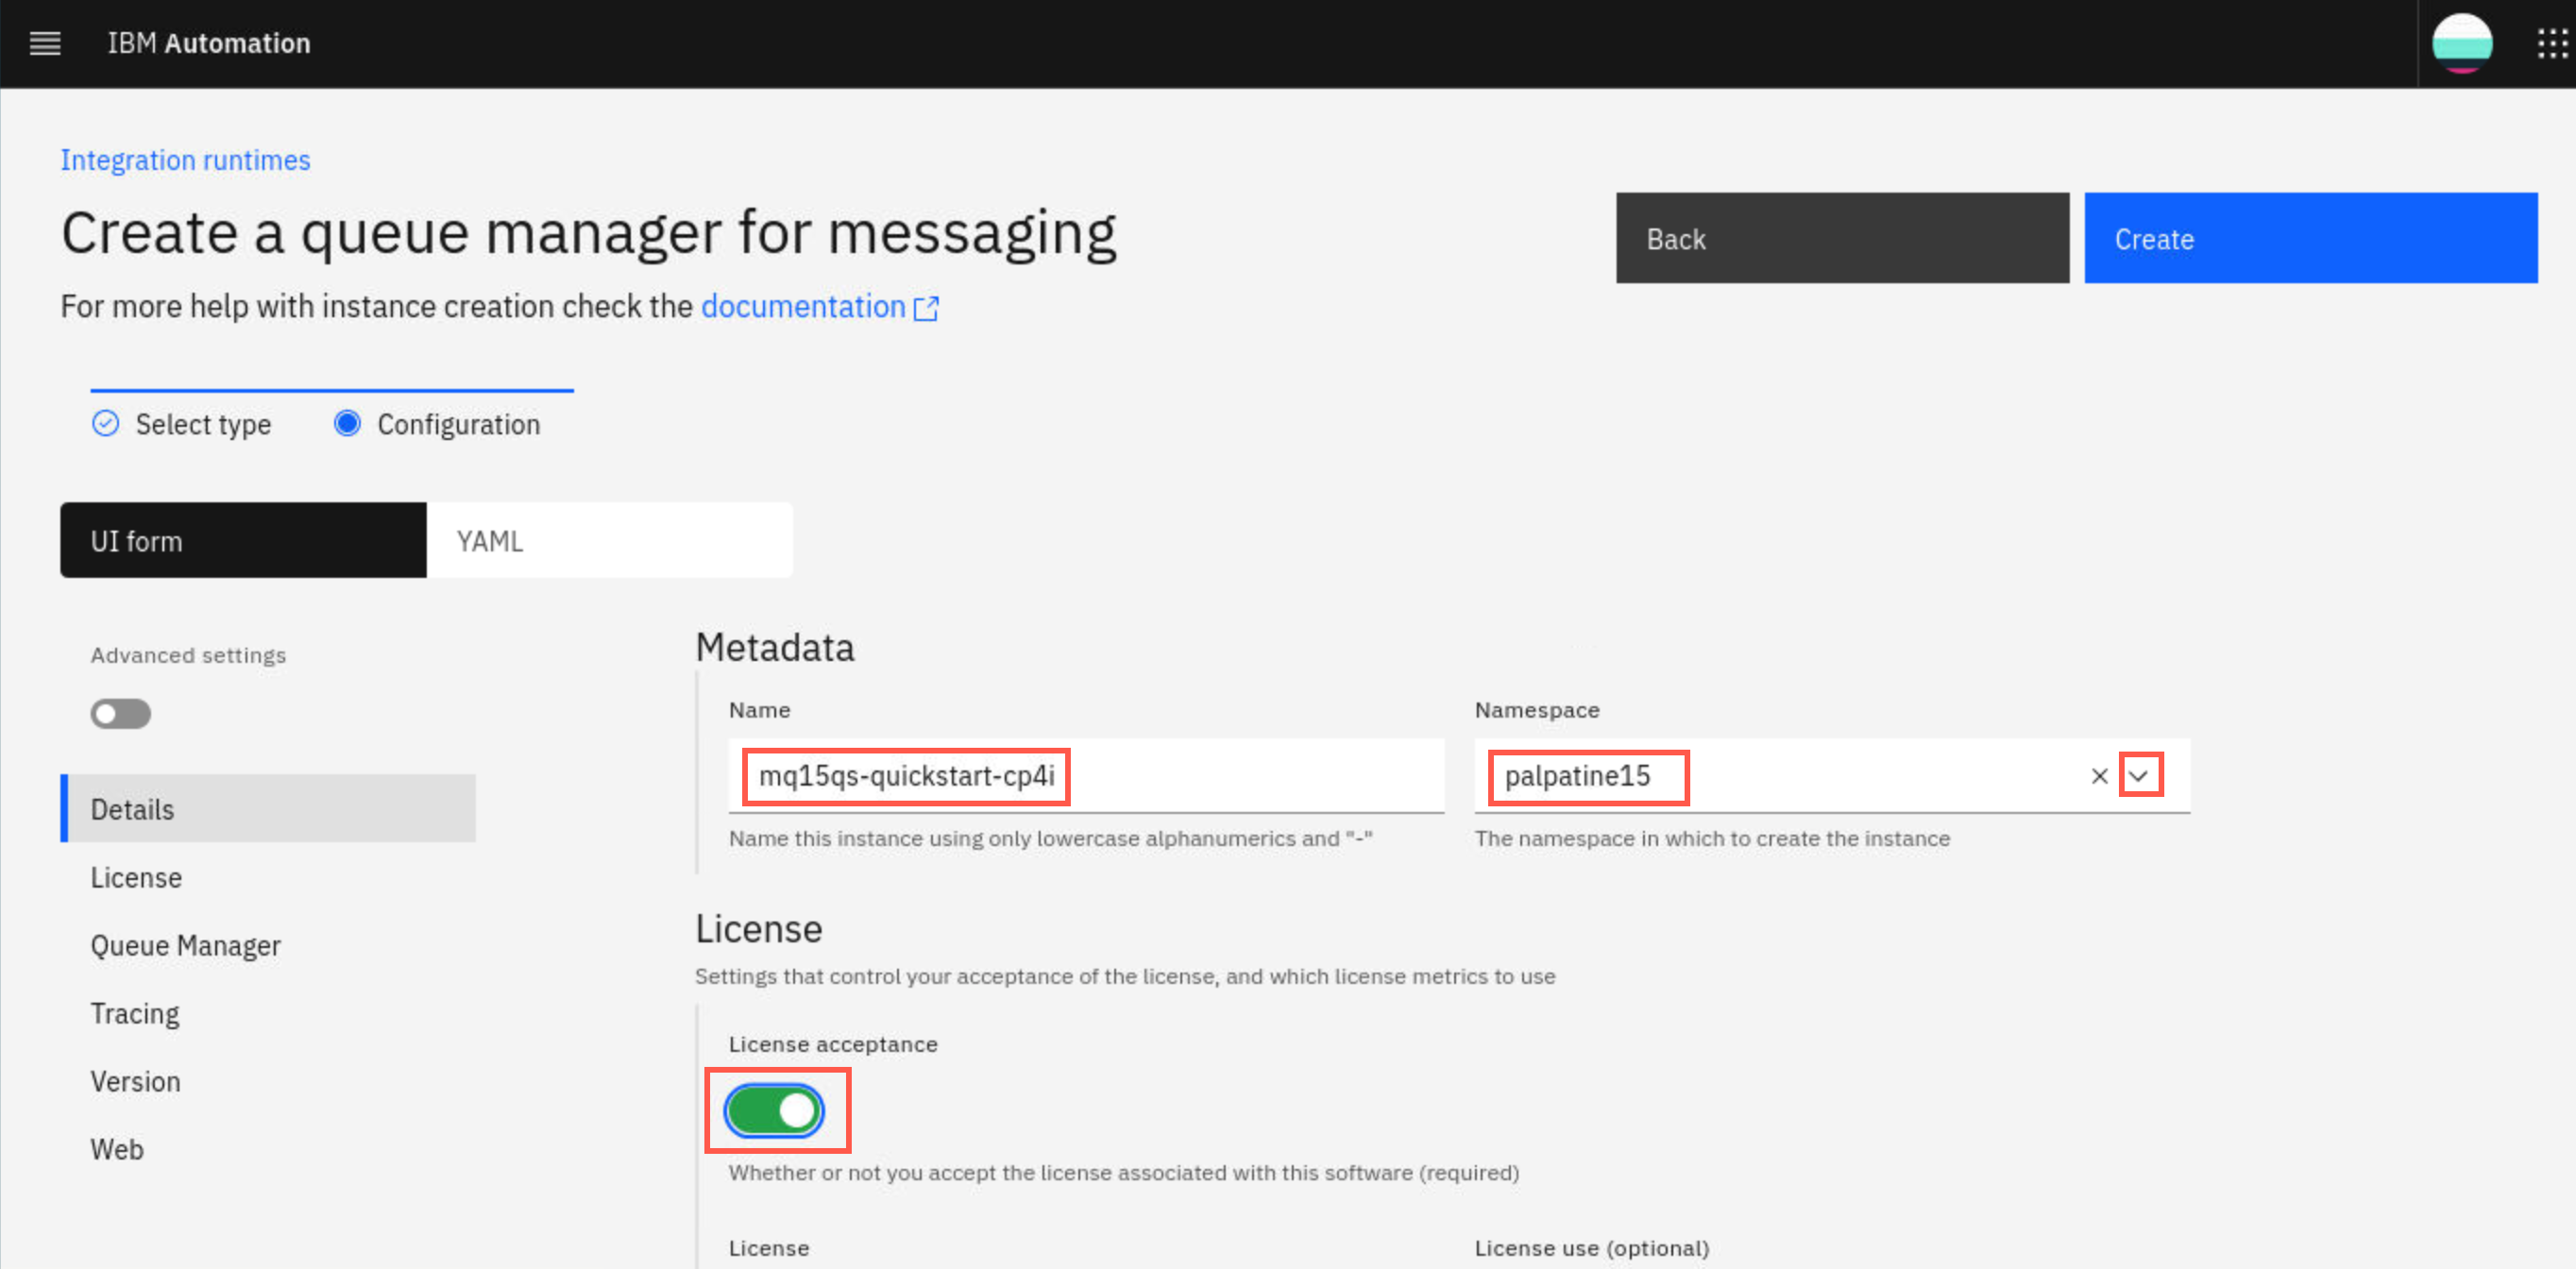
On the Create queue manager configuration page, enter “mq” plus your student number as a prefix to the Name quickstart-cp4i and use the drop-down under Namespace to select your assigned namespace. Click the License acceptance button to turn it on.
-
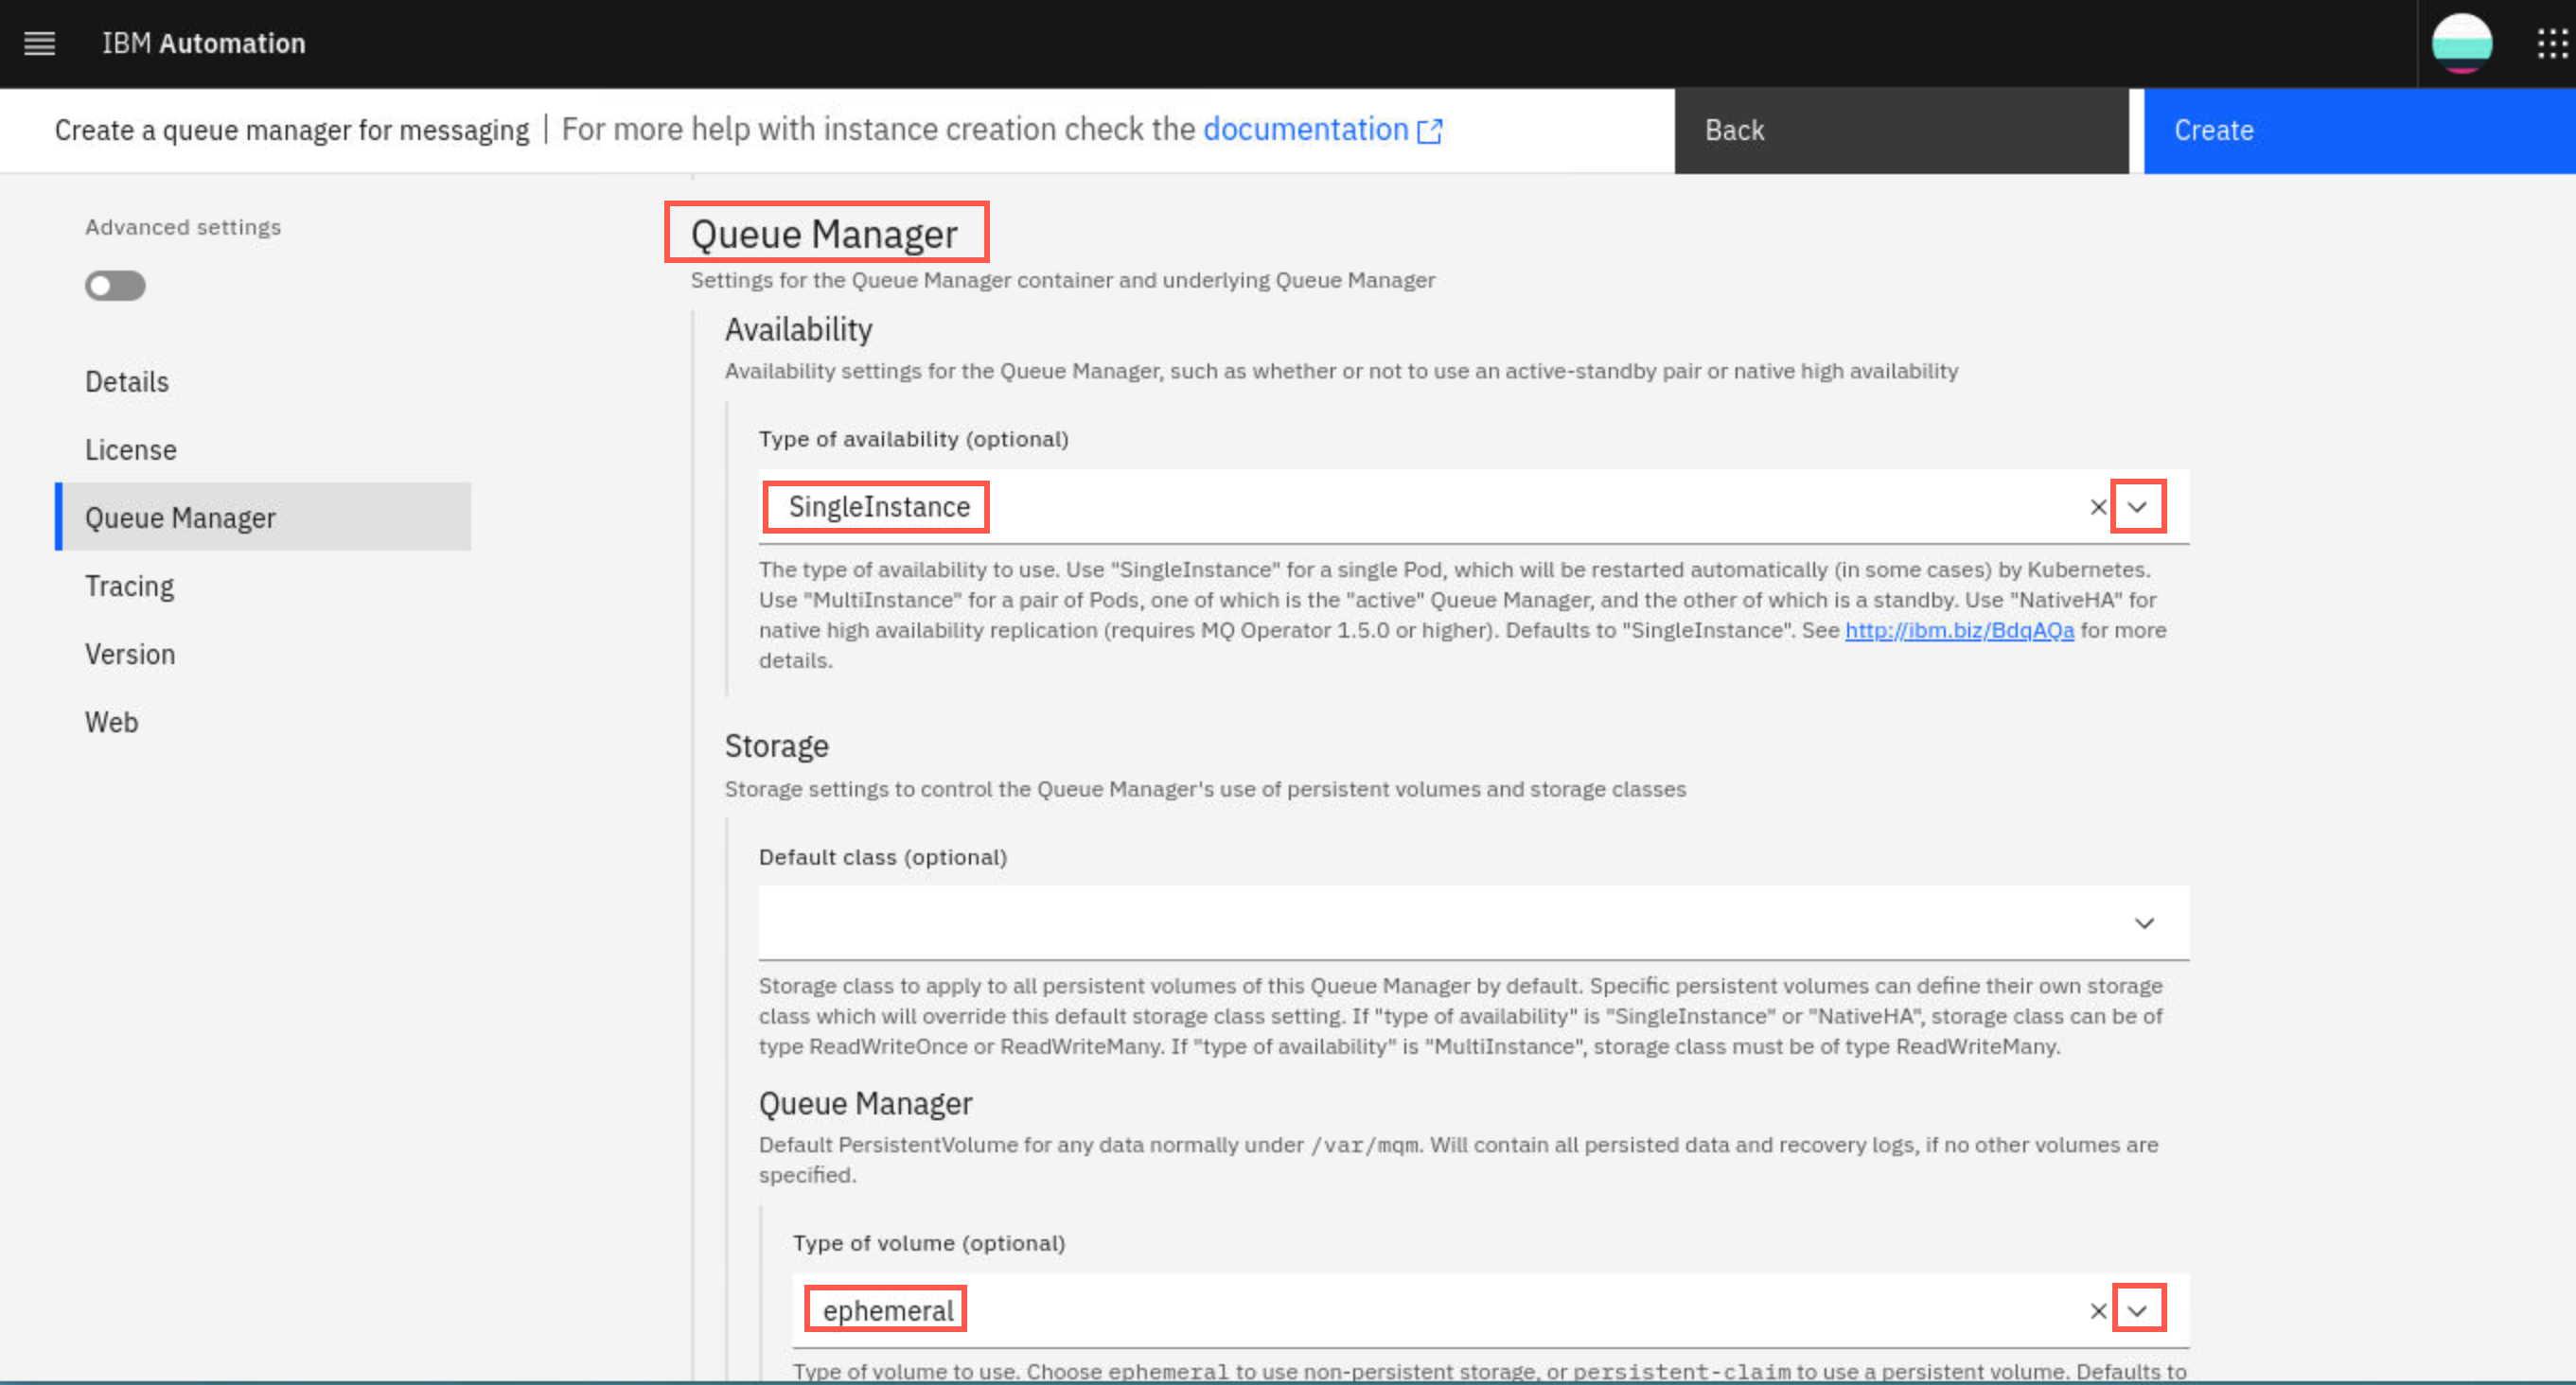
Scroll down to Queue Manager section. Using the drop-down under Type of availability select SingleInstance. Under Type of volume leave the default ephemeral. You have a choice between ephemeral or persistent-claim. Ephemeral means that the queue manager does not maintain state so does not need persistent-storage.
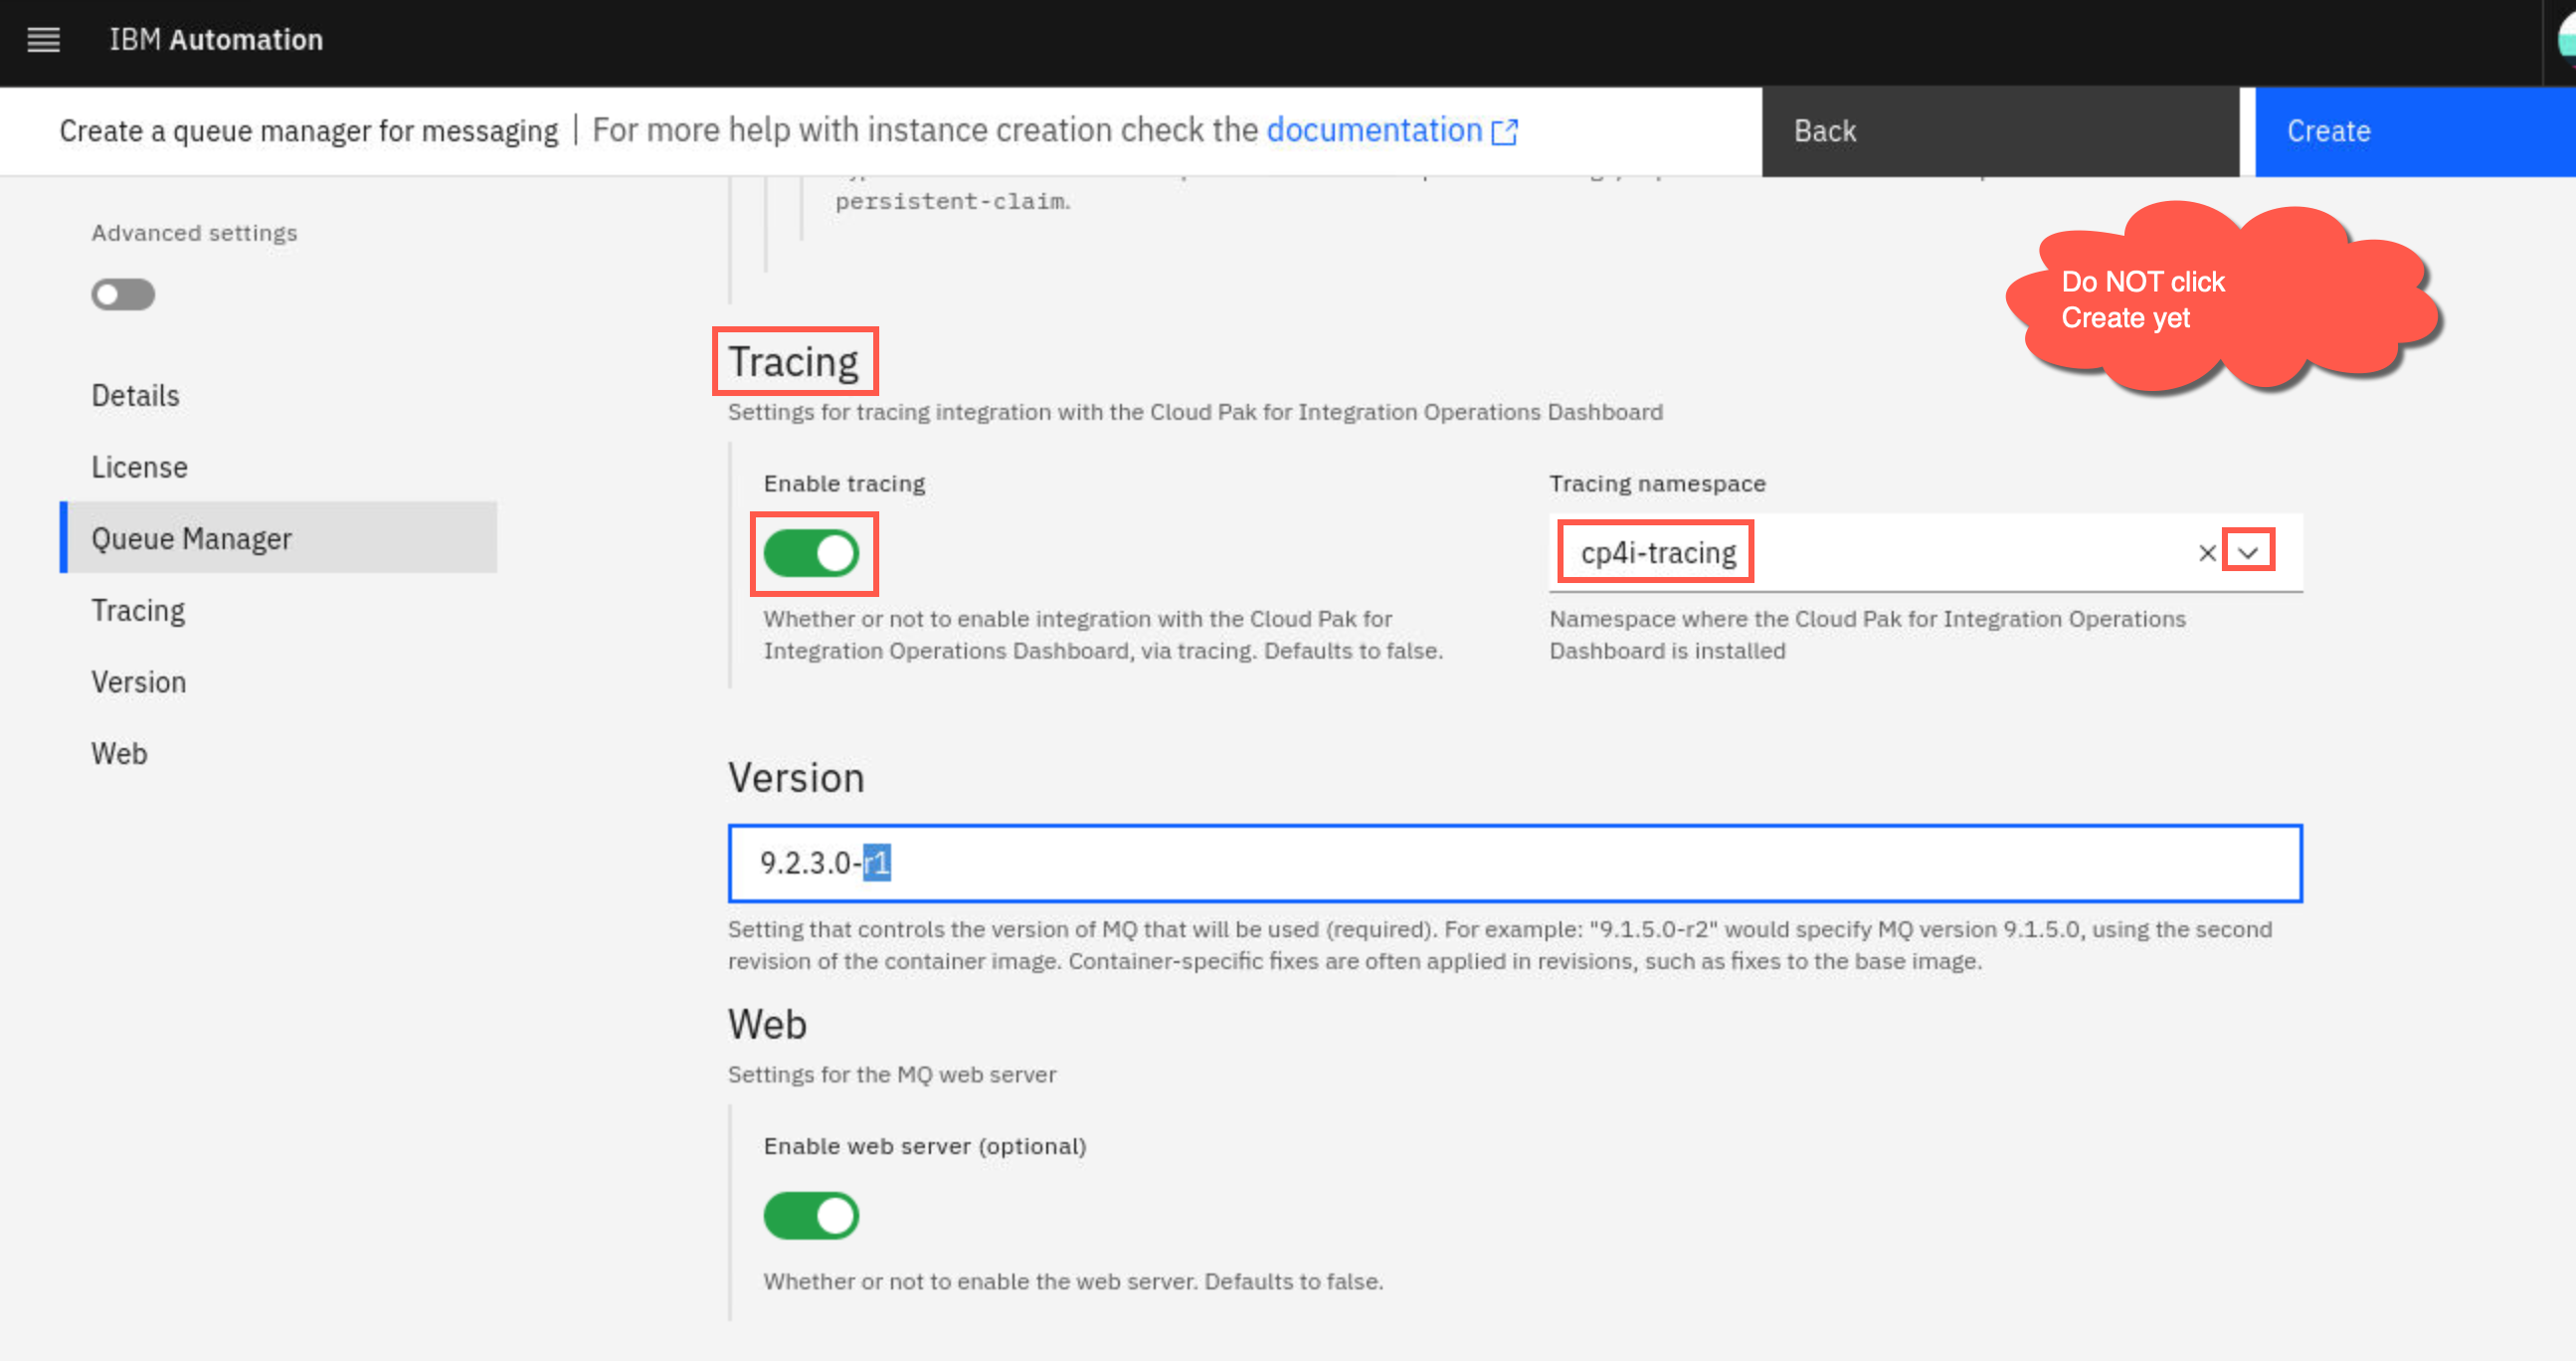
Under Tracing click the button to enable tracing and use the drop-down under Tracing namespace to select cp4i-tracing. Do NOT click Create yet. You need to name your queue manager.
-
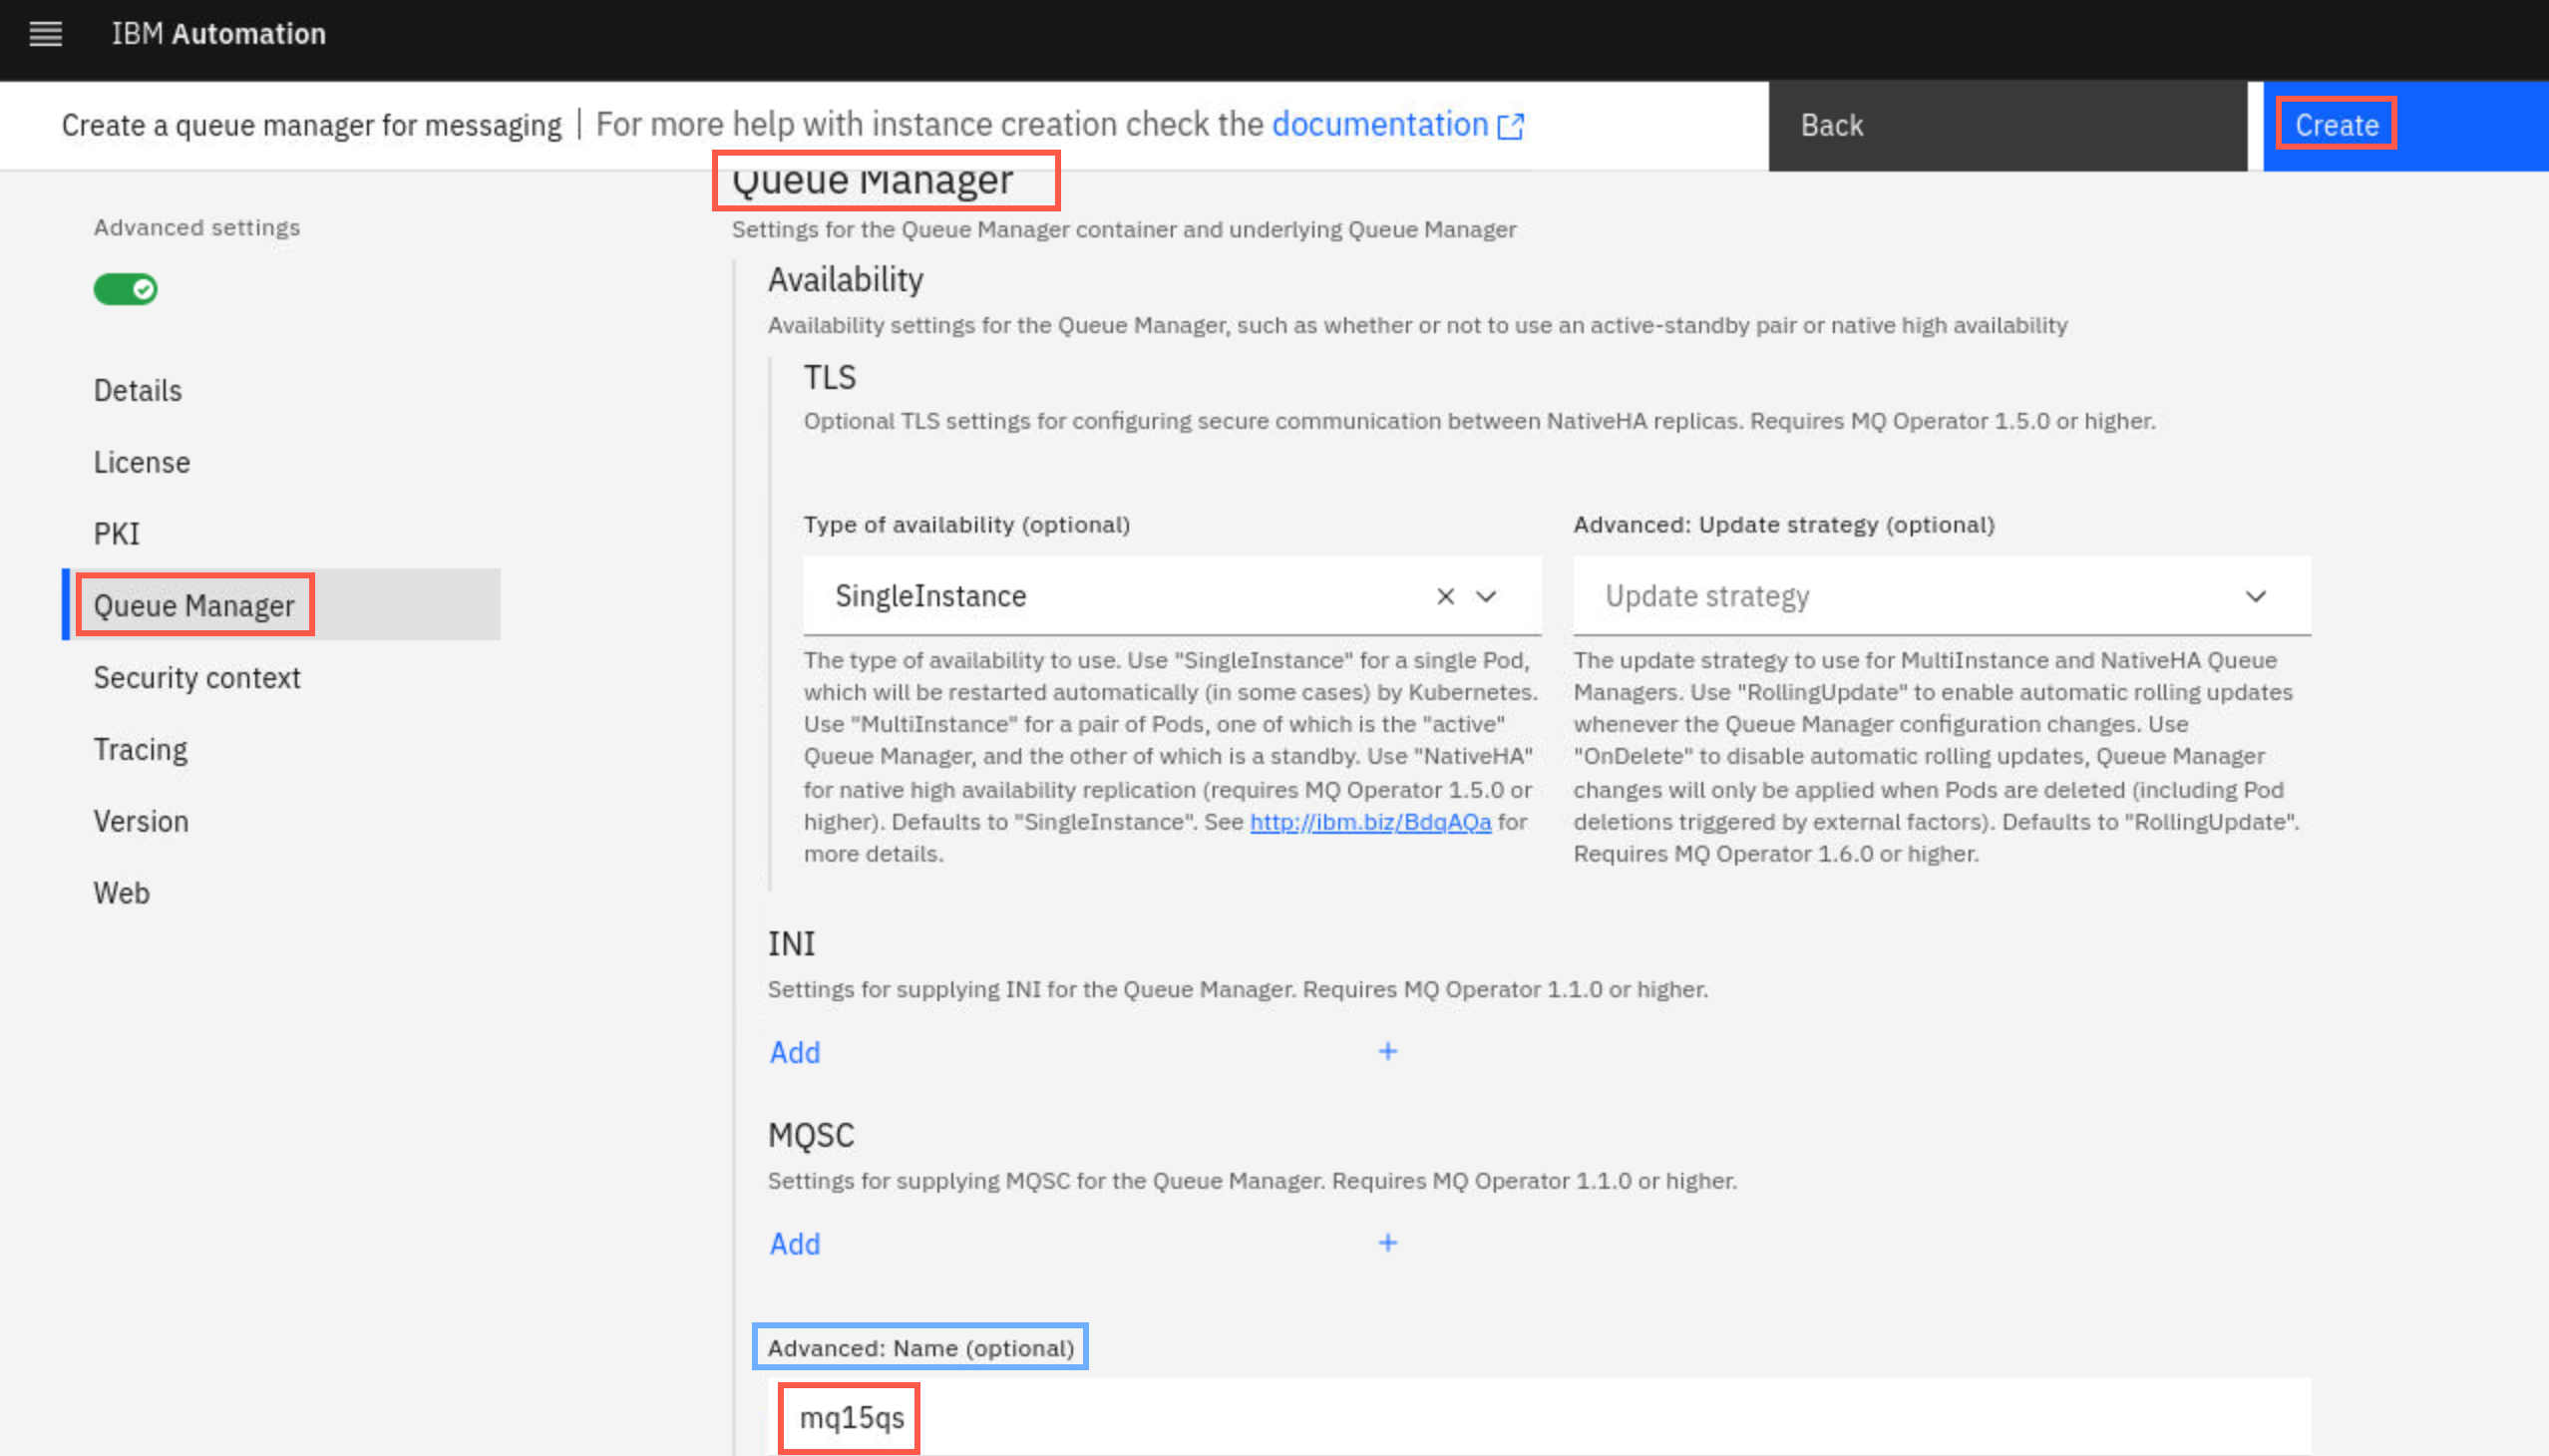
On the left side bar, click the button under Advanced settings to expose more settings. You may need to scroll to find the Queue Manager section again. Under Advanced: Name field you see the default QUICKSTART. Replace this with your queue manager name using your student ID and qs, ie mqxxqs.
Now click Create.
-
If all entries are valid, you will receive a notification of success in green. Any errors result in a notification in red. Status remains Pending while the queue manager is being provisioned.
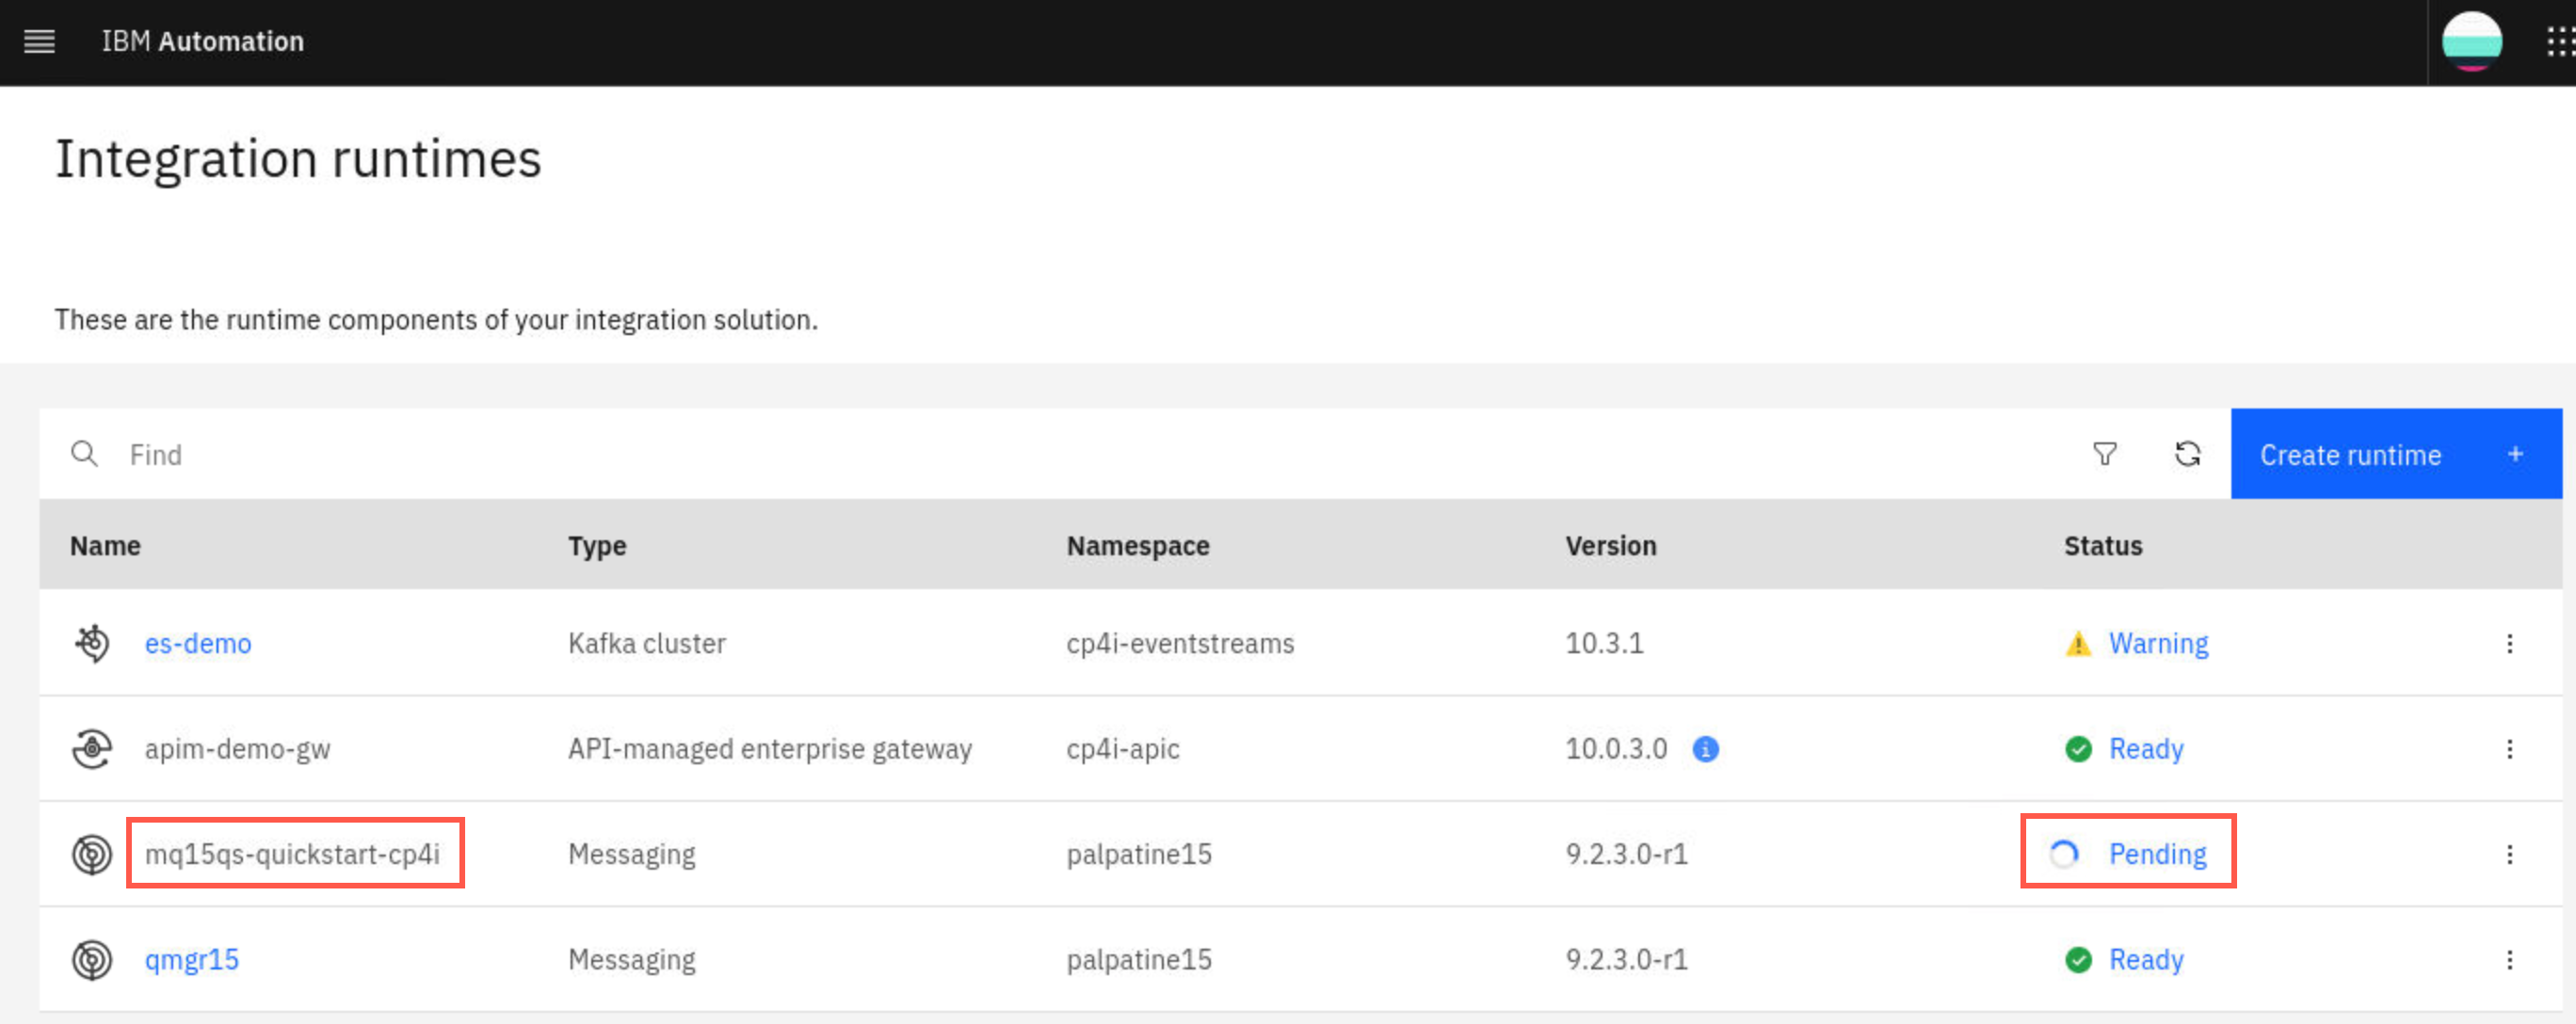
-
If you click Pending you may receive a Conditions pop-up. Since you specified Tracing in the configuration, you need to register the queue manager to the operations dashboard. Close the pop-up.
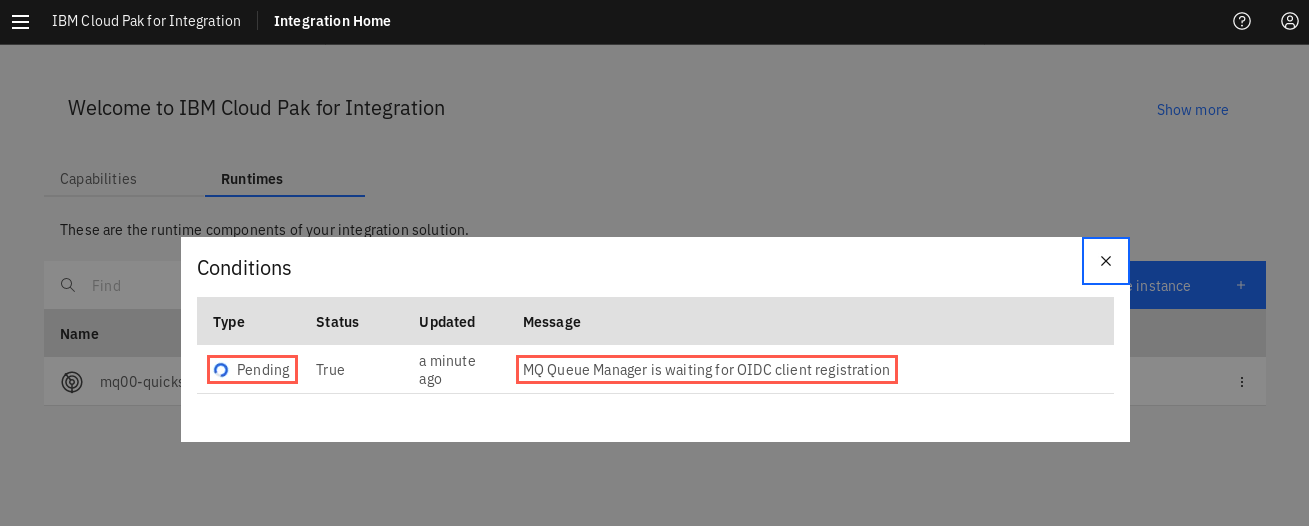
Register mq queue manager with Operations Dashboard
This only needs to be done once by the first queue manager that is starting. If the Pending status changes to Ready then registration is complete and you can skip ahead to the Start MQ Console section. Go to Start MQ Console
-
Refresh the browser page. If the status has changed to Error click the Error hyperlink.
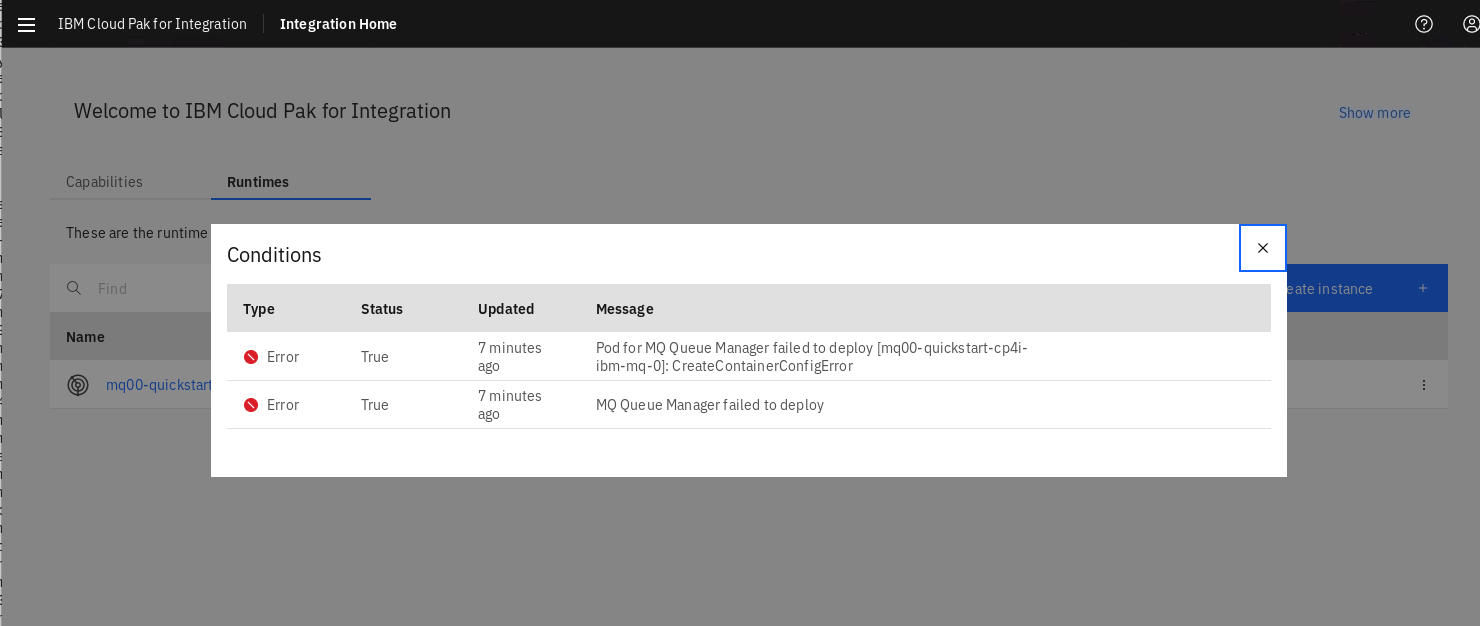
-
This error occurs because MQ has not been registered in the Operations Dashboard in the tracing namespace. Close the Conditions pop-up then click the hamburger menu next to IBM Automation > Administration > Integration runtimes.
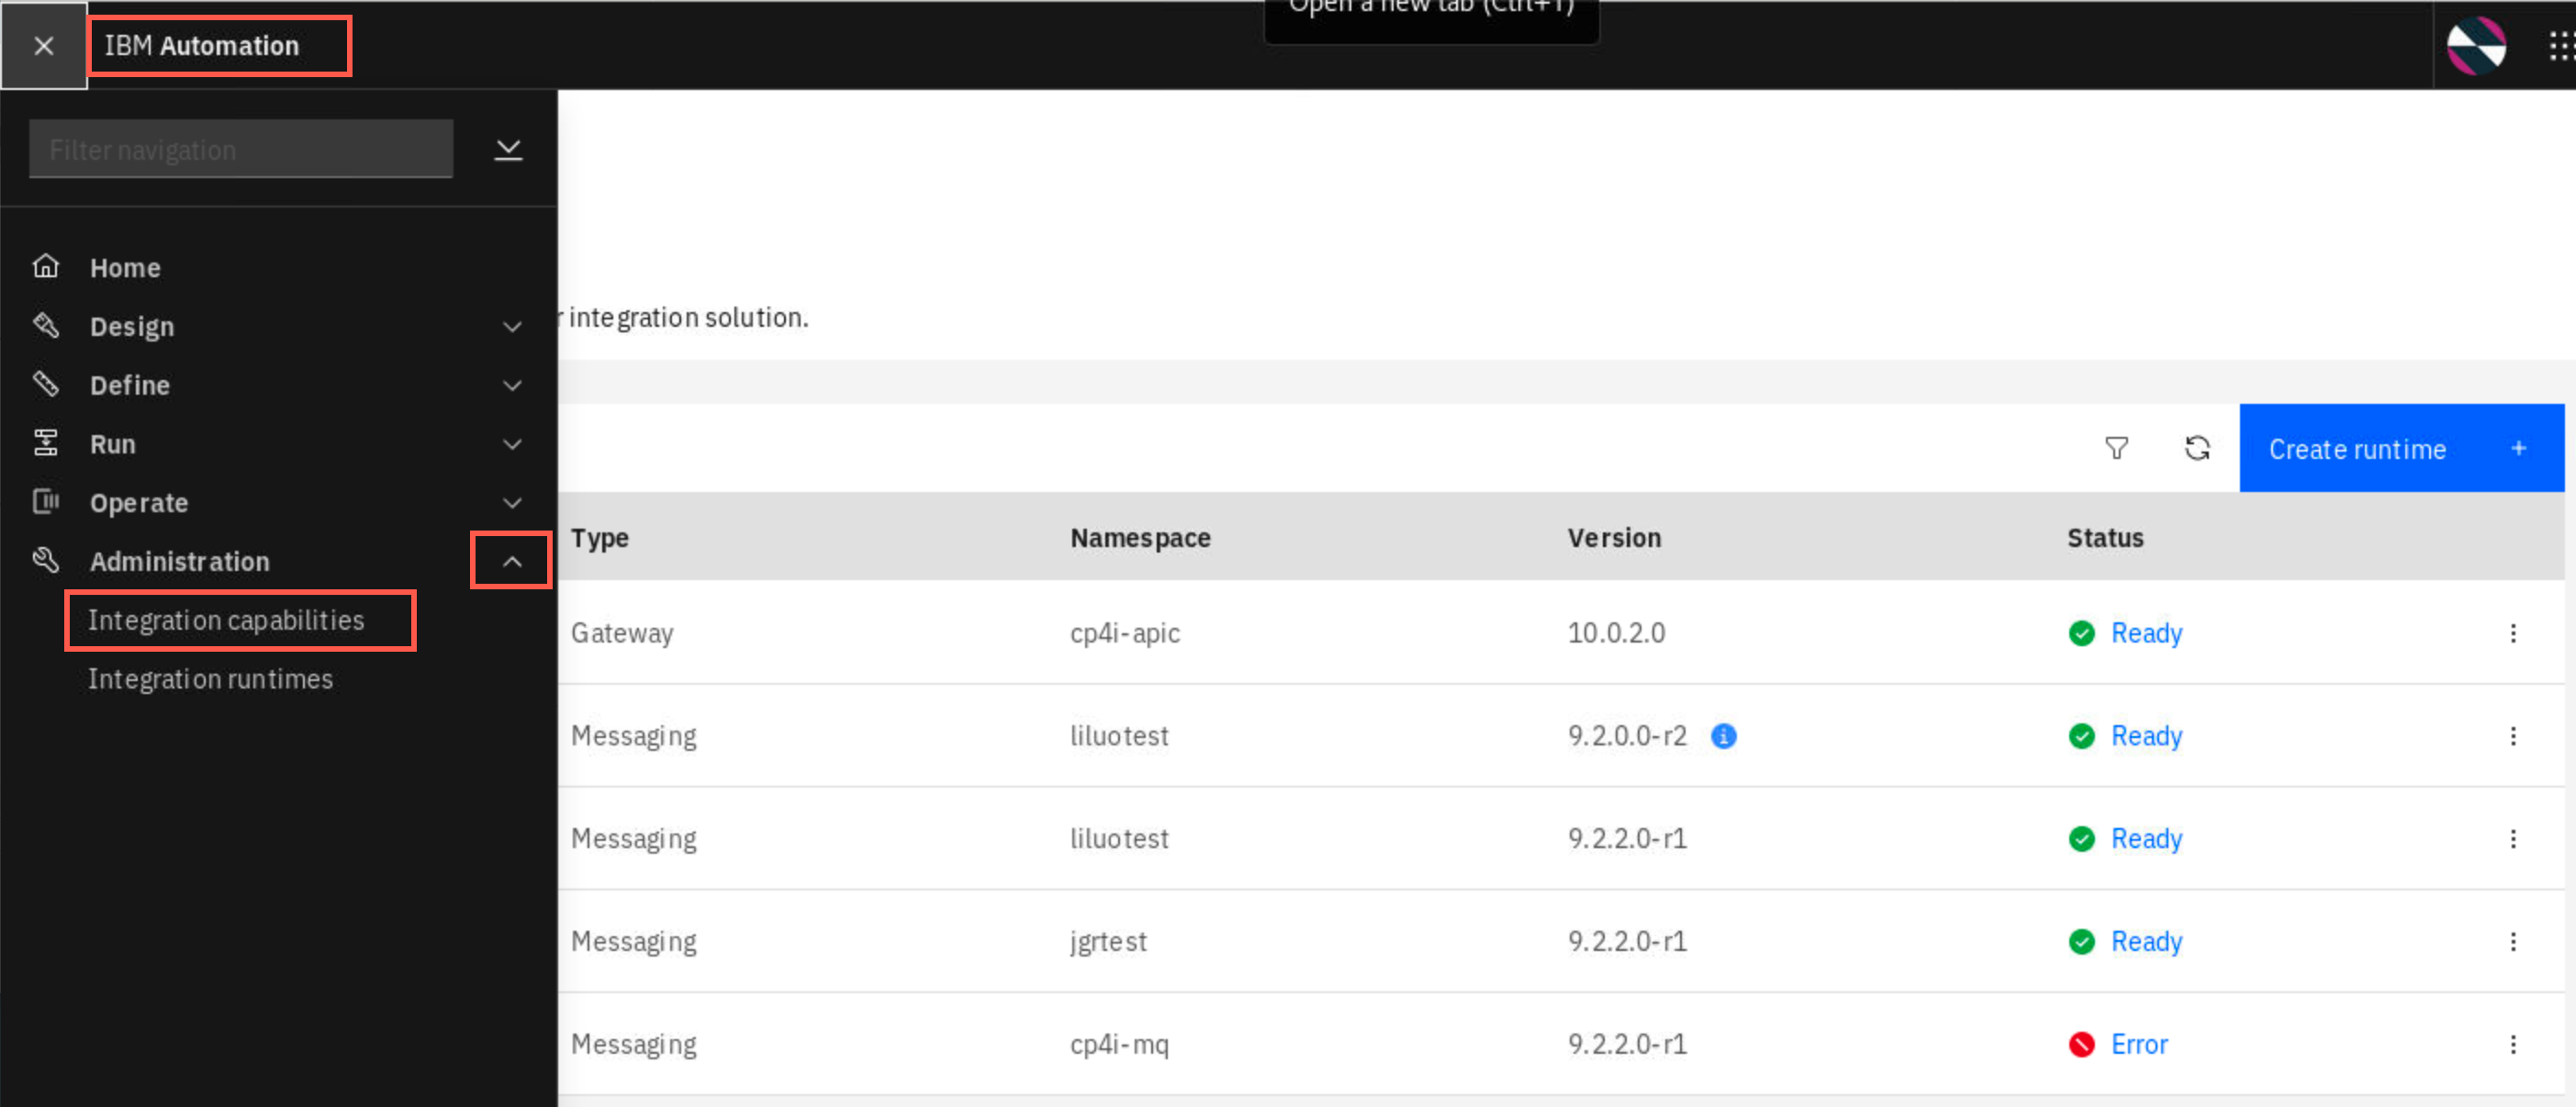
If you receive the security warning, click Advanced and then Accept the Risk and continue.
-
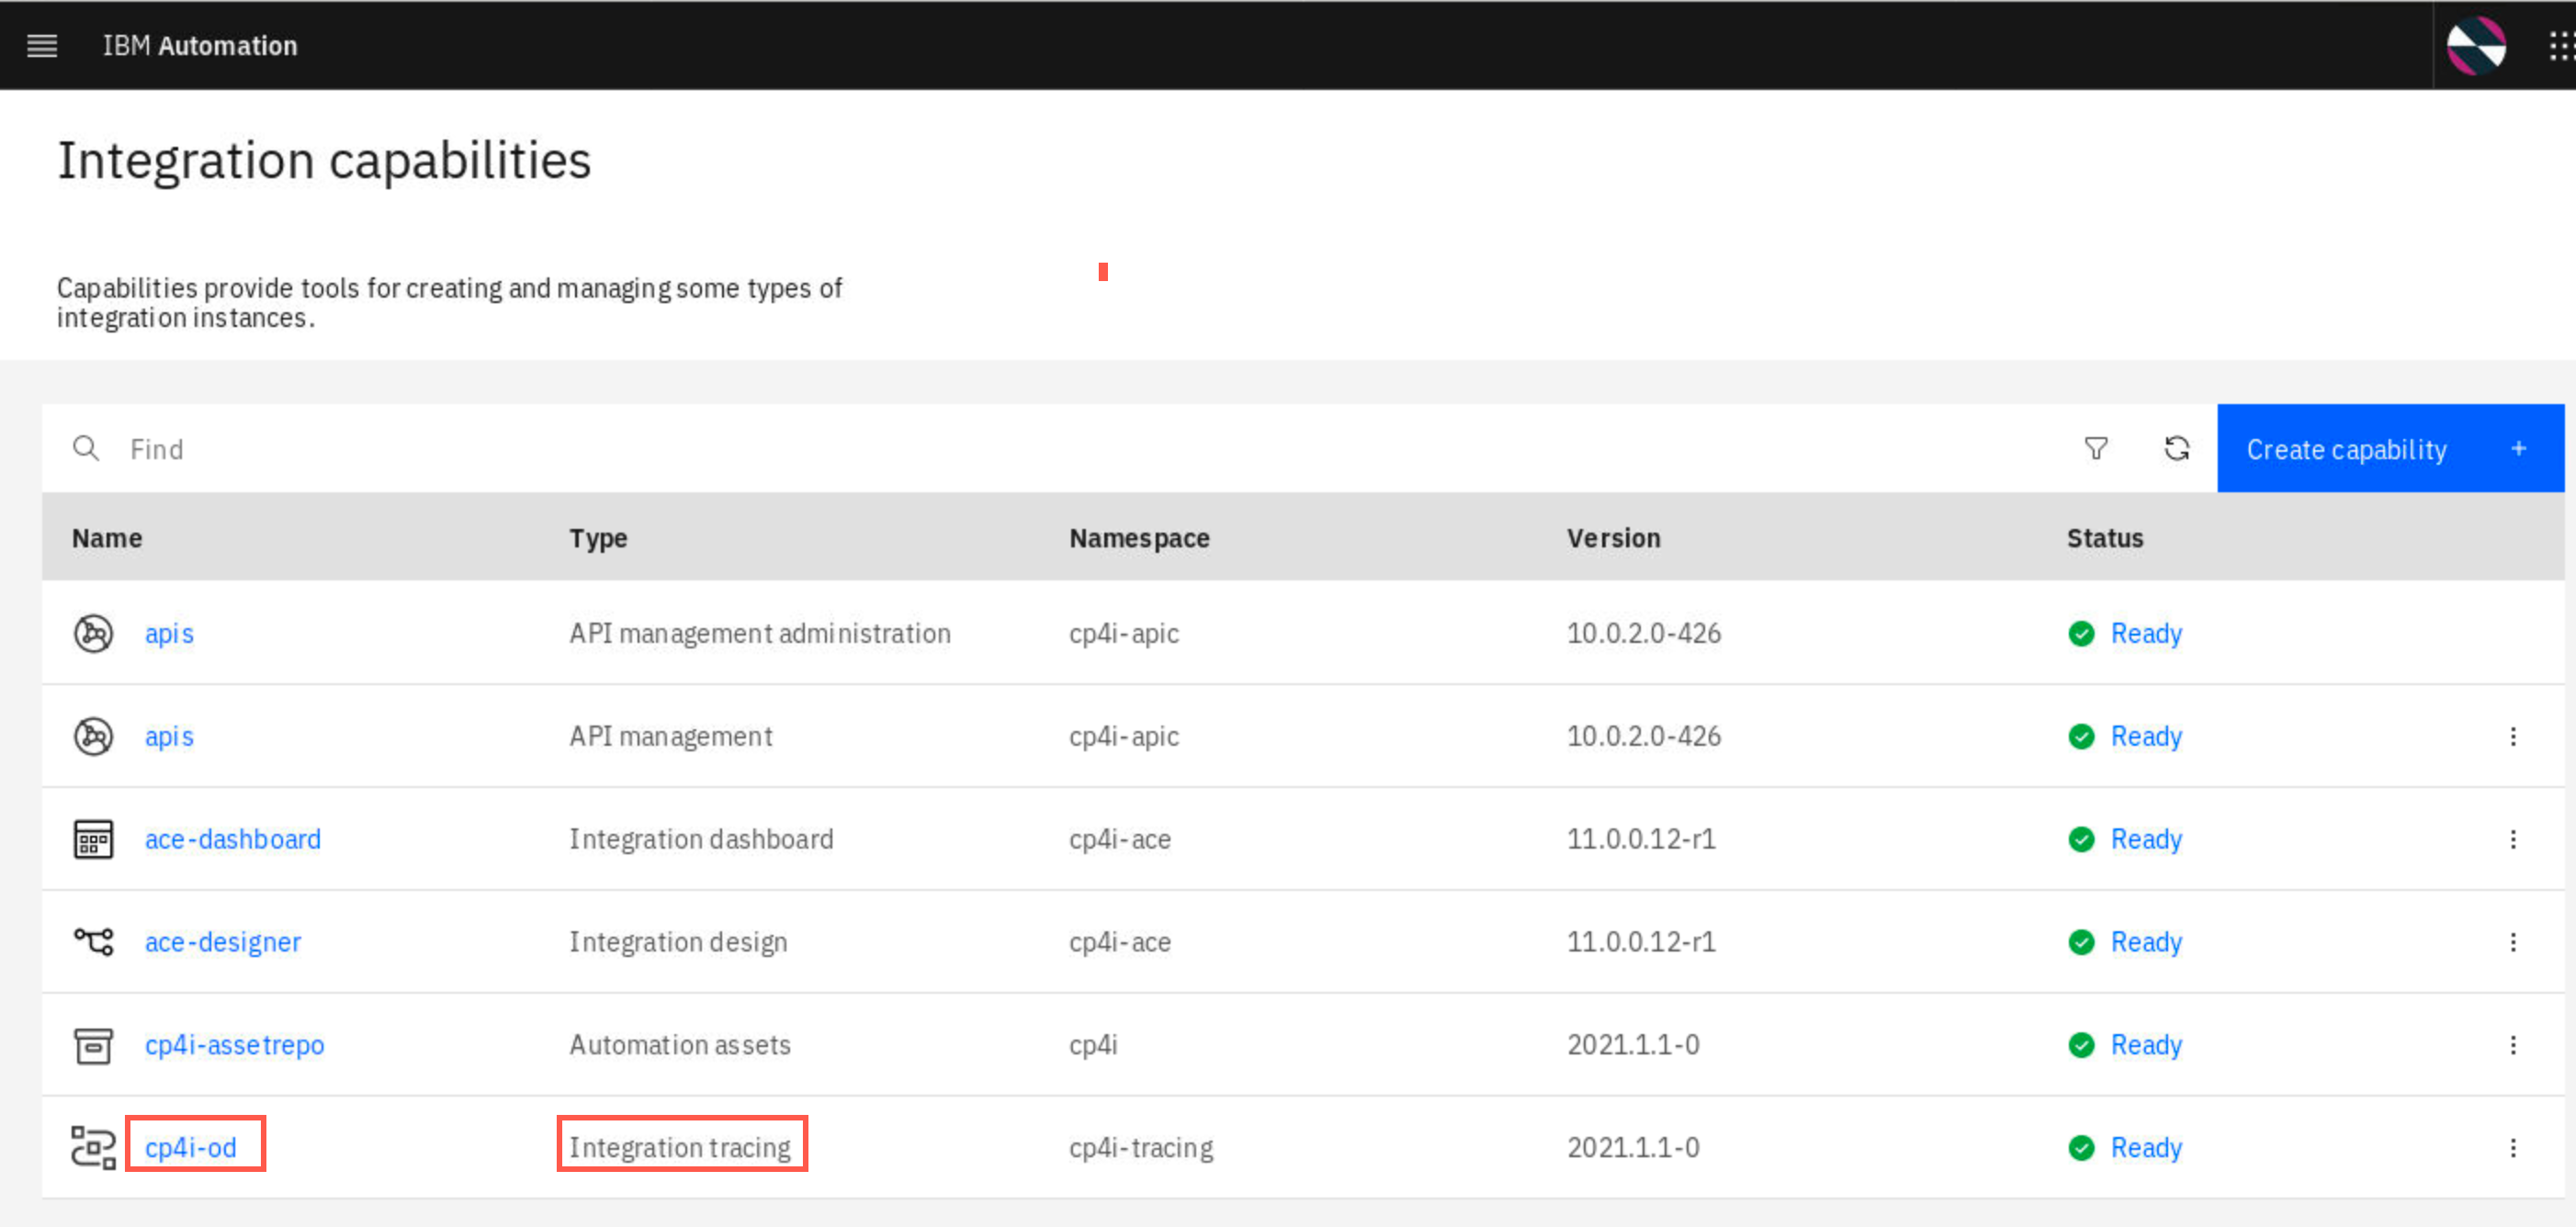
Click the cp4i-tracing hyperlink to open the Operations Dashboard.
-
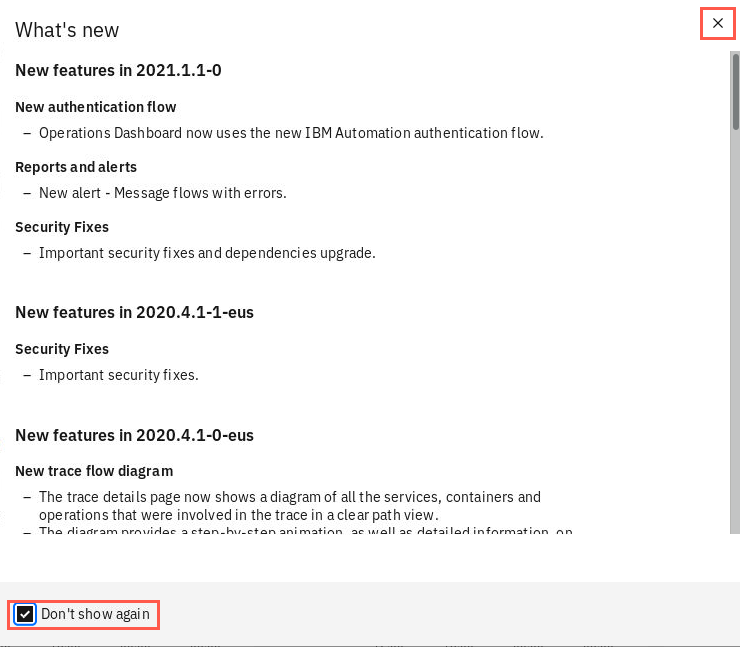
On the What’s new window, click the “Don’t show again” checkbox then close the window.
-
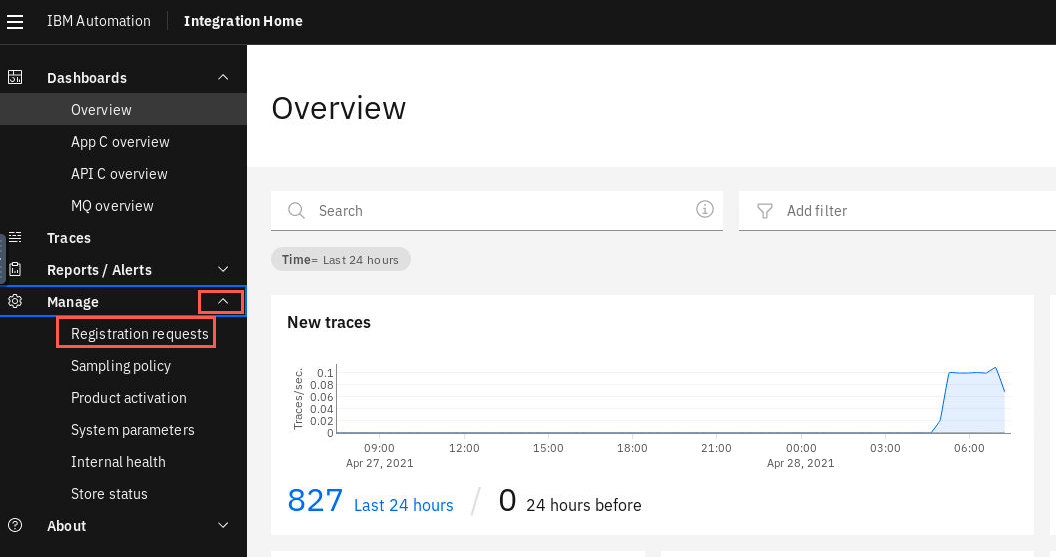
Once the Operations Dashboard is open, click the drop-down for Manage on the left sidebar. Then click Registration requests.
-
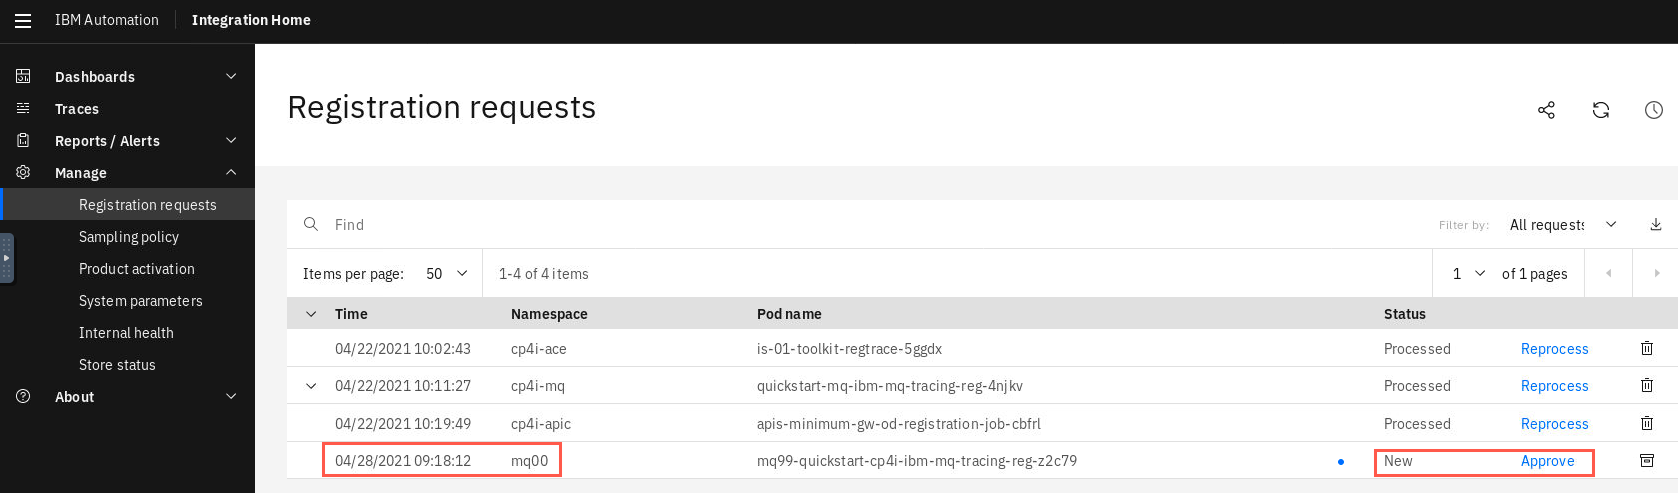
The request is displayed with a pod name. This may or may not be a pod for your queue manager (notice the pod name prefix) depending on whether your queue manager was the first to be deployed. The status is new and needs to approved. Click the Approve hyperlink.
-
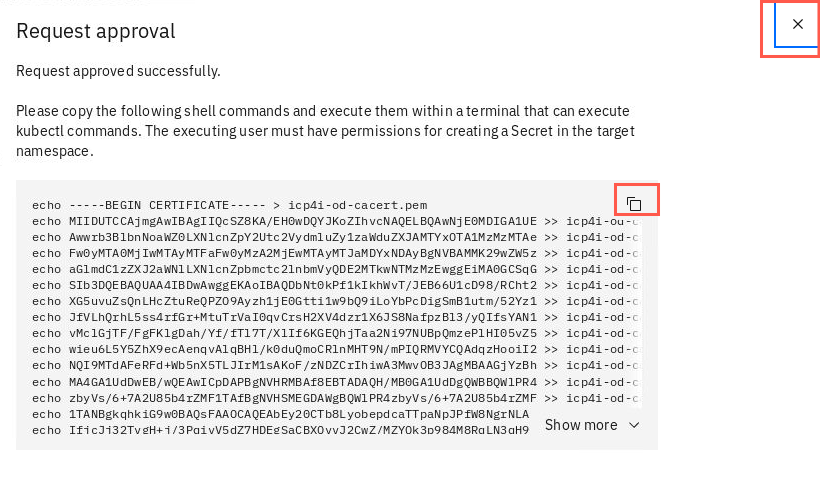
Click the copy button within the pop-up. This text is a command to create the missing secret for the tracing namespace. You need to paste this text and execute the command in a terminal window.
-
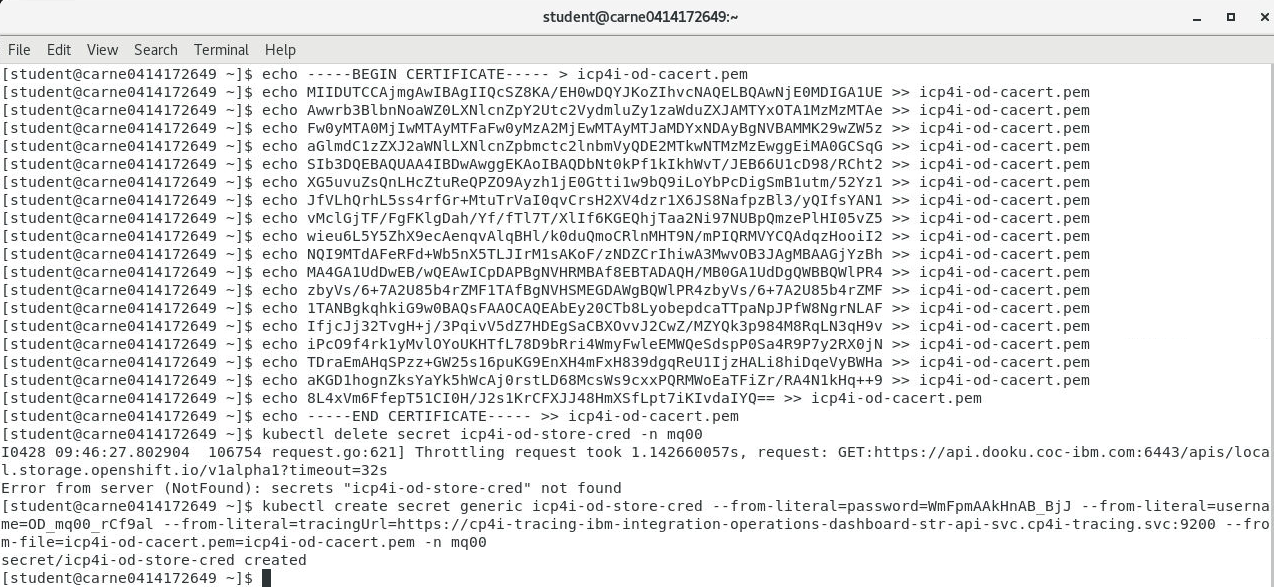
Return to the terminal window or open a new window. Paste the contents into the window and hit enter.
-
Return to the Platform Navigator and close the registration request pop-up window. Notice that the status has now changed to Processed and the hyperlink changed from Approve to Reprocess.
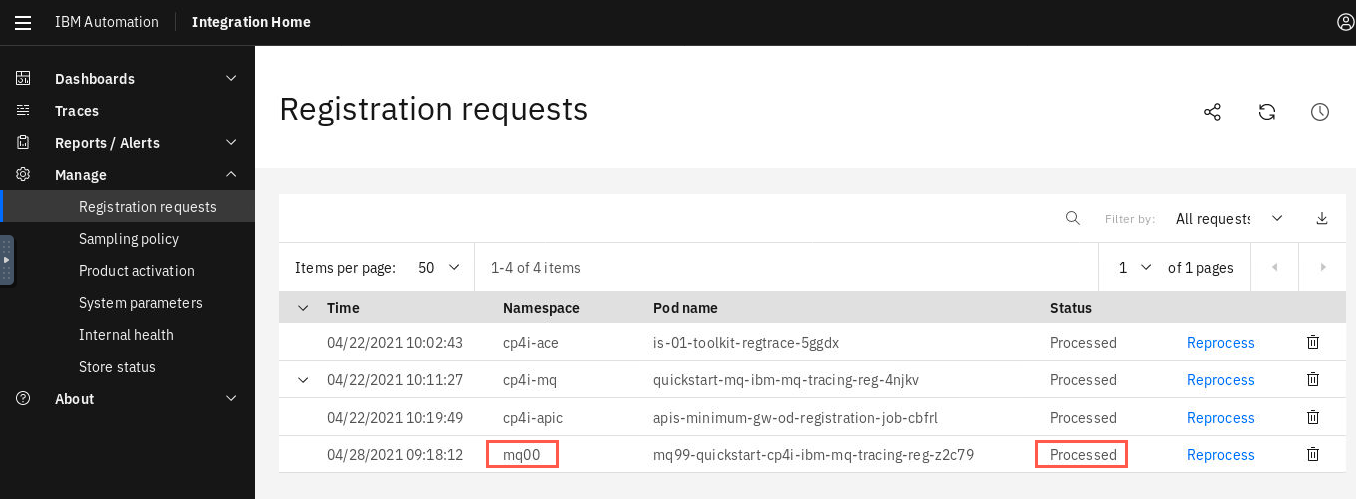
This only needs to be done once. When the request has been approved and the secret created in the cp4i namespace, all other queue managers will be deployed without this error.
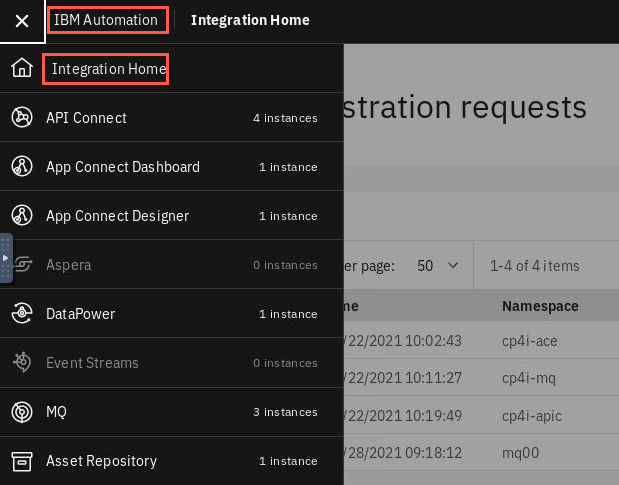
Click the IBM Cloud Pak for Integration hamburger menu on the left side bar then select Integration Home to return to the Platform Navigator.
-
Click the up arrow on the right side of the window to hide the top portion of the window and conserve screen space.
-
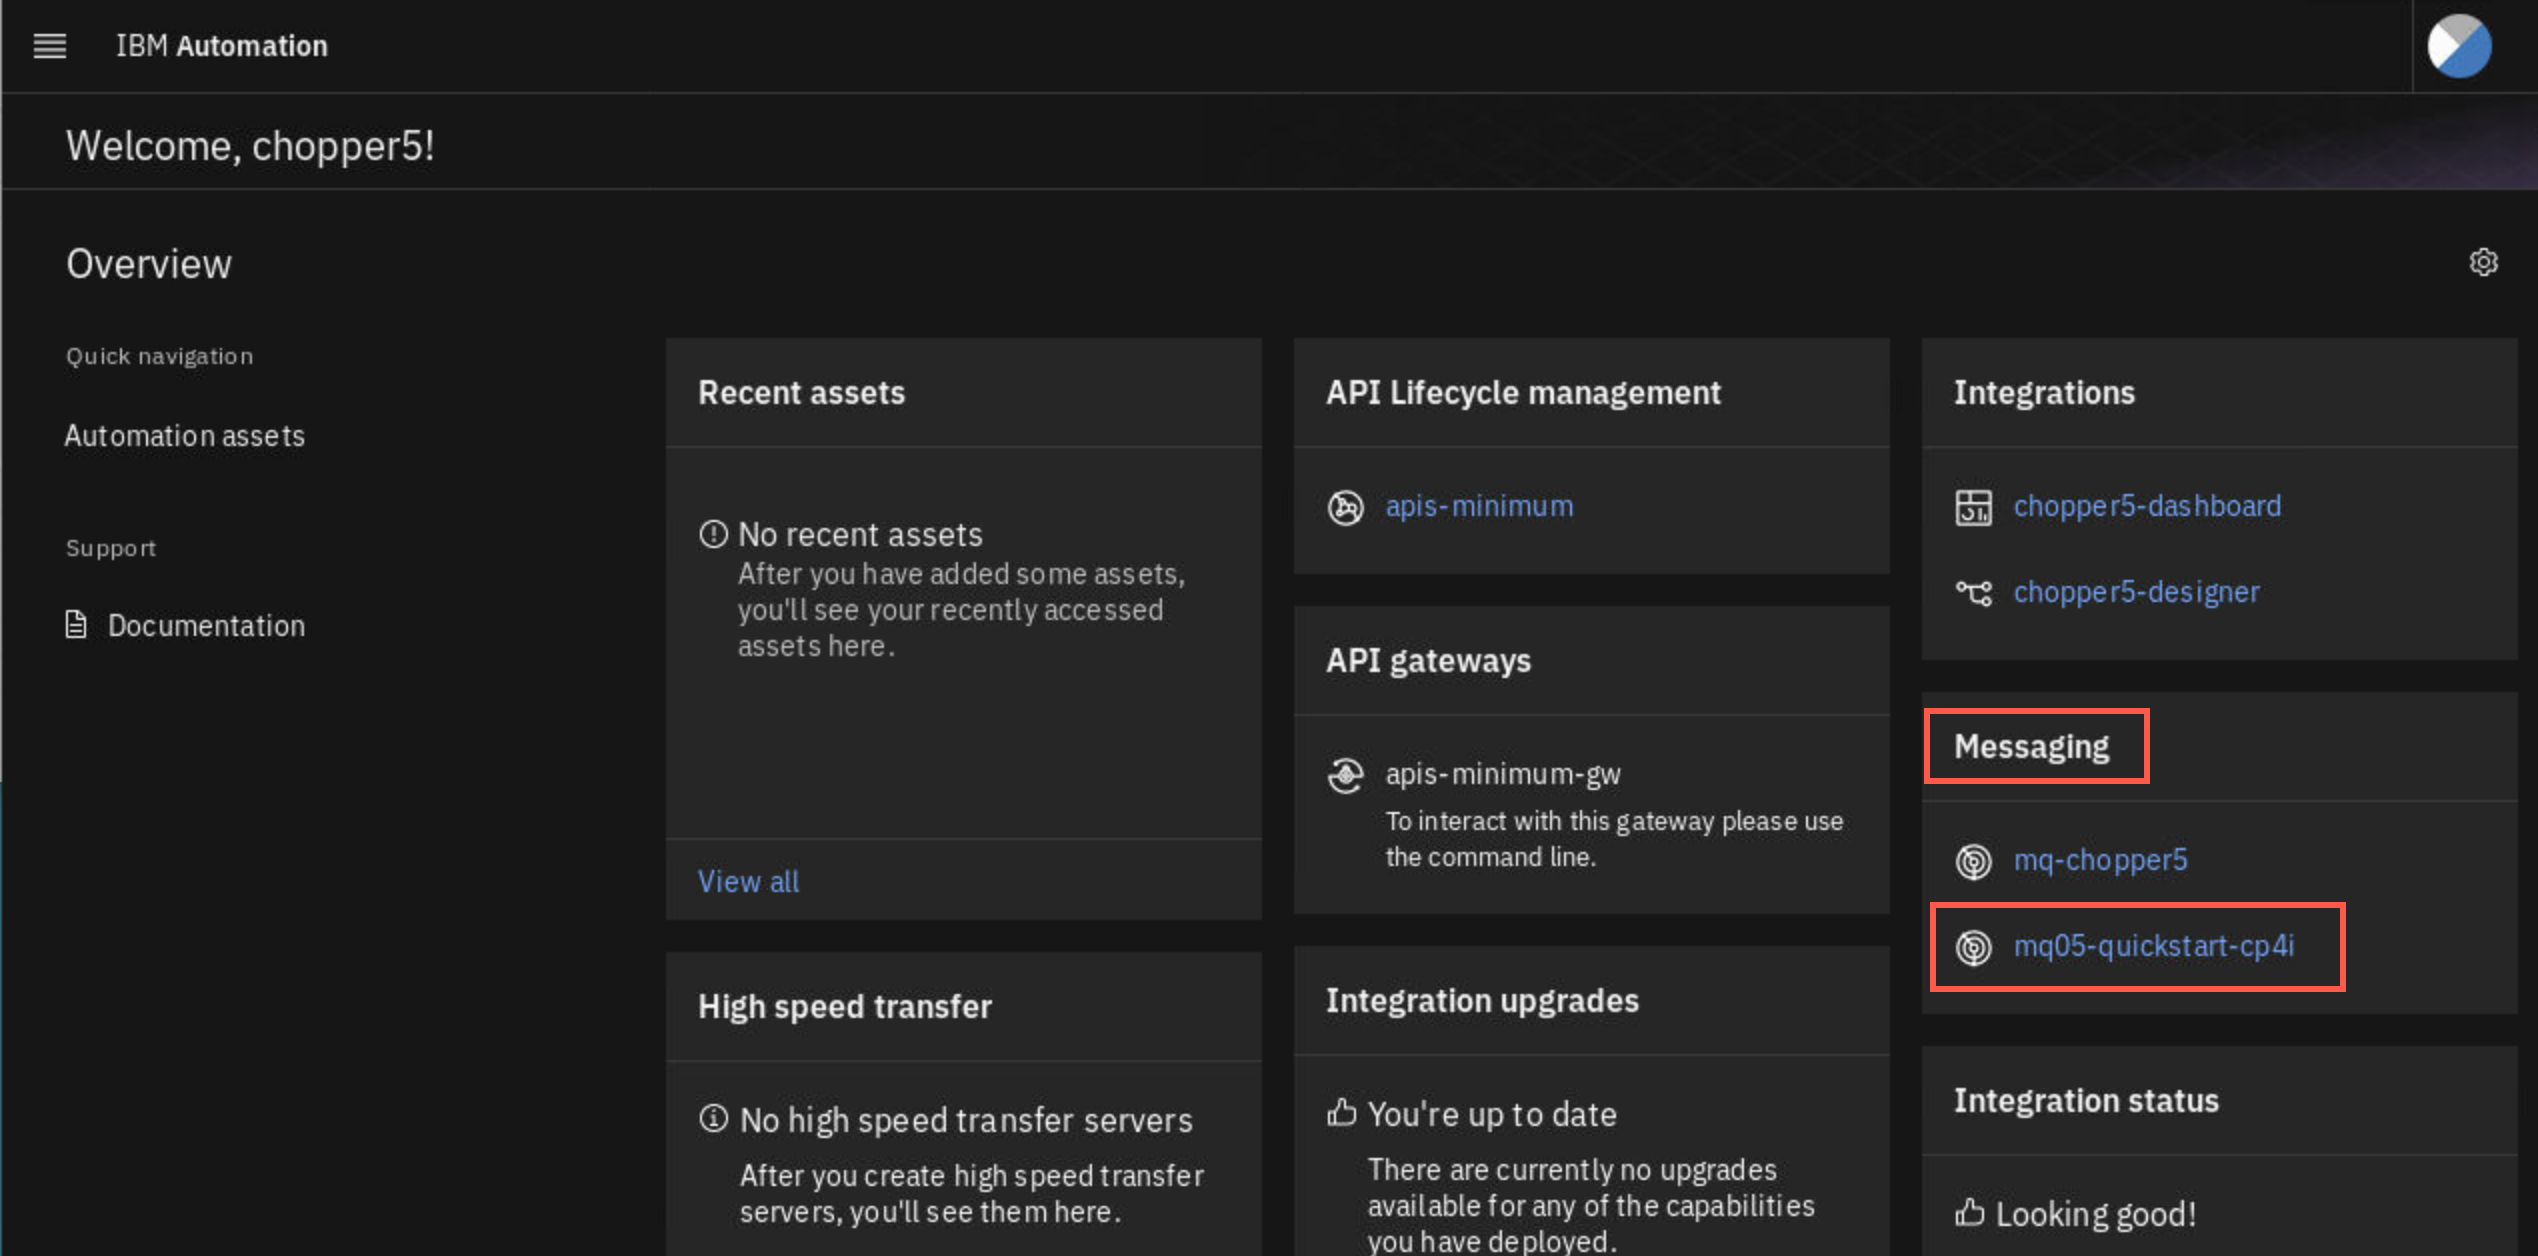
Your queue manager now appears in the Messaging tile.
Start MQ Console
-
You can click the hyperlink under Messaging to open the console. You can also return to the Platform Navigator by clicking the hamburger menu next to IBM Automation and select Integration runtimes. Then refresh the page.
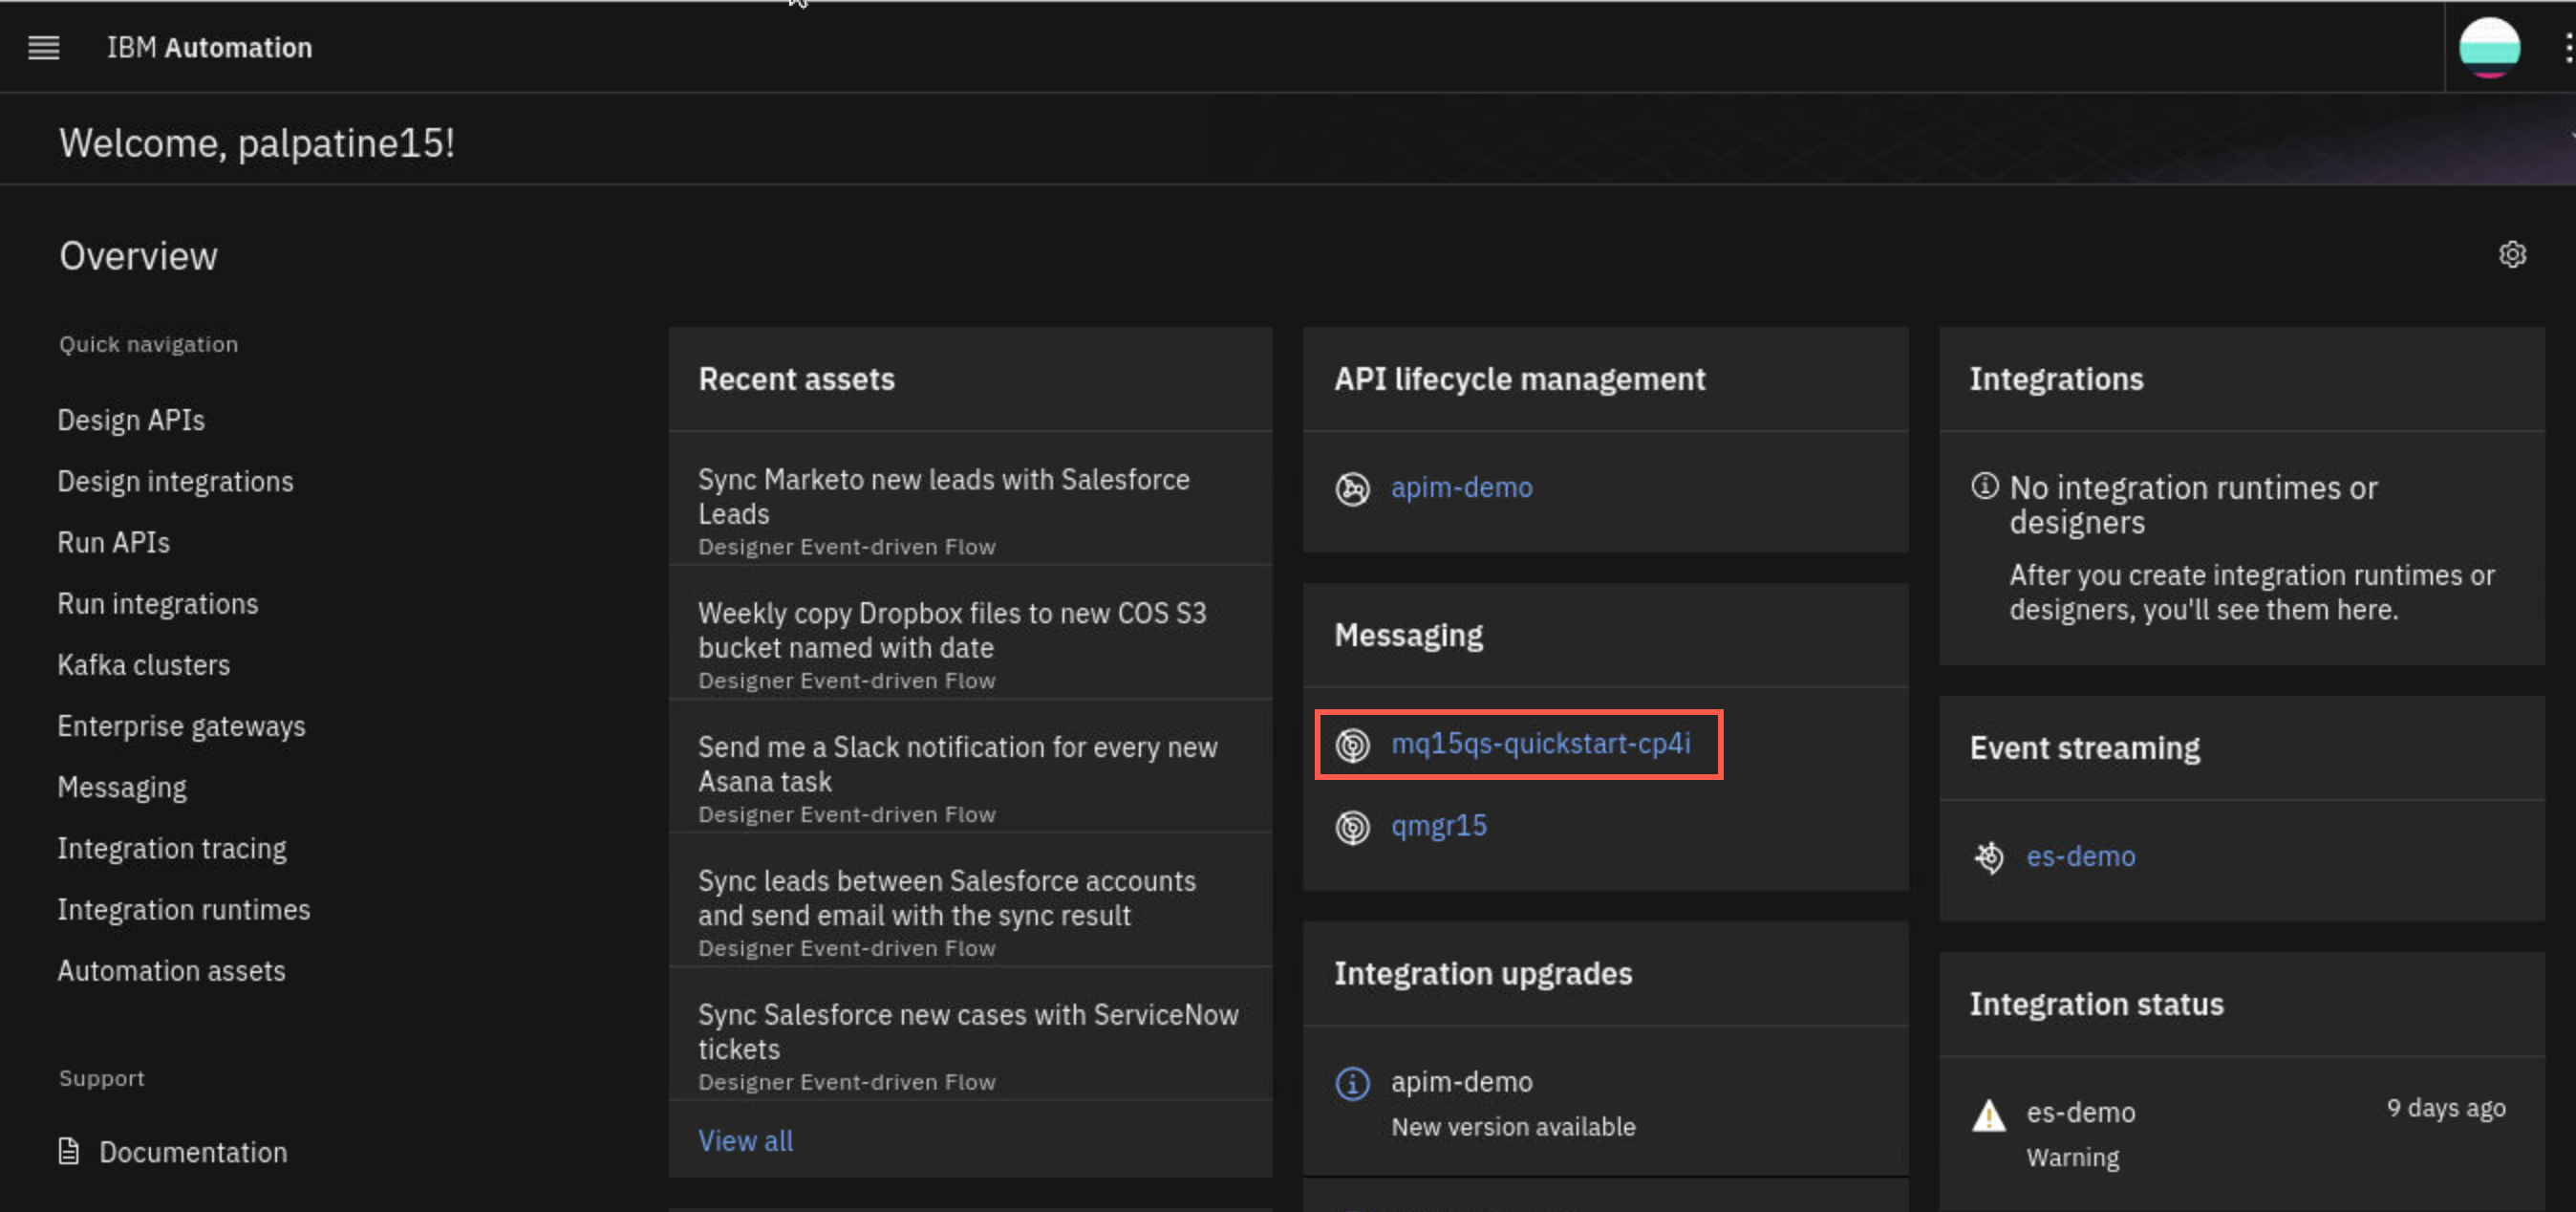
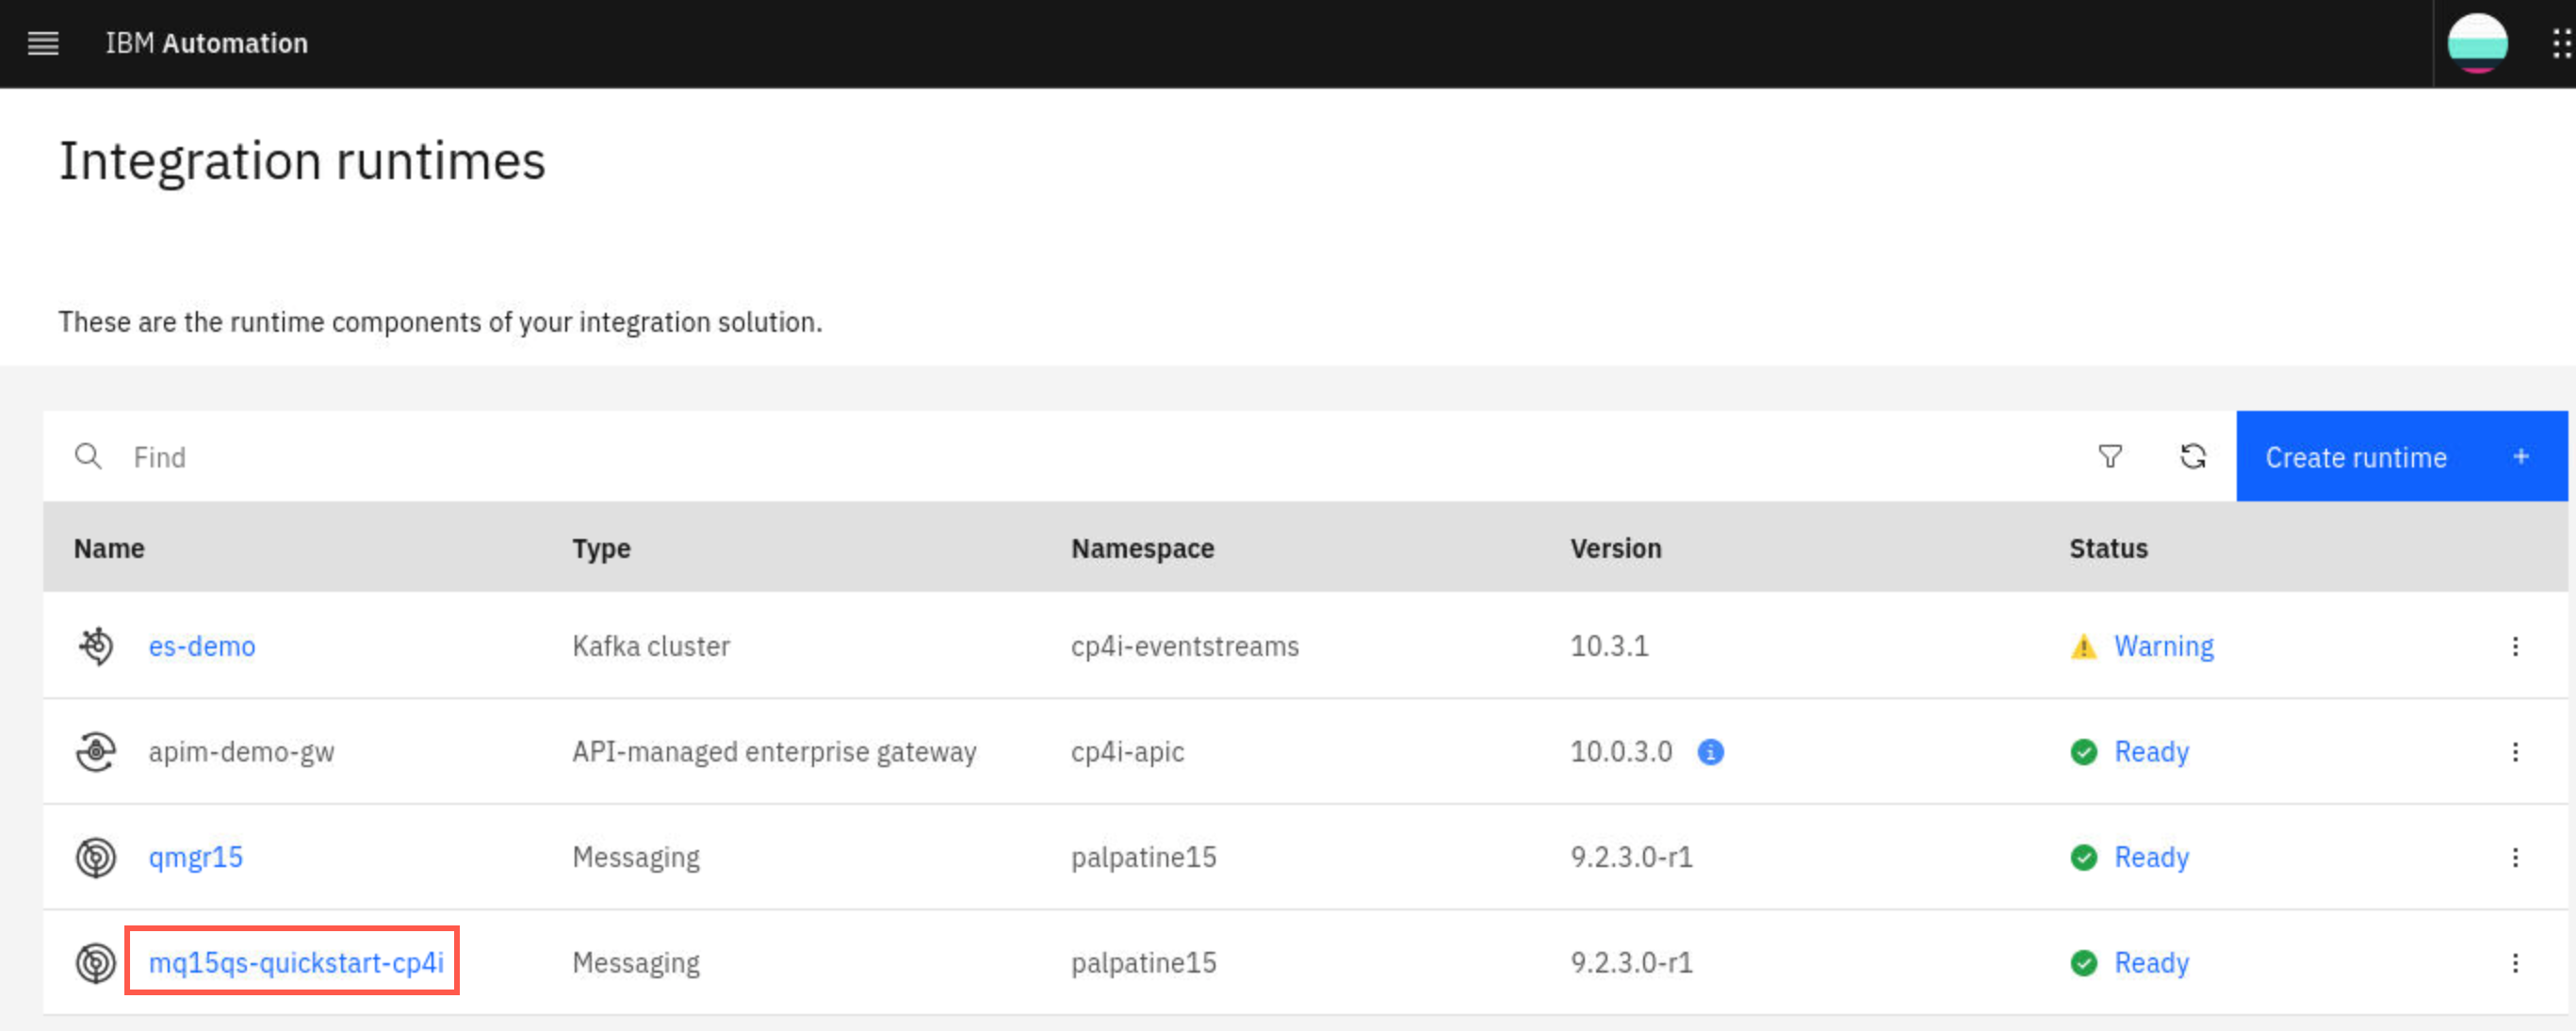
Under Integration Runtimes your queue manager now shows a Ready status, you can now click the hyperlink to open the MQ console for your queue manager. The runtime instance shows mqxx-quickstart-cp4i, but that is not your queue manager name. You named it mqxxqs.
If you receive a potential security risk warning. Click Advanced then Accept the risk as you did before.
The MQ Console looks nothing like MQ Explorer. It doesn’t even look like earlier versions of MQ Console. Feel free to poke around (or click around) and explore the various tiles and side bar menus. When you are ready, continue to the next step - creating a queue.
-
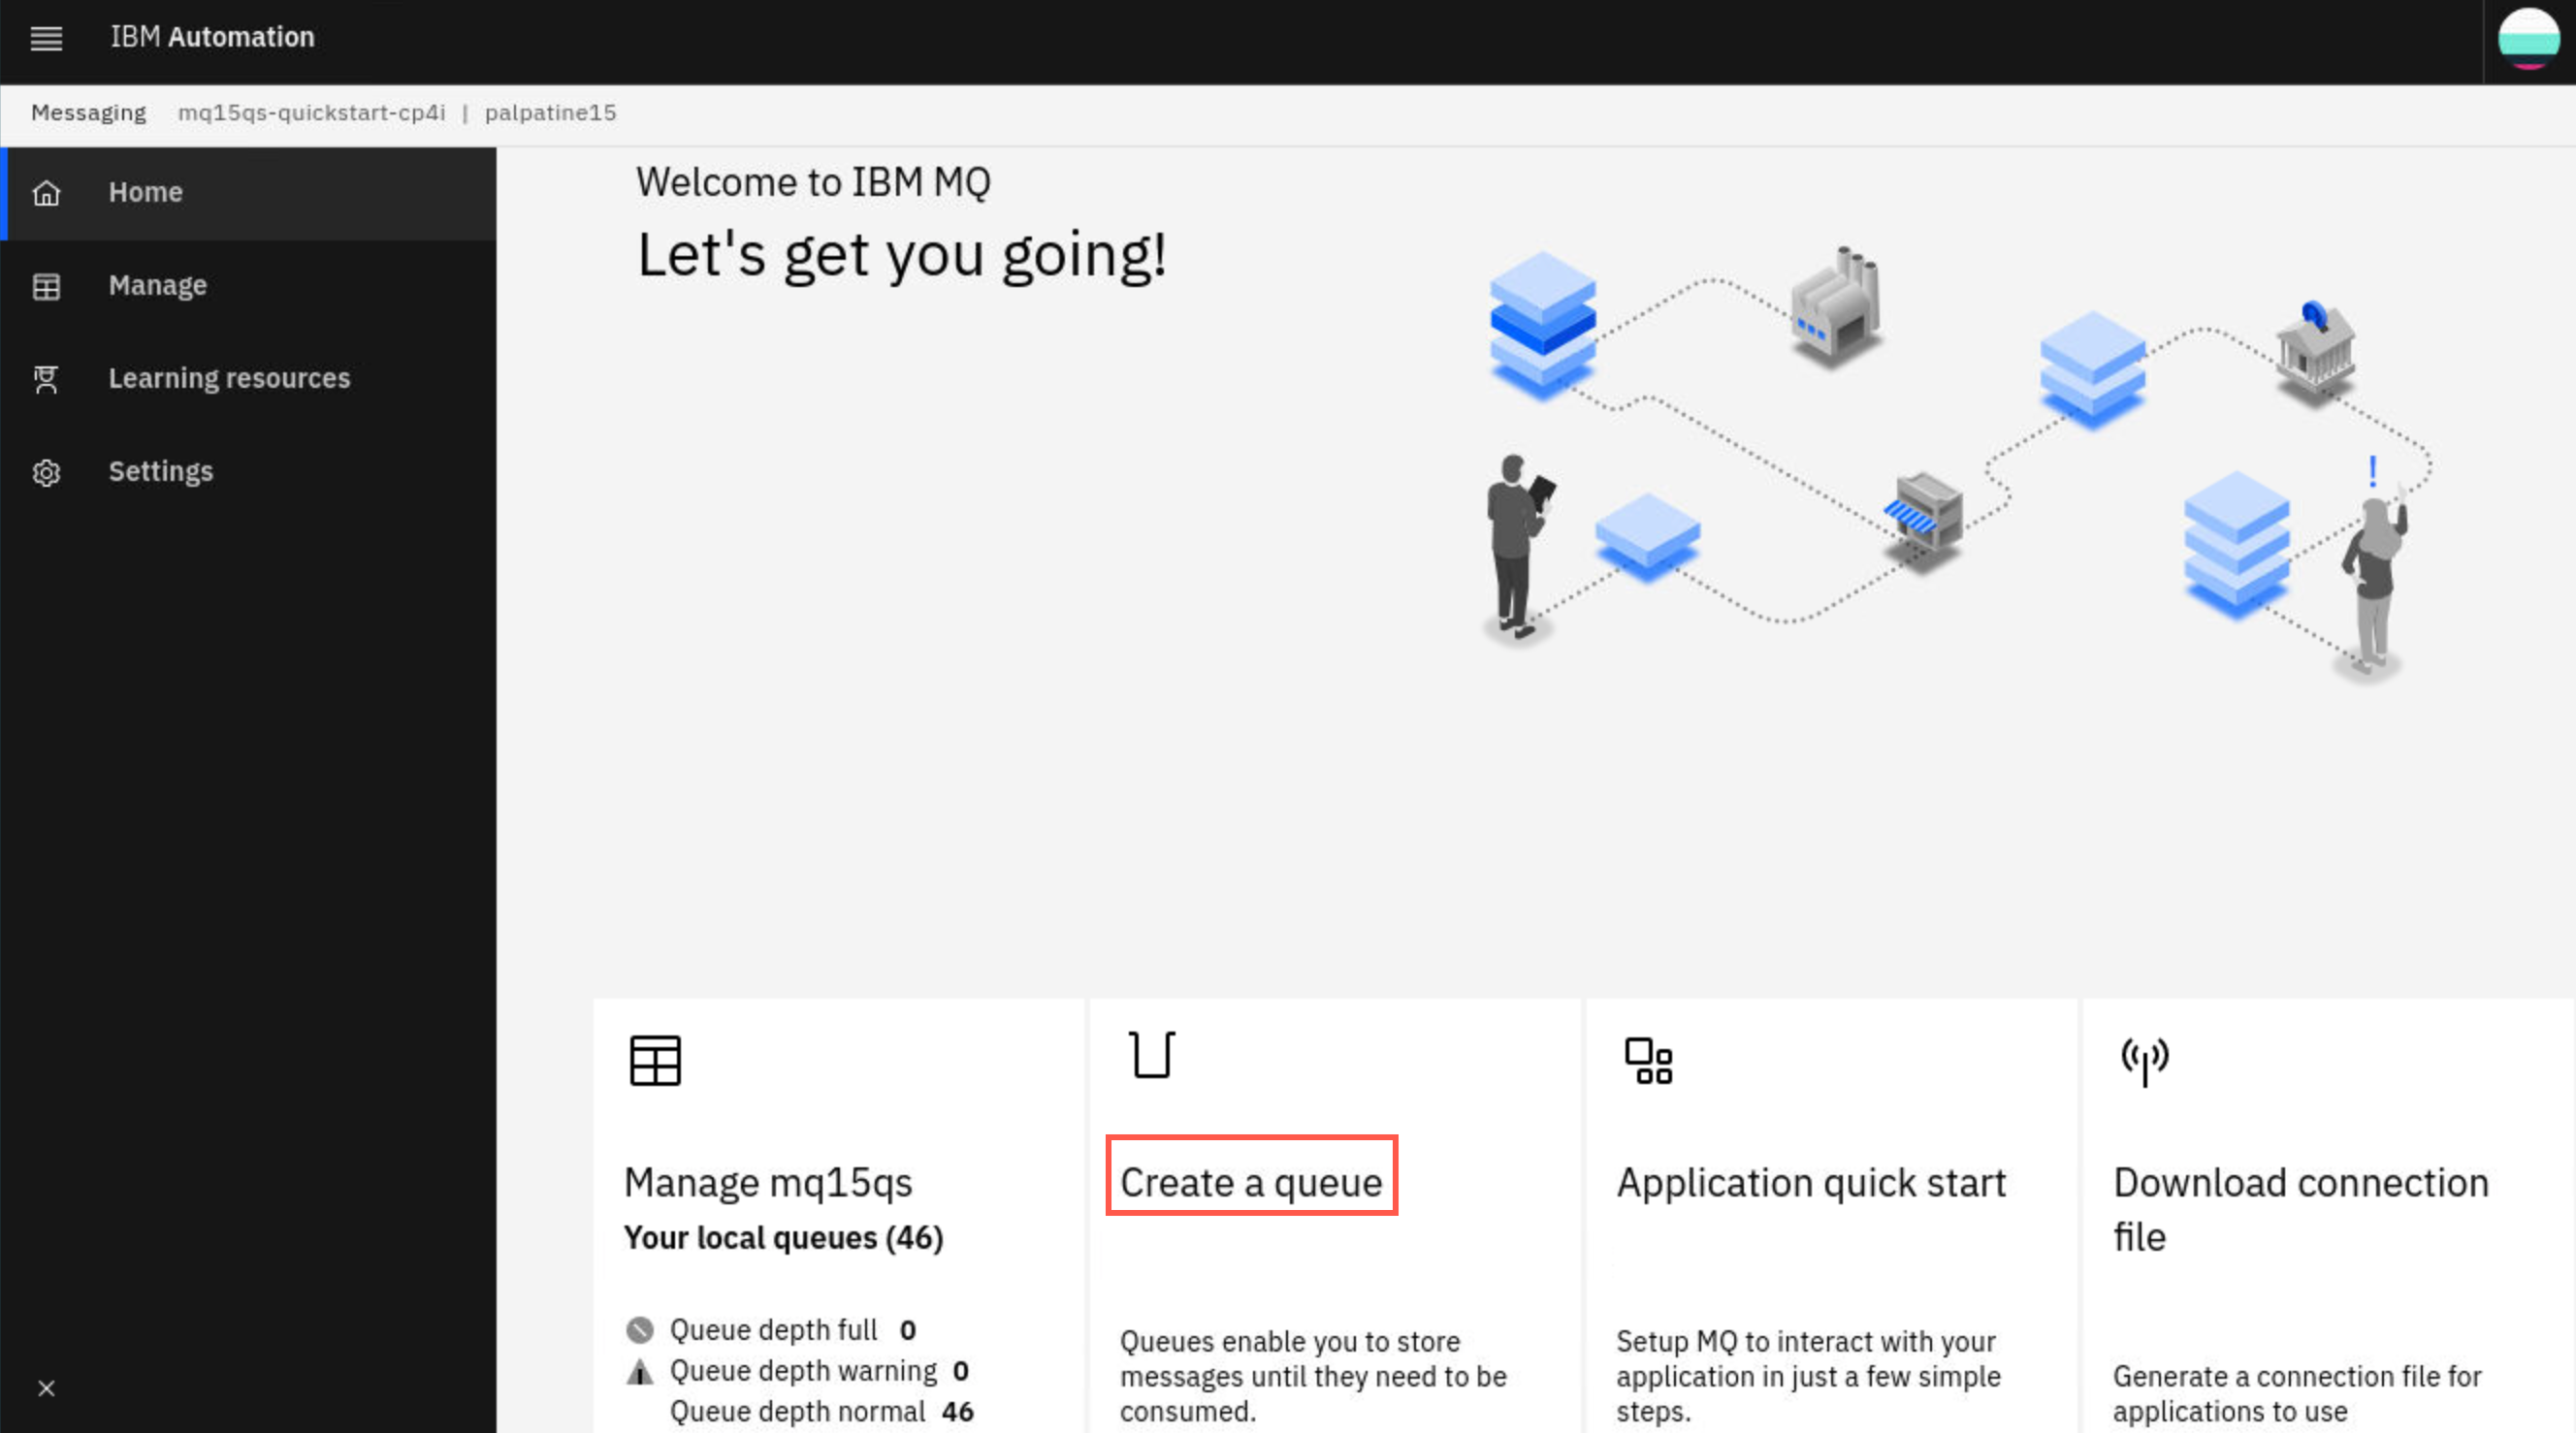
Click the Create a queue tile.
-
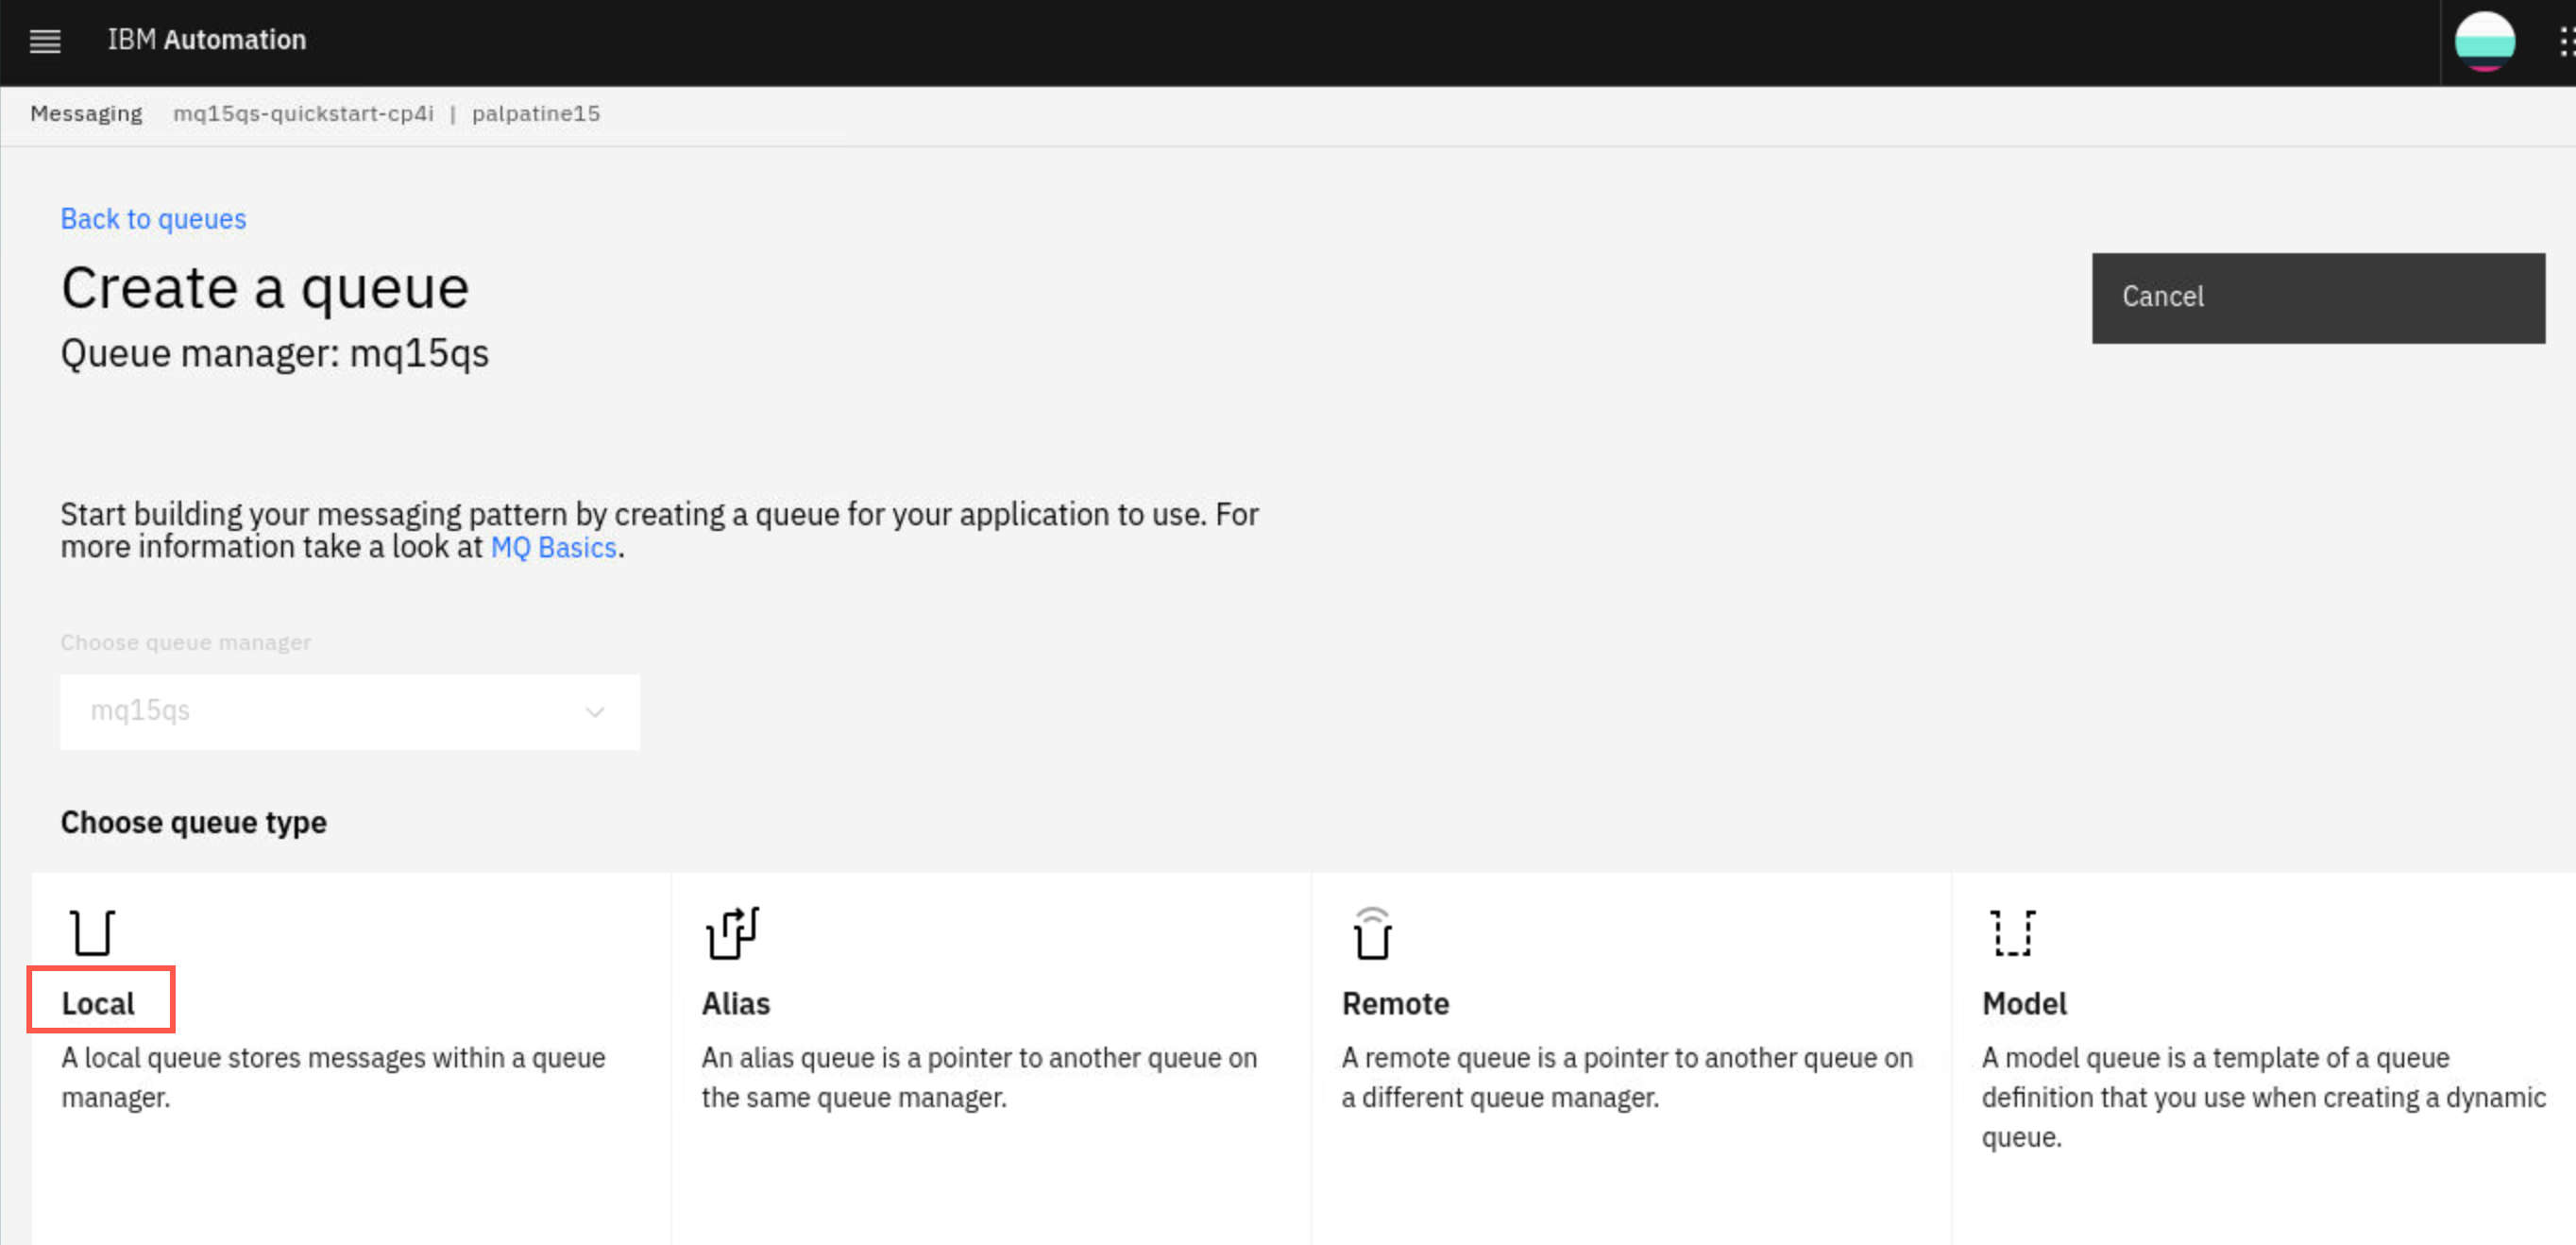
A number of tiles are displayed for the different queue types. Behind each tile are the properties for that particular queue type. Click the tile for a Local queue.
-
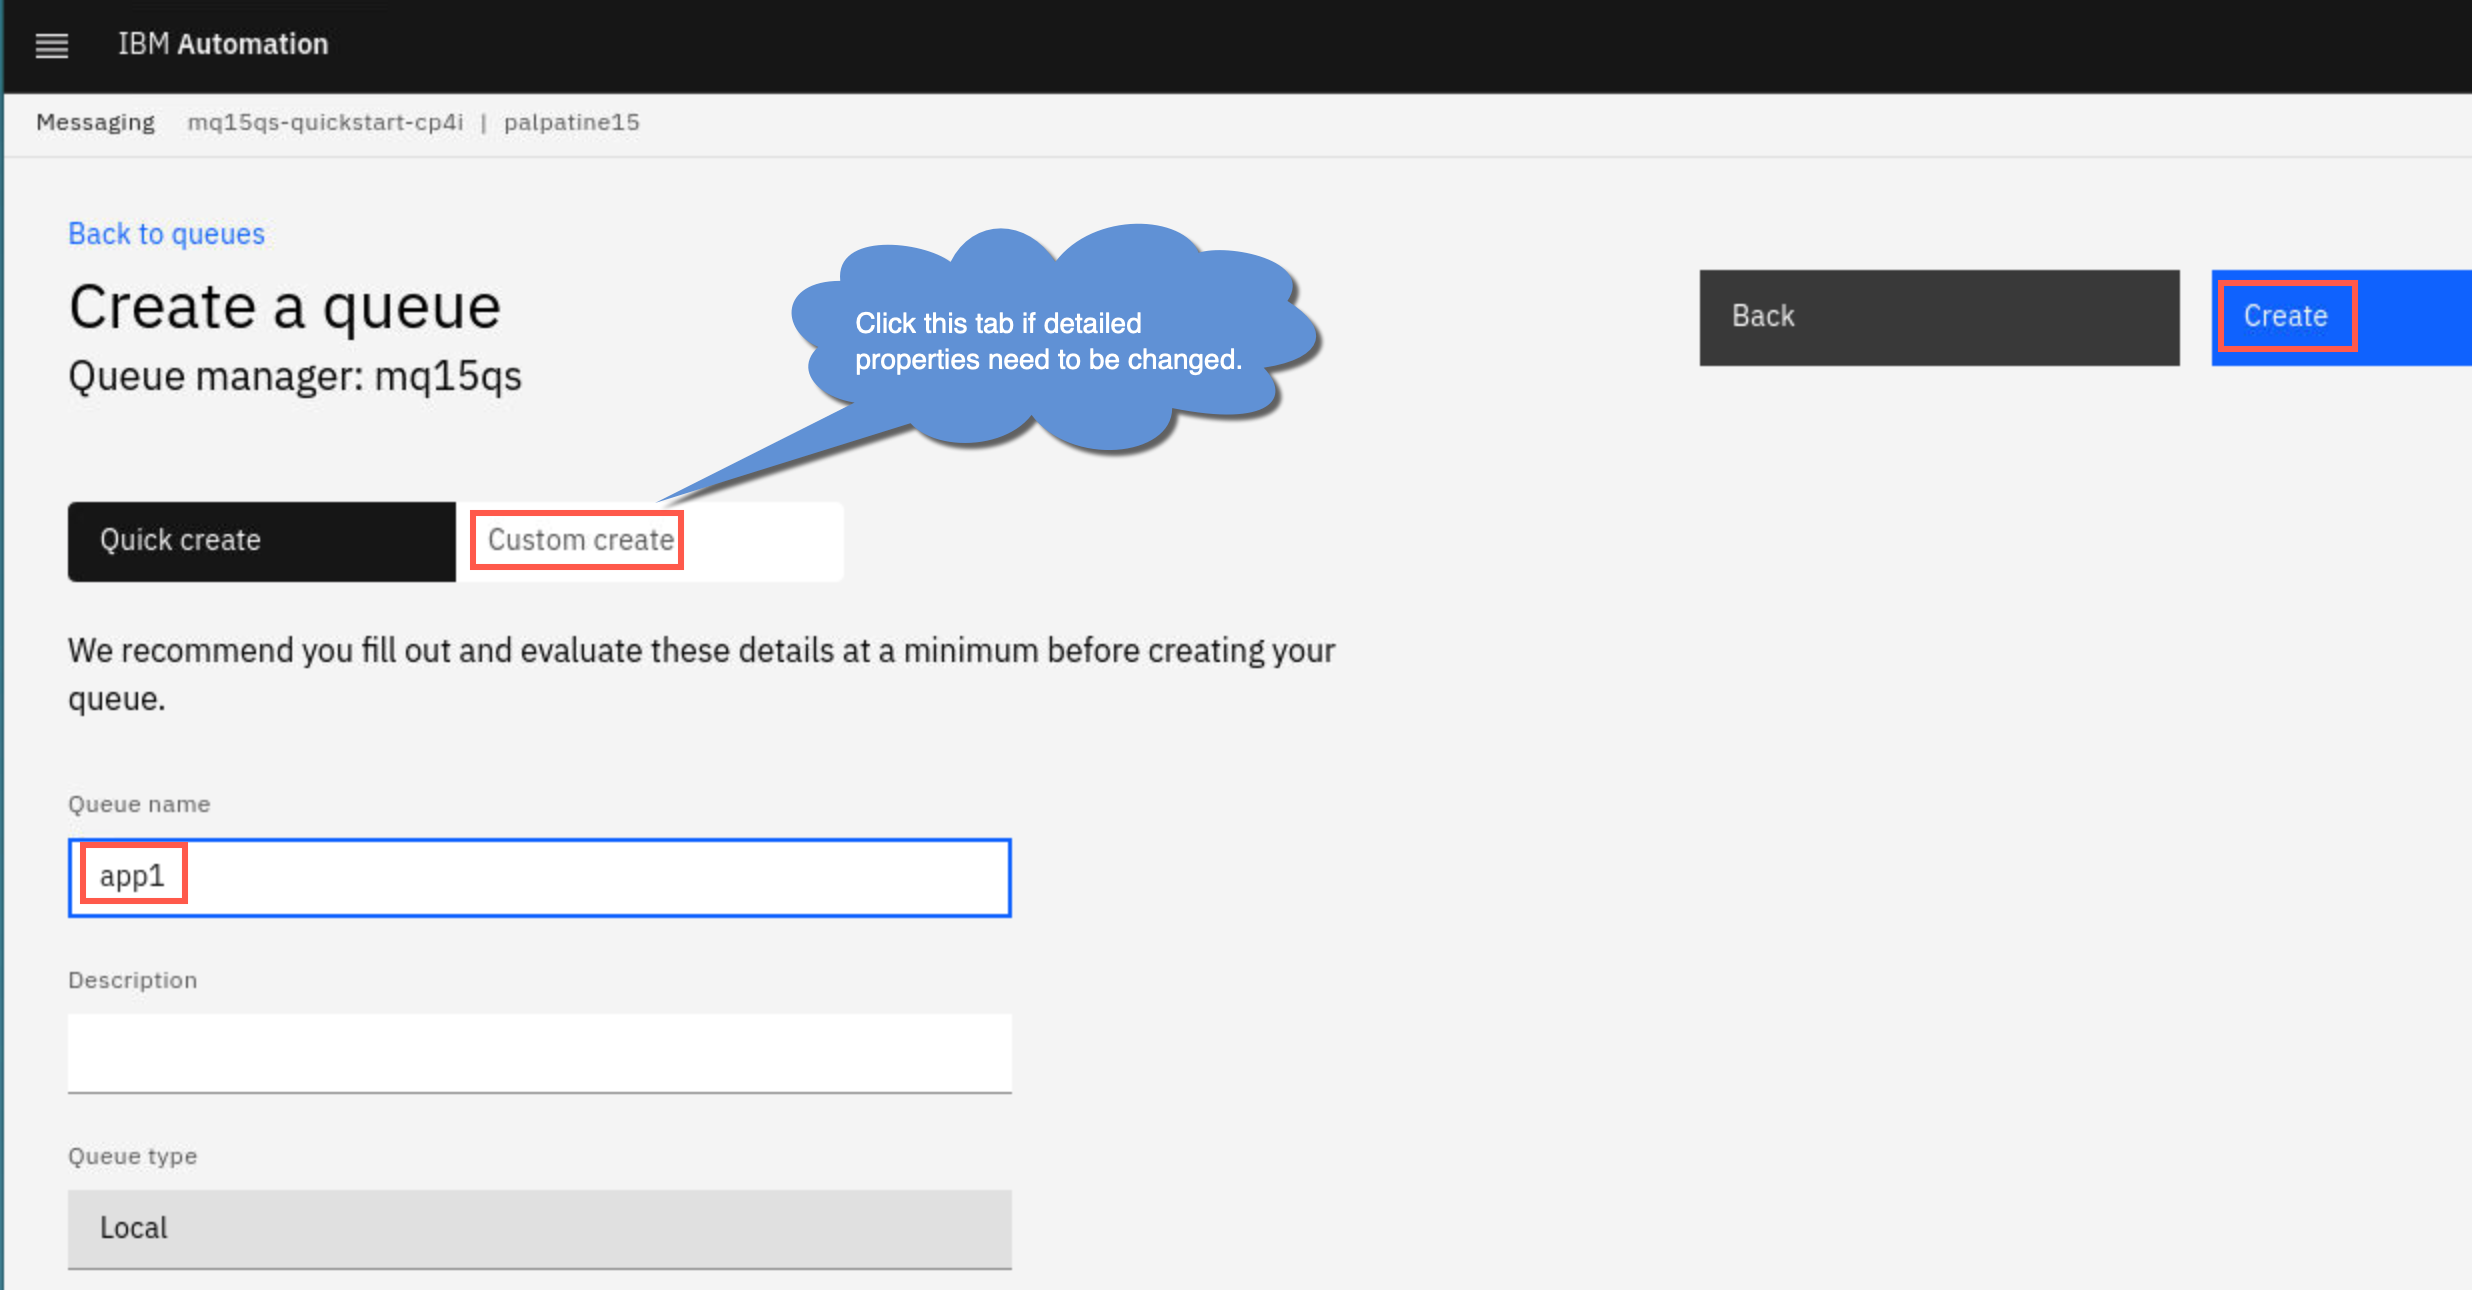
Only the required basic options are displayed with the required field Queue name. If you need to alter or just want to see all available options, you can click the Custom create tab. For now, just enter the name for the test queue app1 and click Create.
-
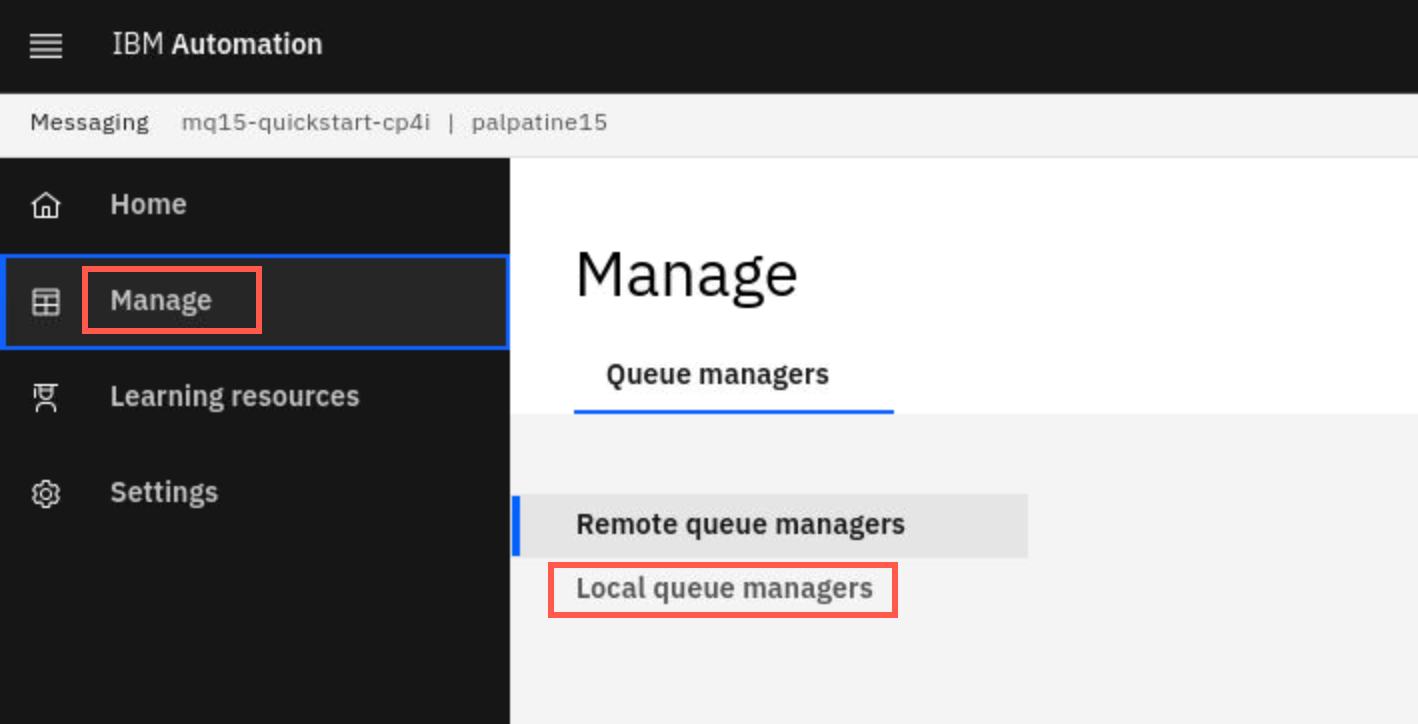
An MQ channel needs to be defined for communication into MQ. Click the Manage option. Then select local queue managers.
-
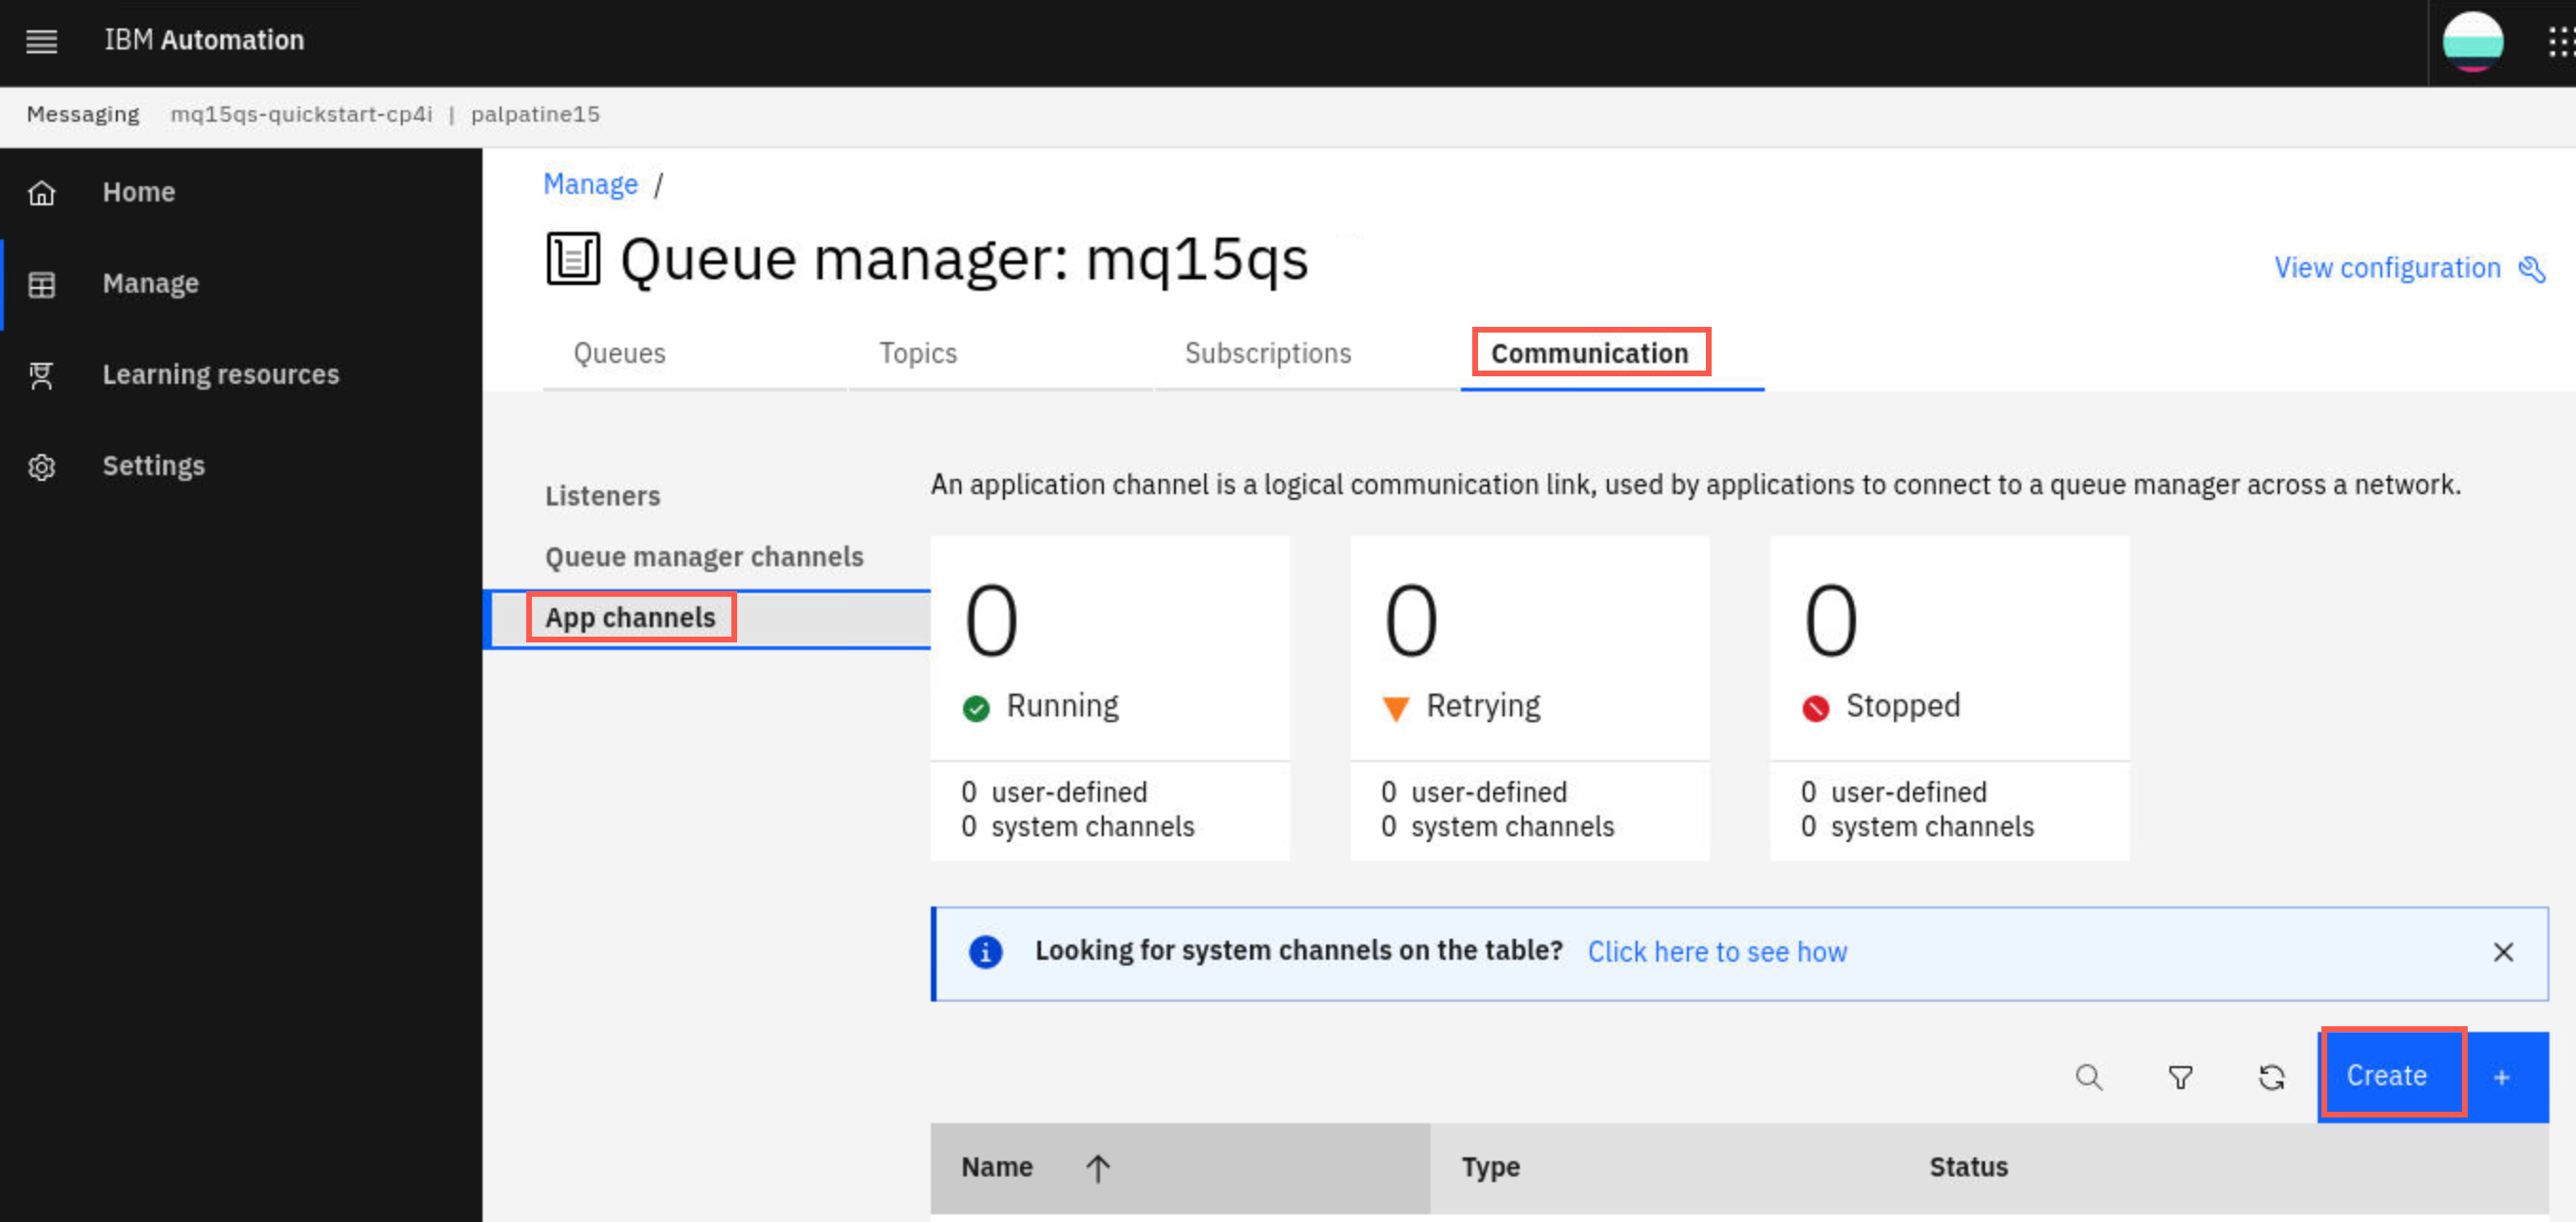
Select the Communication tab, click App channels, then click Create +.
-
Read the definition, then click Next.
-
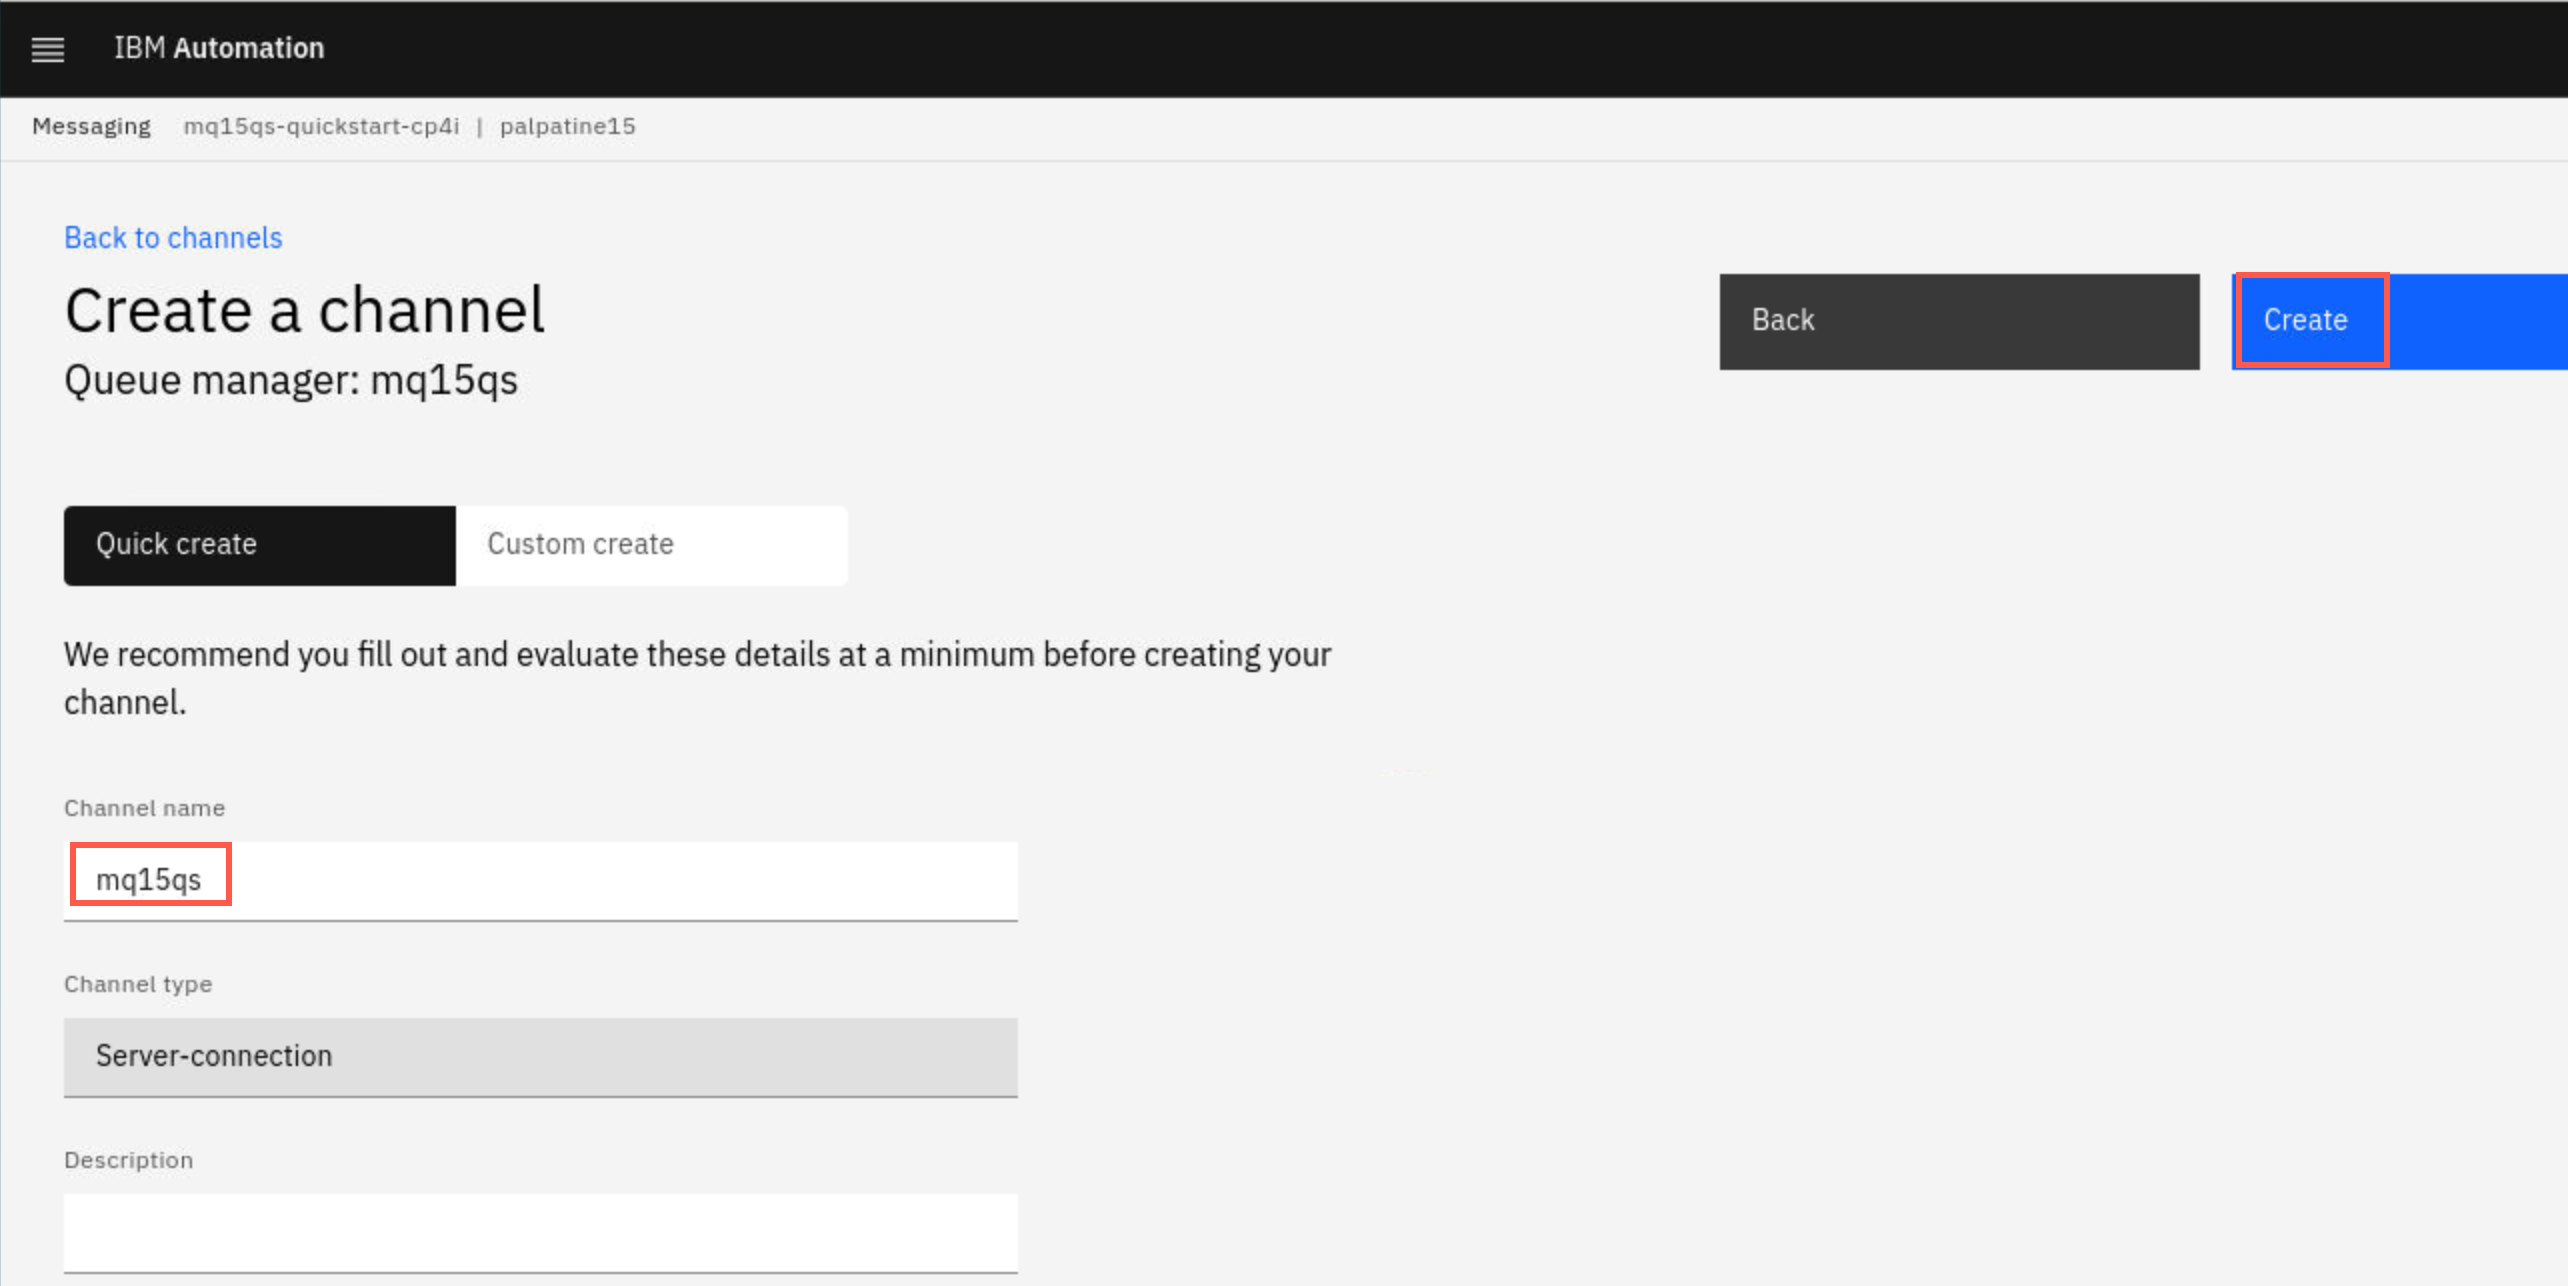
To keep it simple enter the name of your queue manager (mq00qs for the instructor) so that the channel name matches the queue manager name. Custom create tab lets you provide detailed properties. Click Create.
-
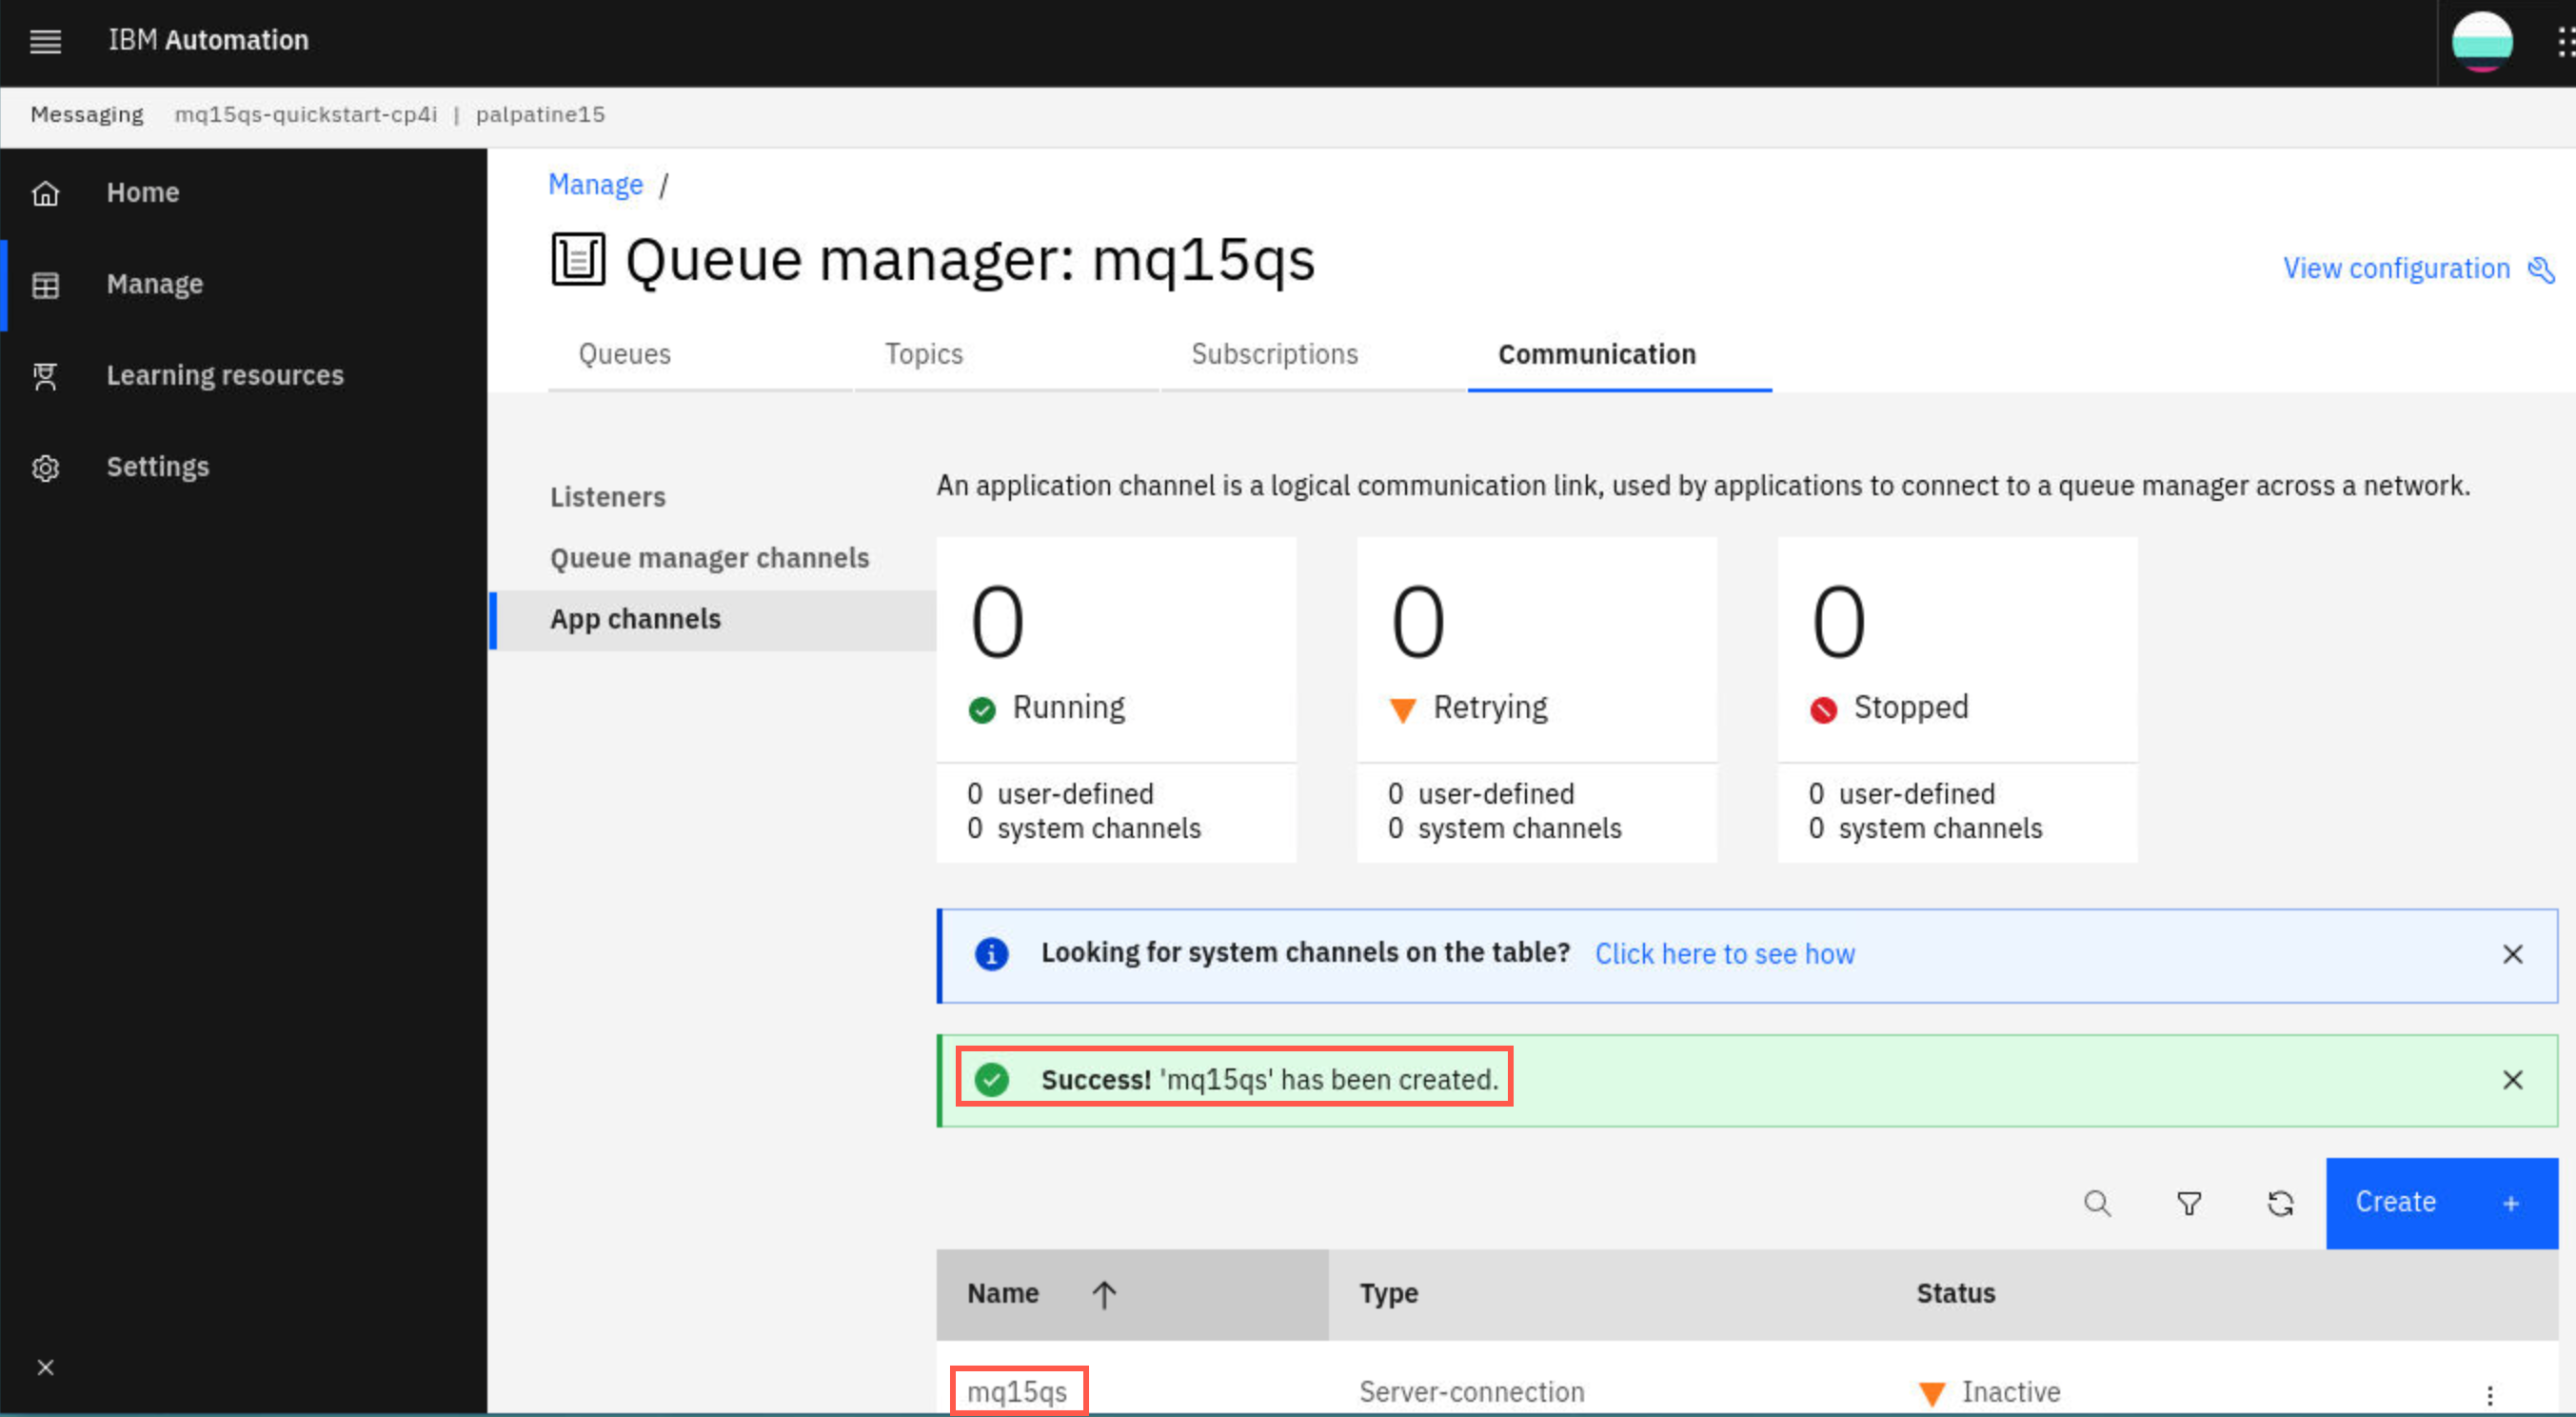
You receive a green success message and the channel appears in the list.
-
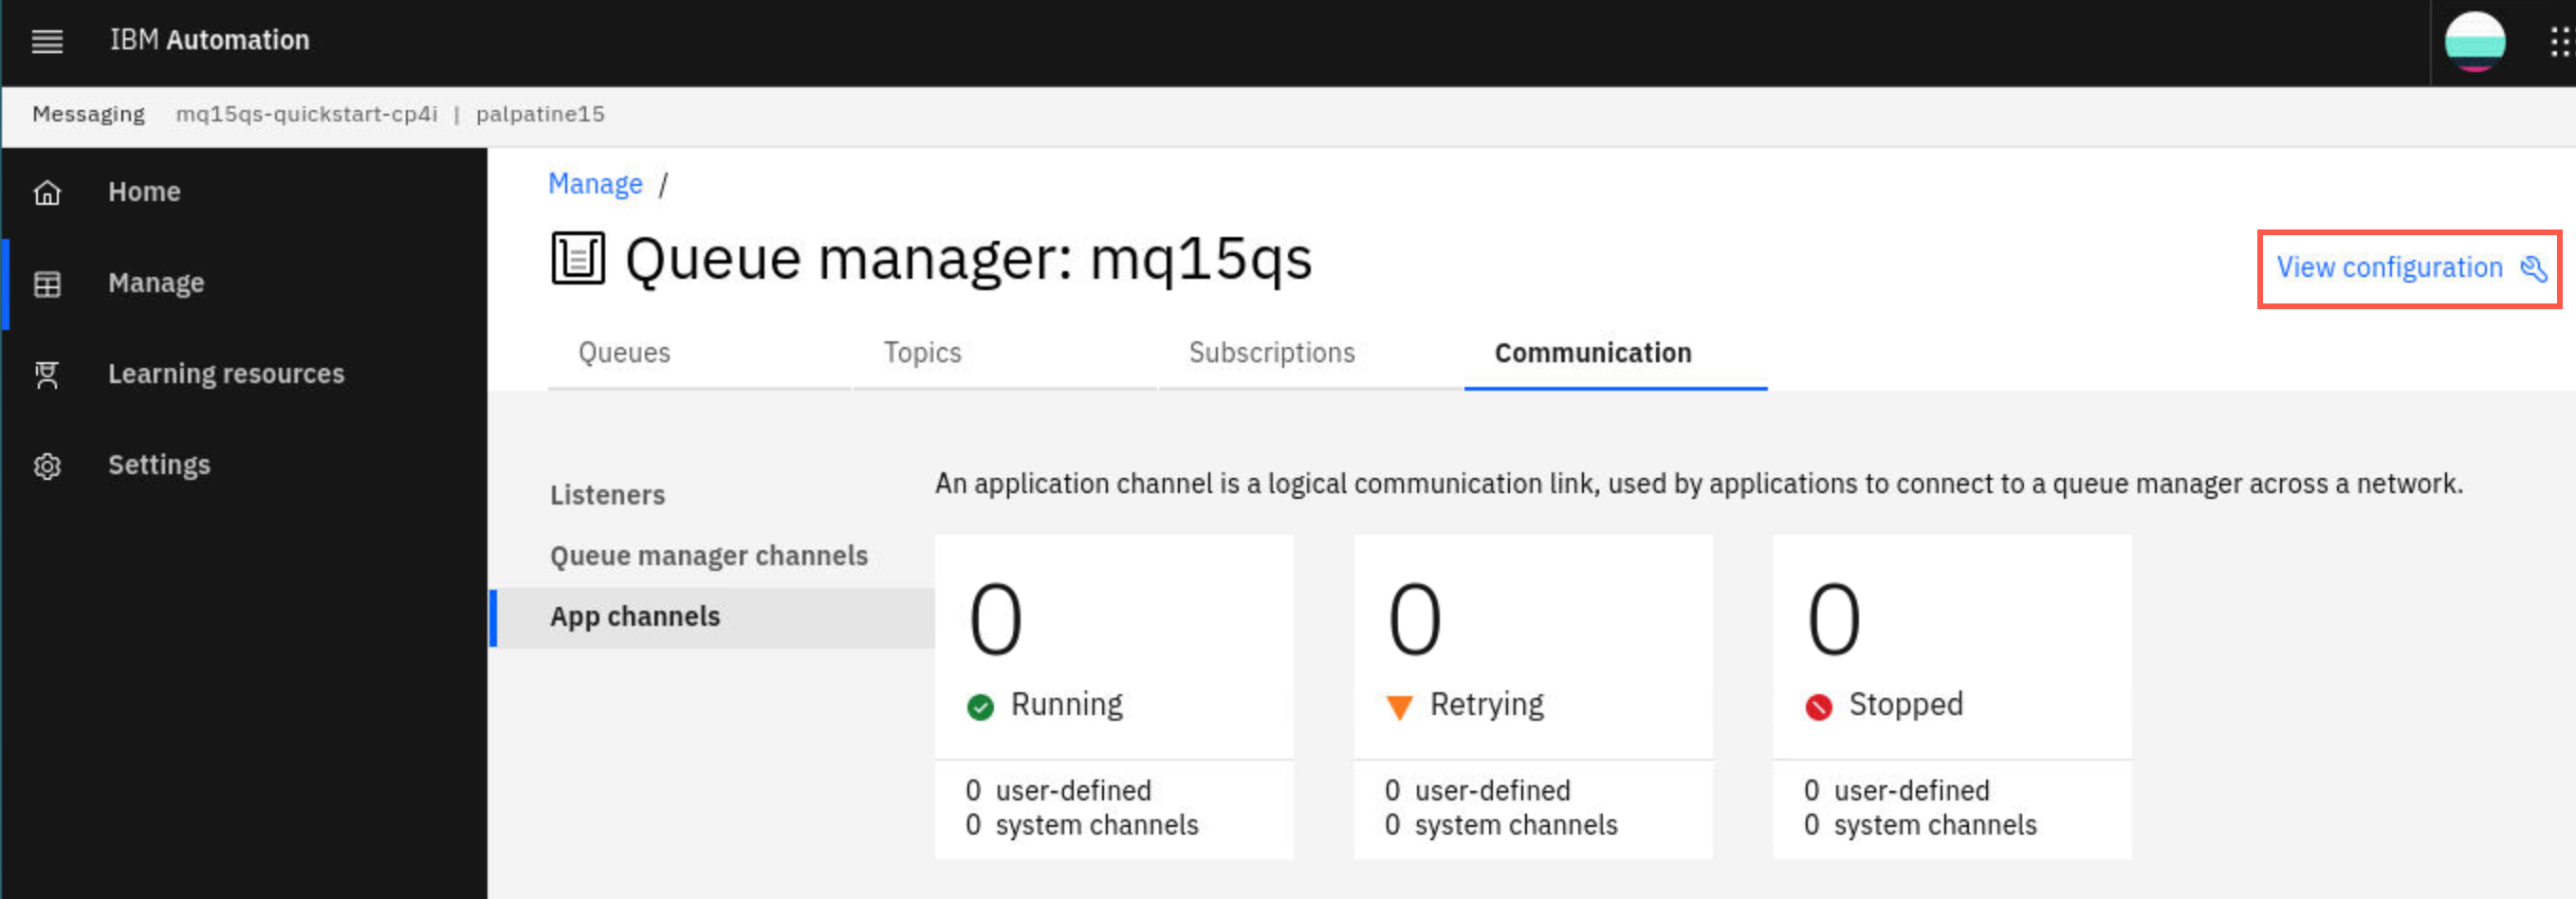
By default MQ is secure and will block all communication without explicit configuration. We will allow all communication for the newly created channel. Click on View Configuration in the top right corner:
-
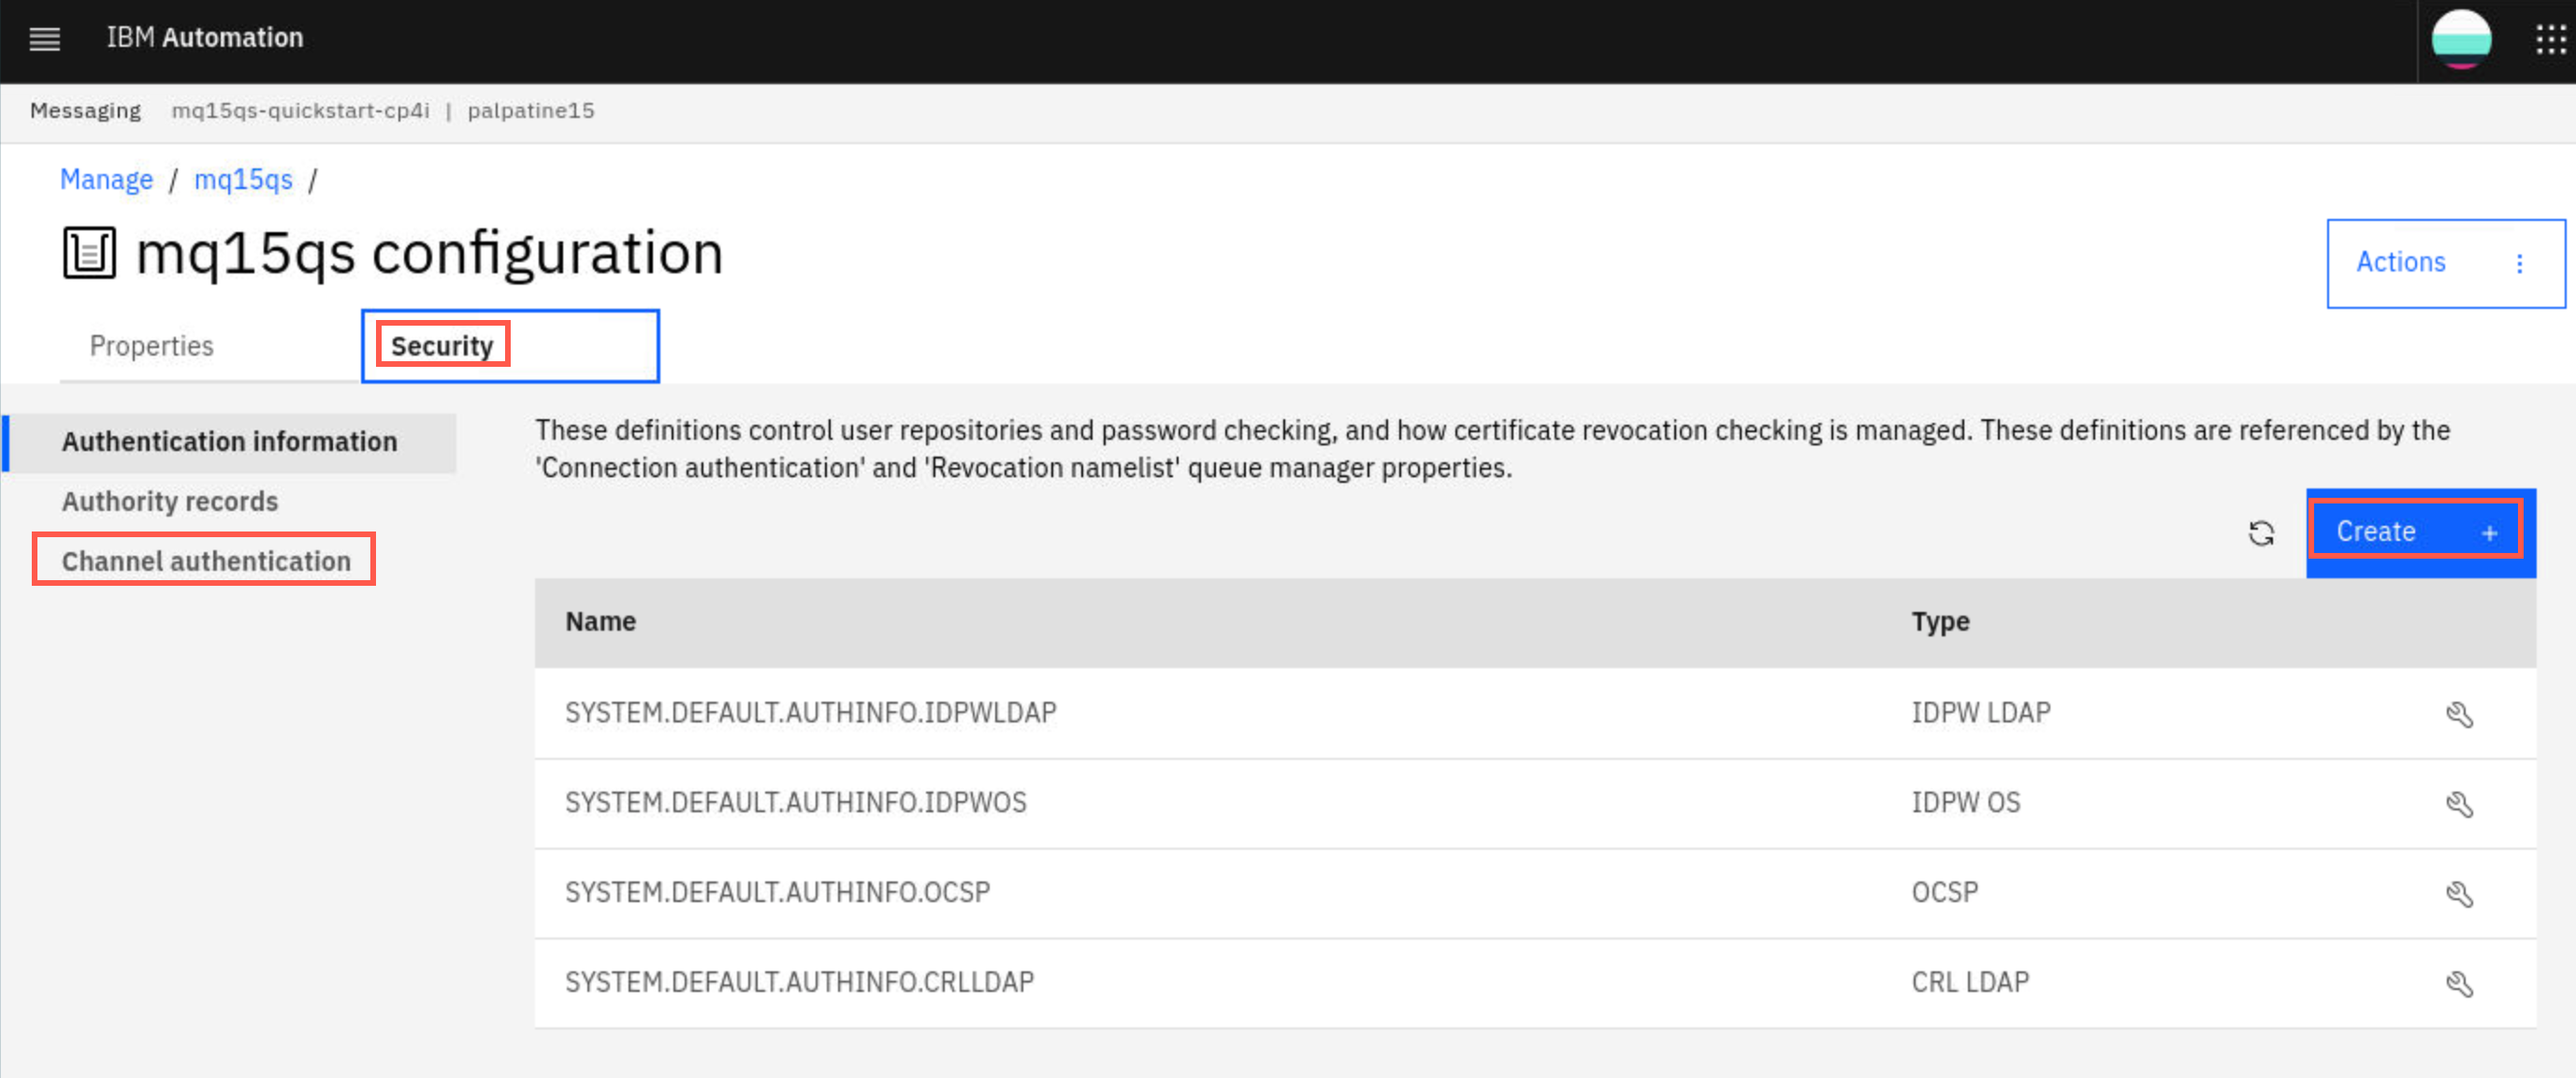
Click the Security tab, Channel authentication section, then click Create +.
-
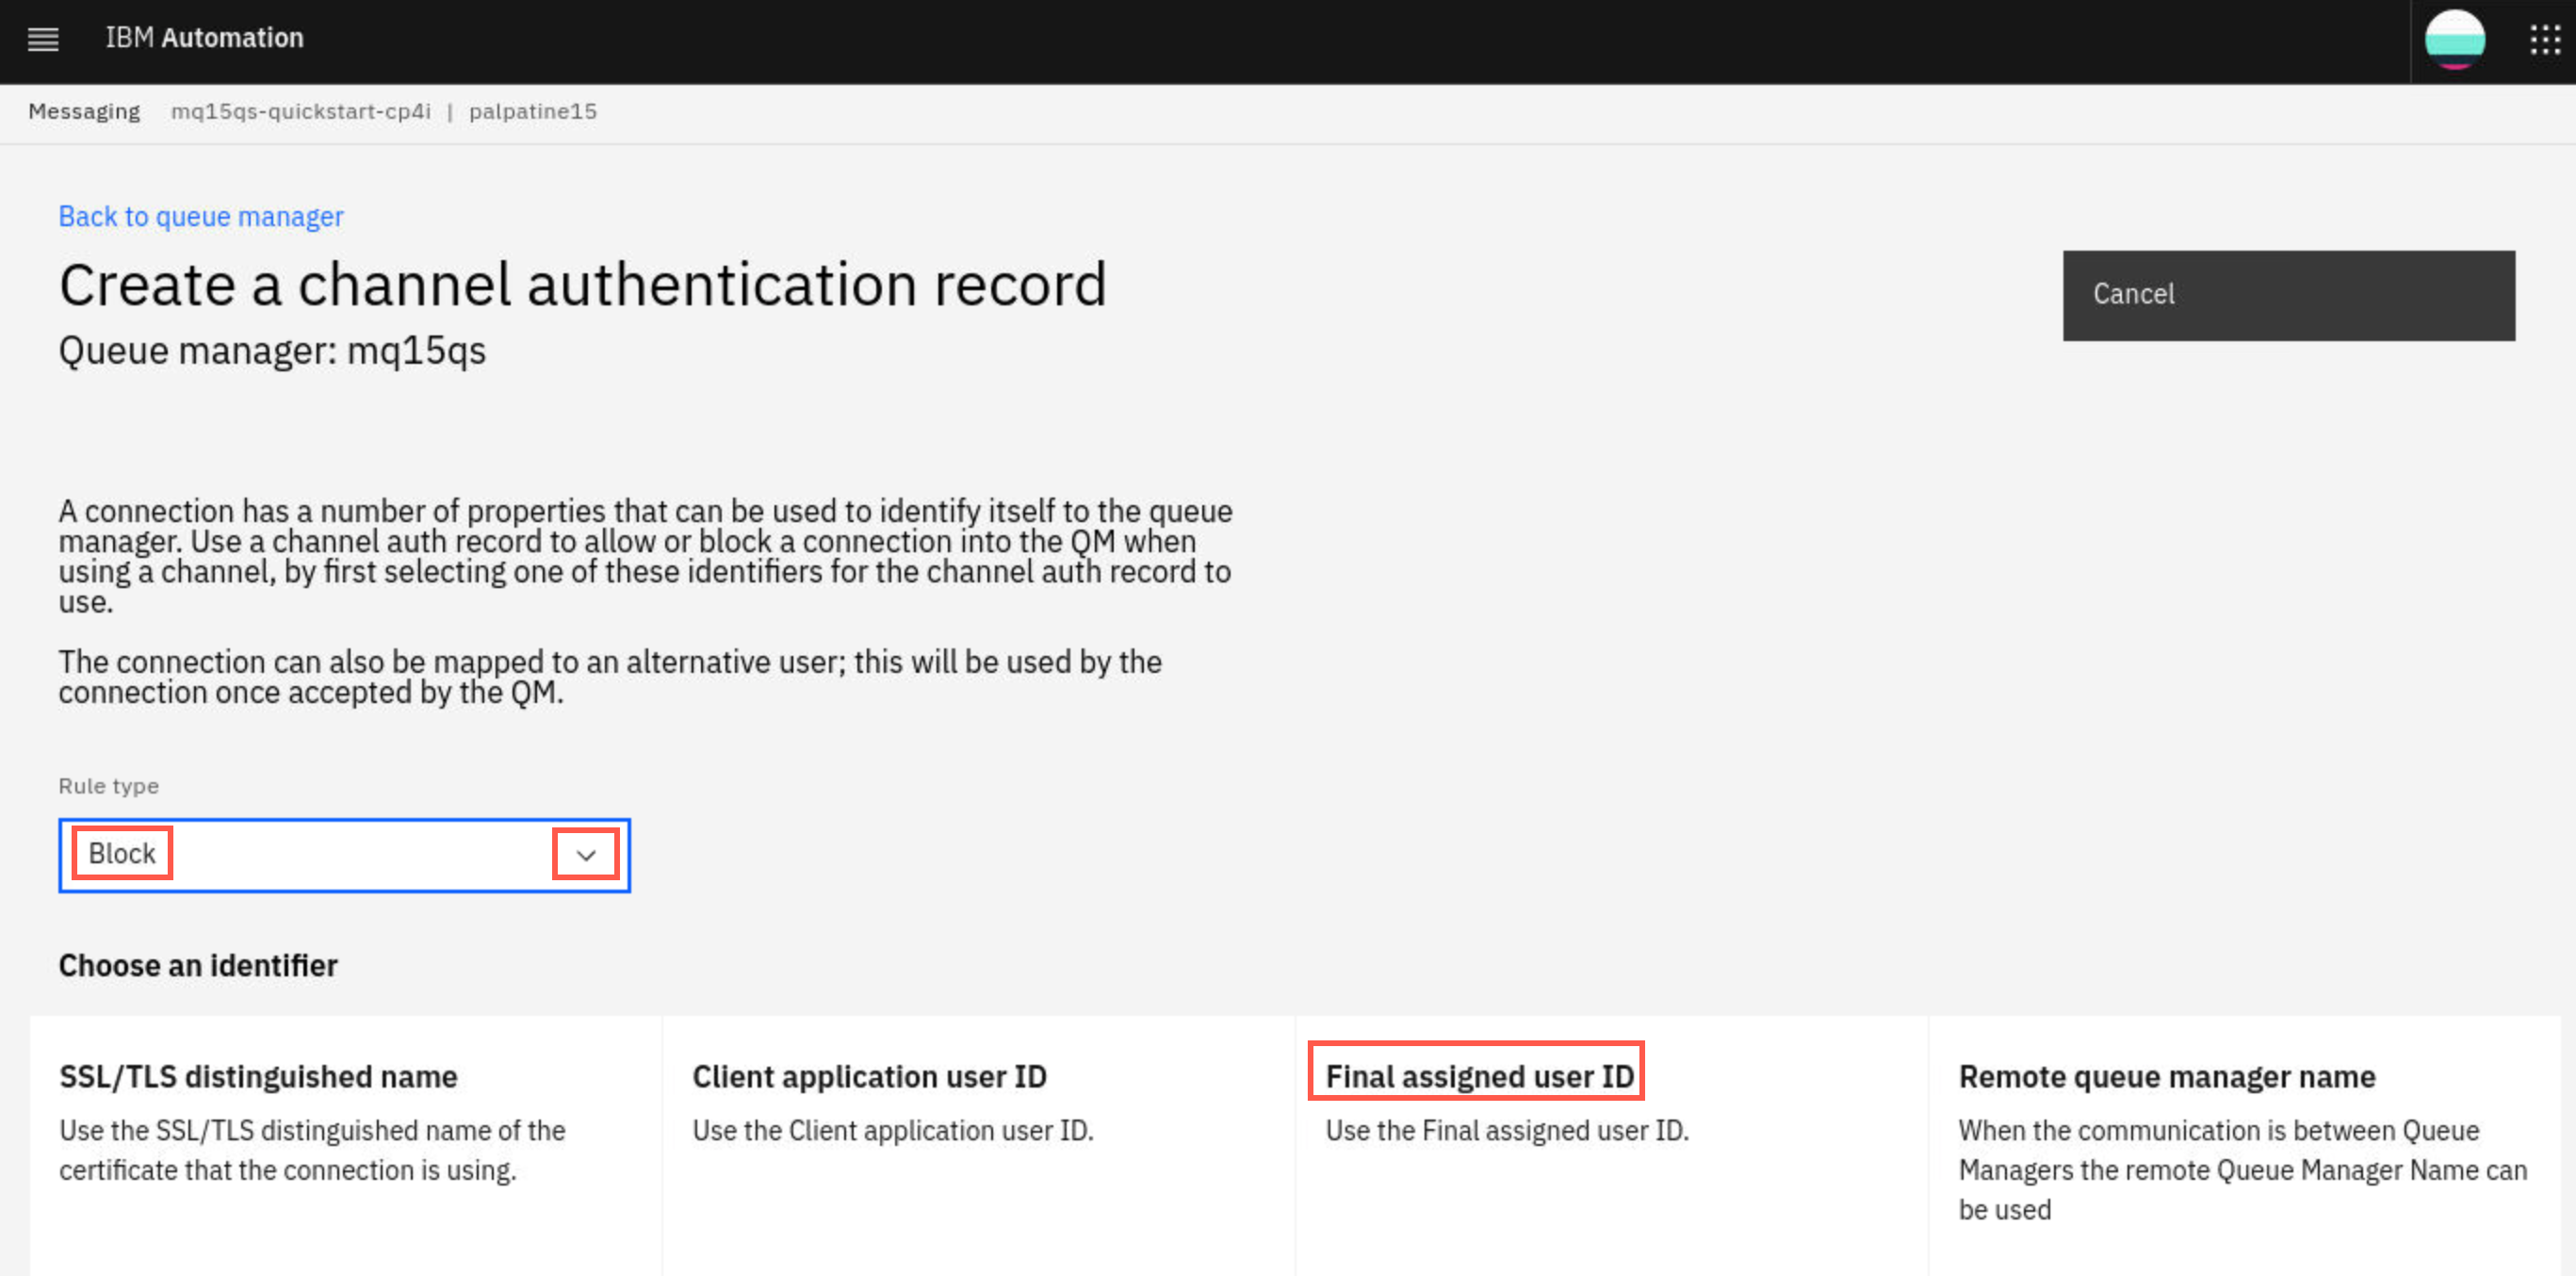
We will create a channel auth record that blocks nobody and allows everyone. Select Block from the pull down, and click the Final assigned user ID tile.
-
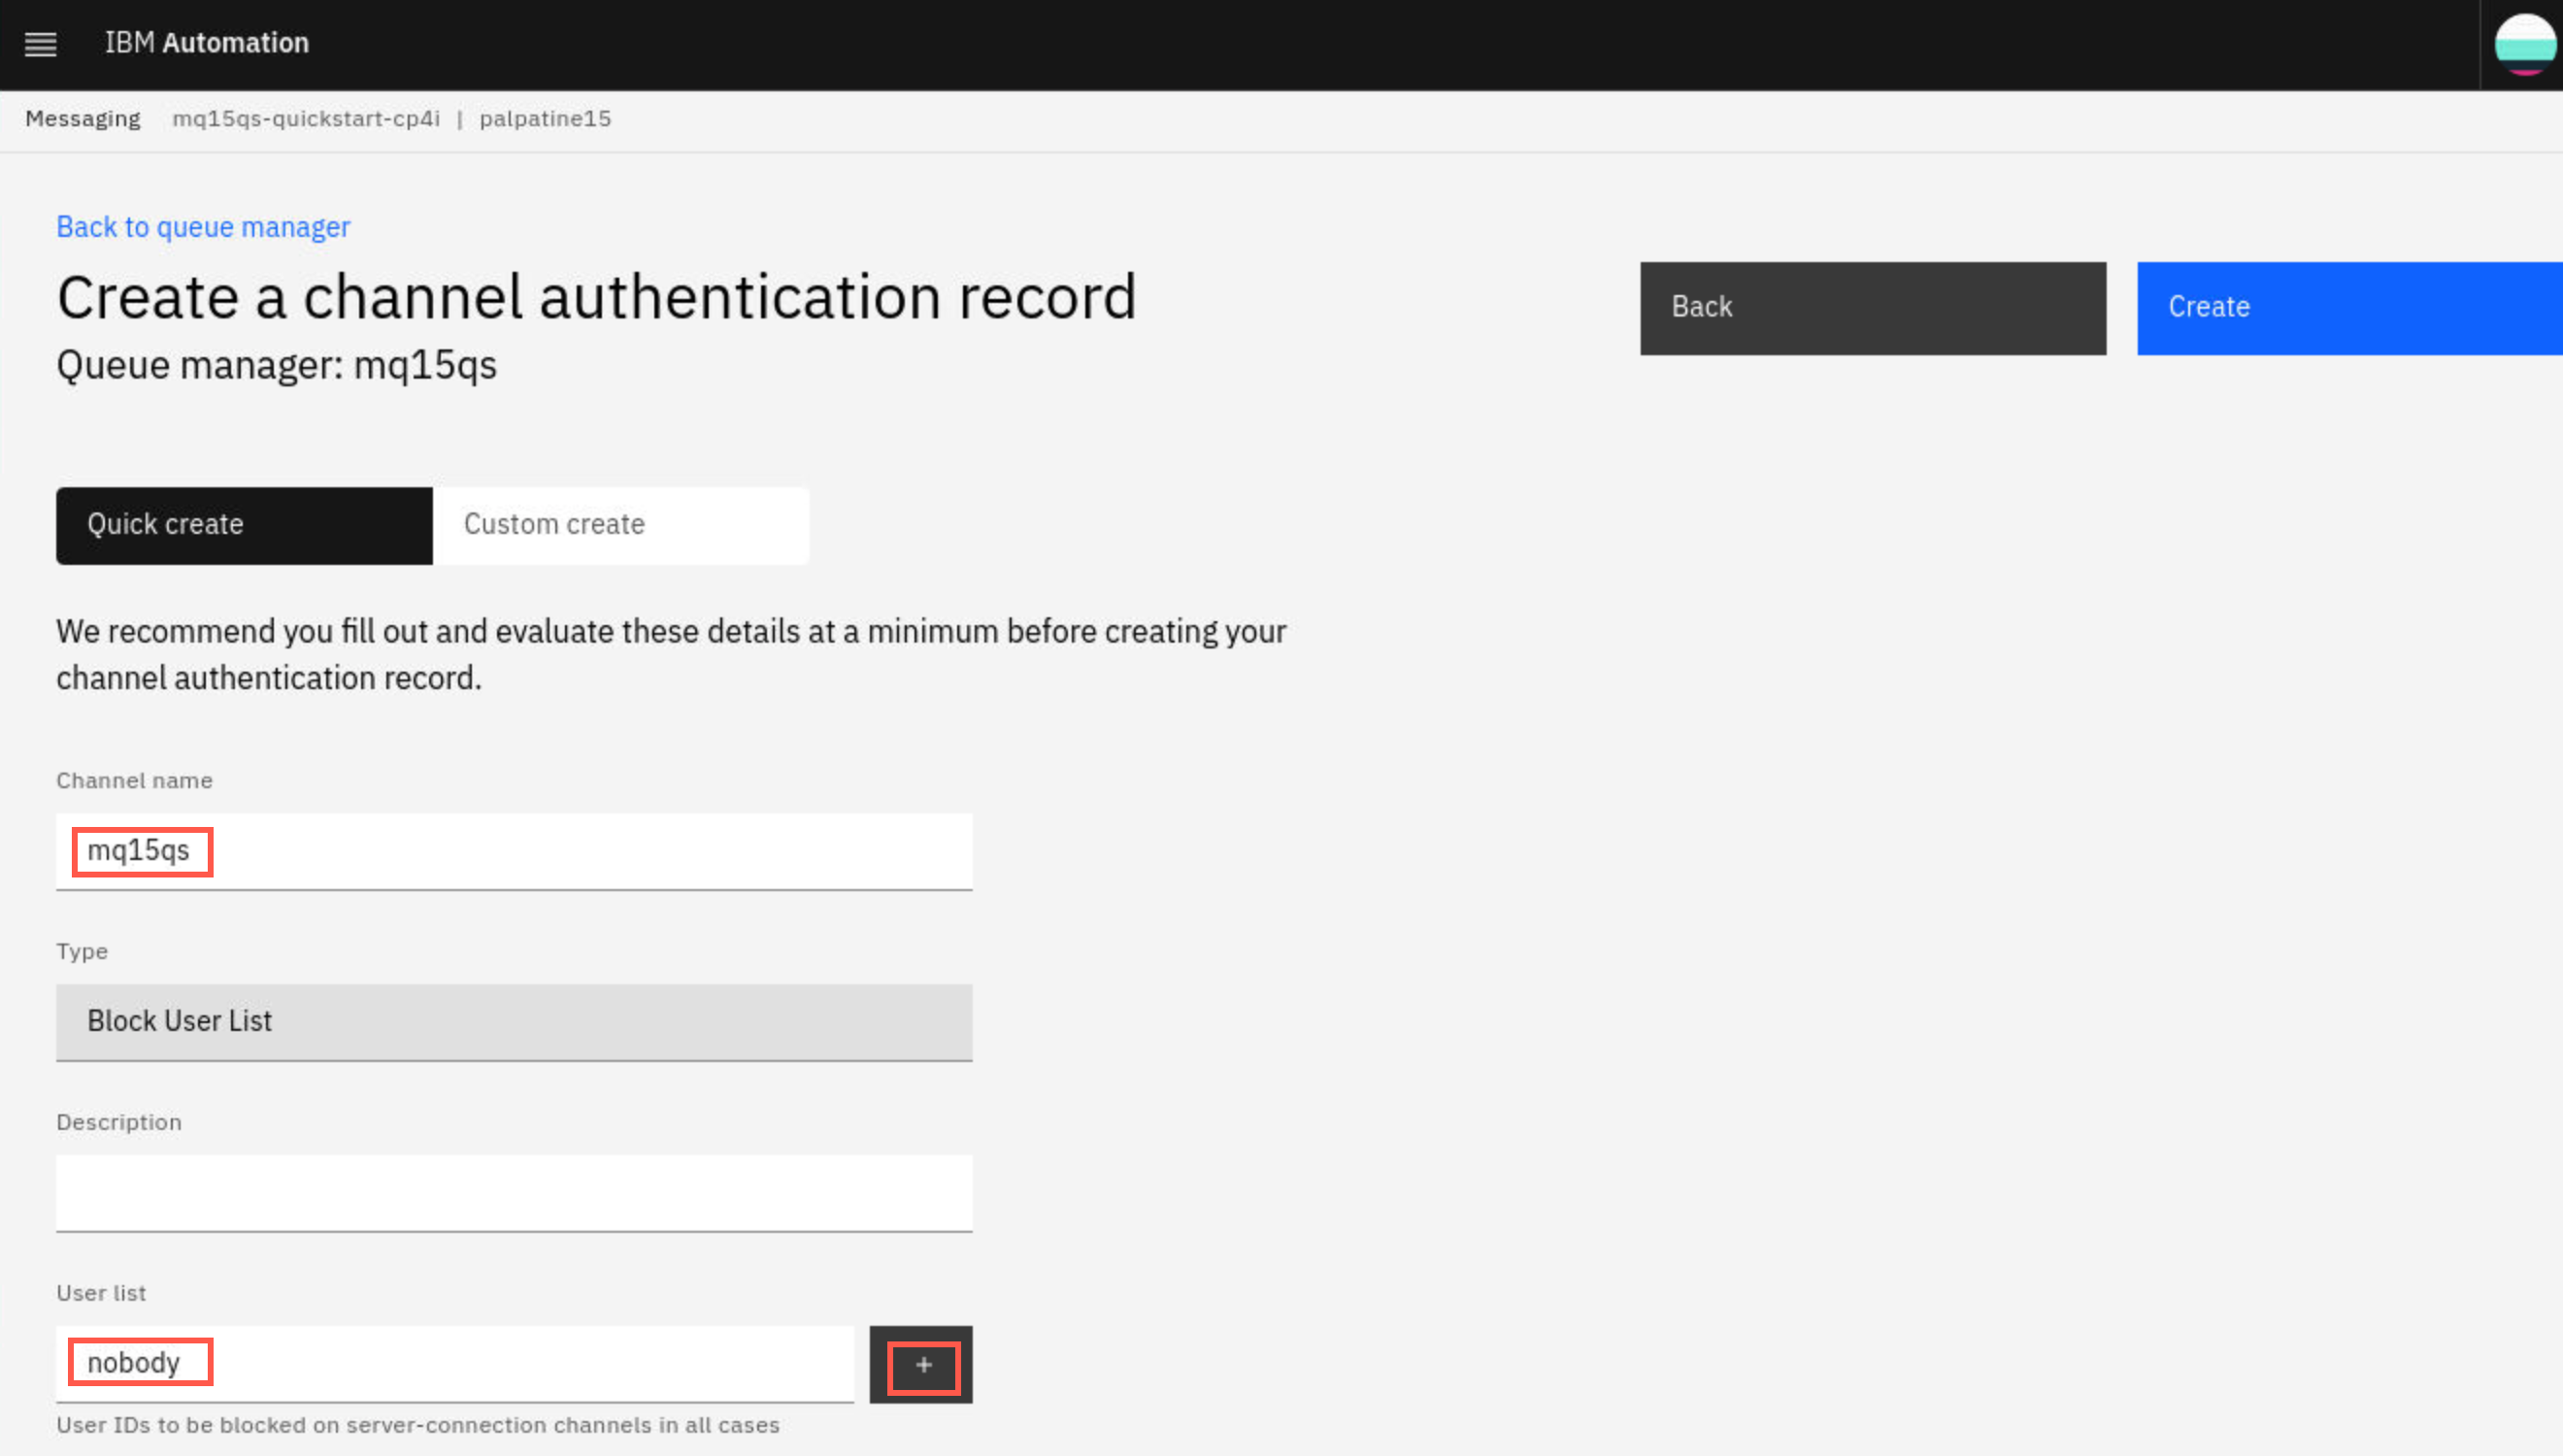
For Channel name enter the channel name you just created. Scroll down and type nobody in the User list field then click the “+” sign to add it.
-
Click Create to add the record.
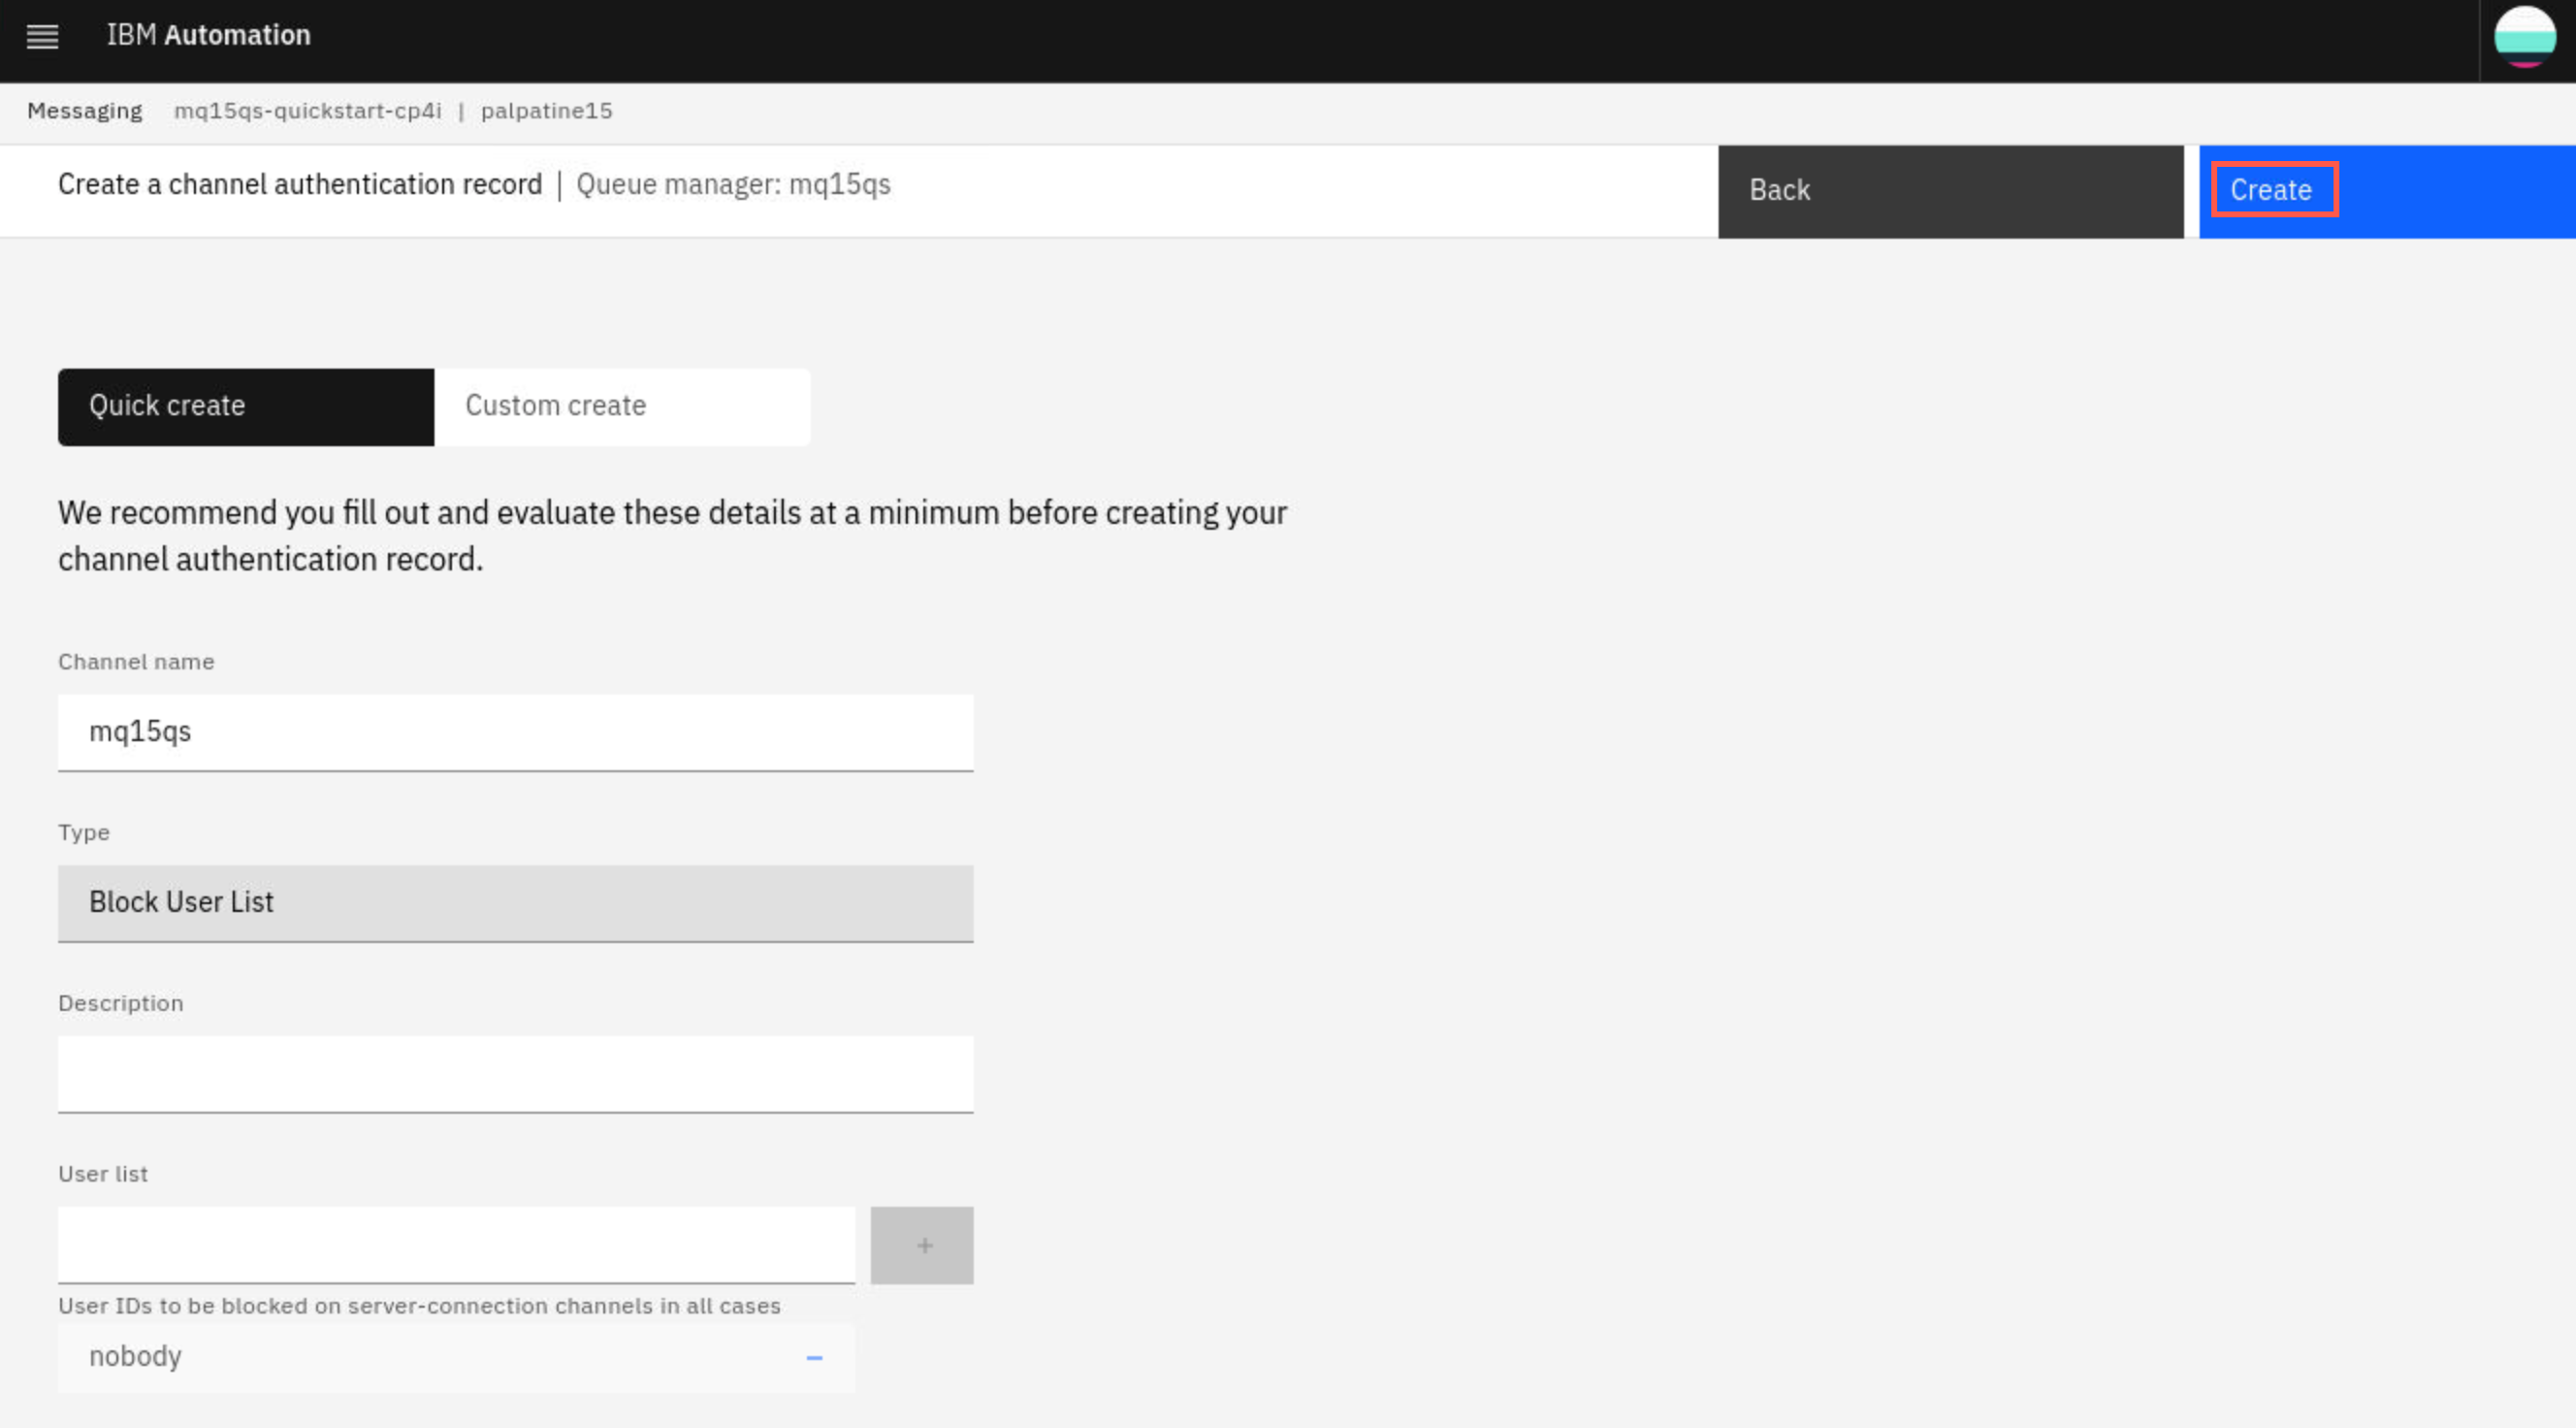
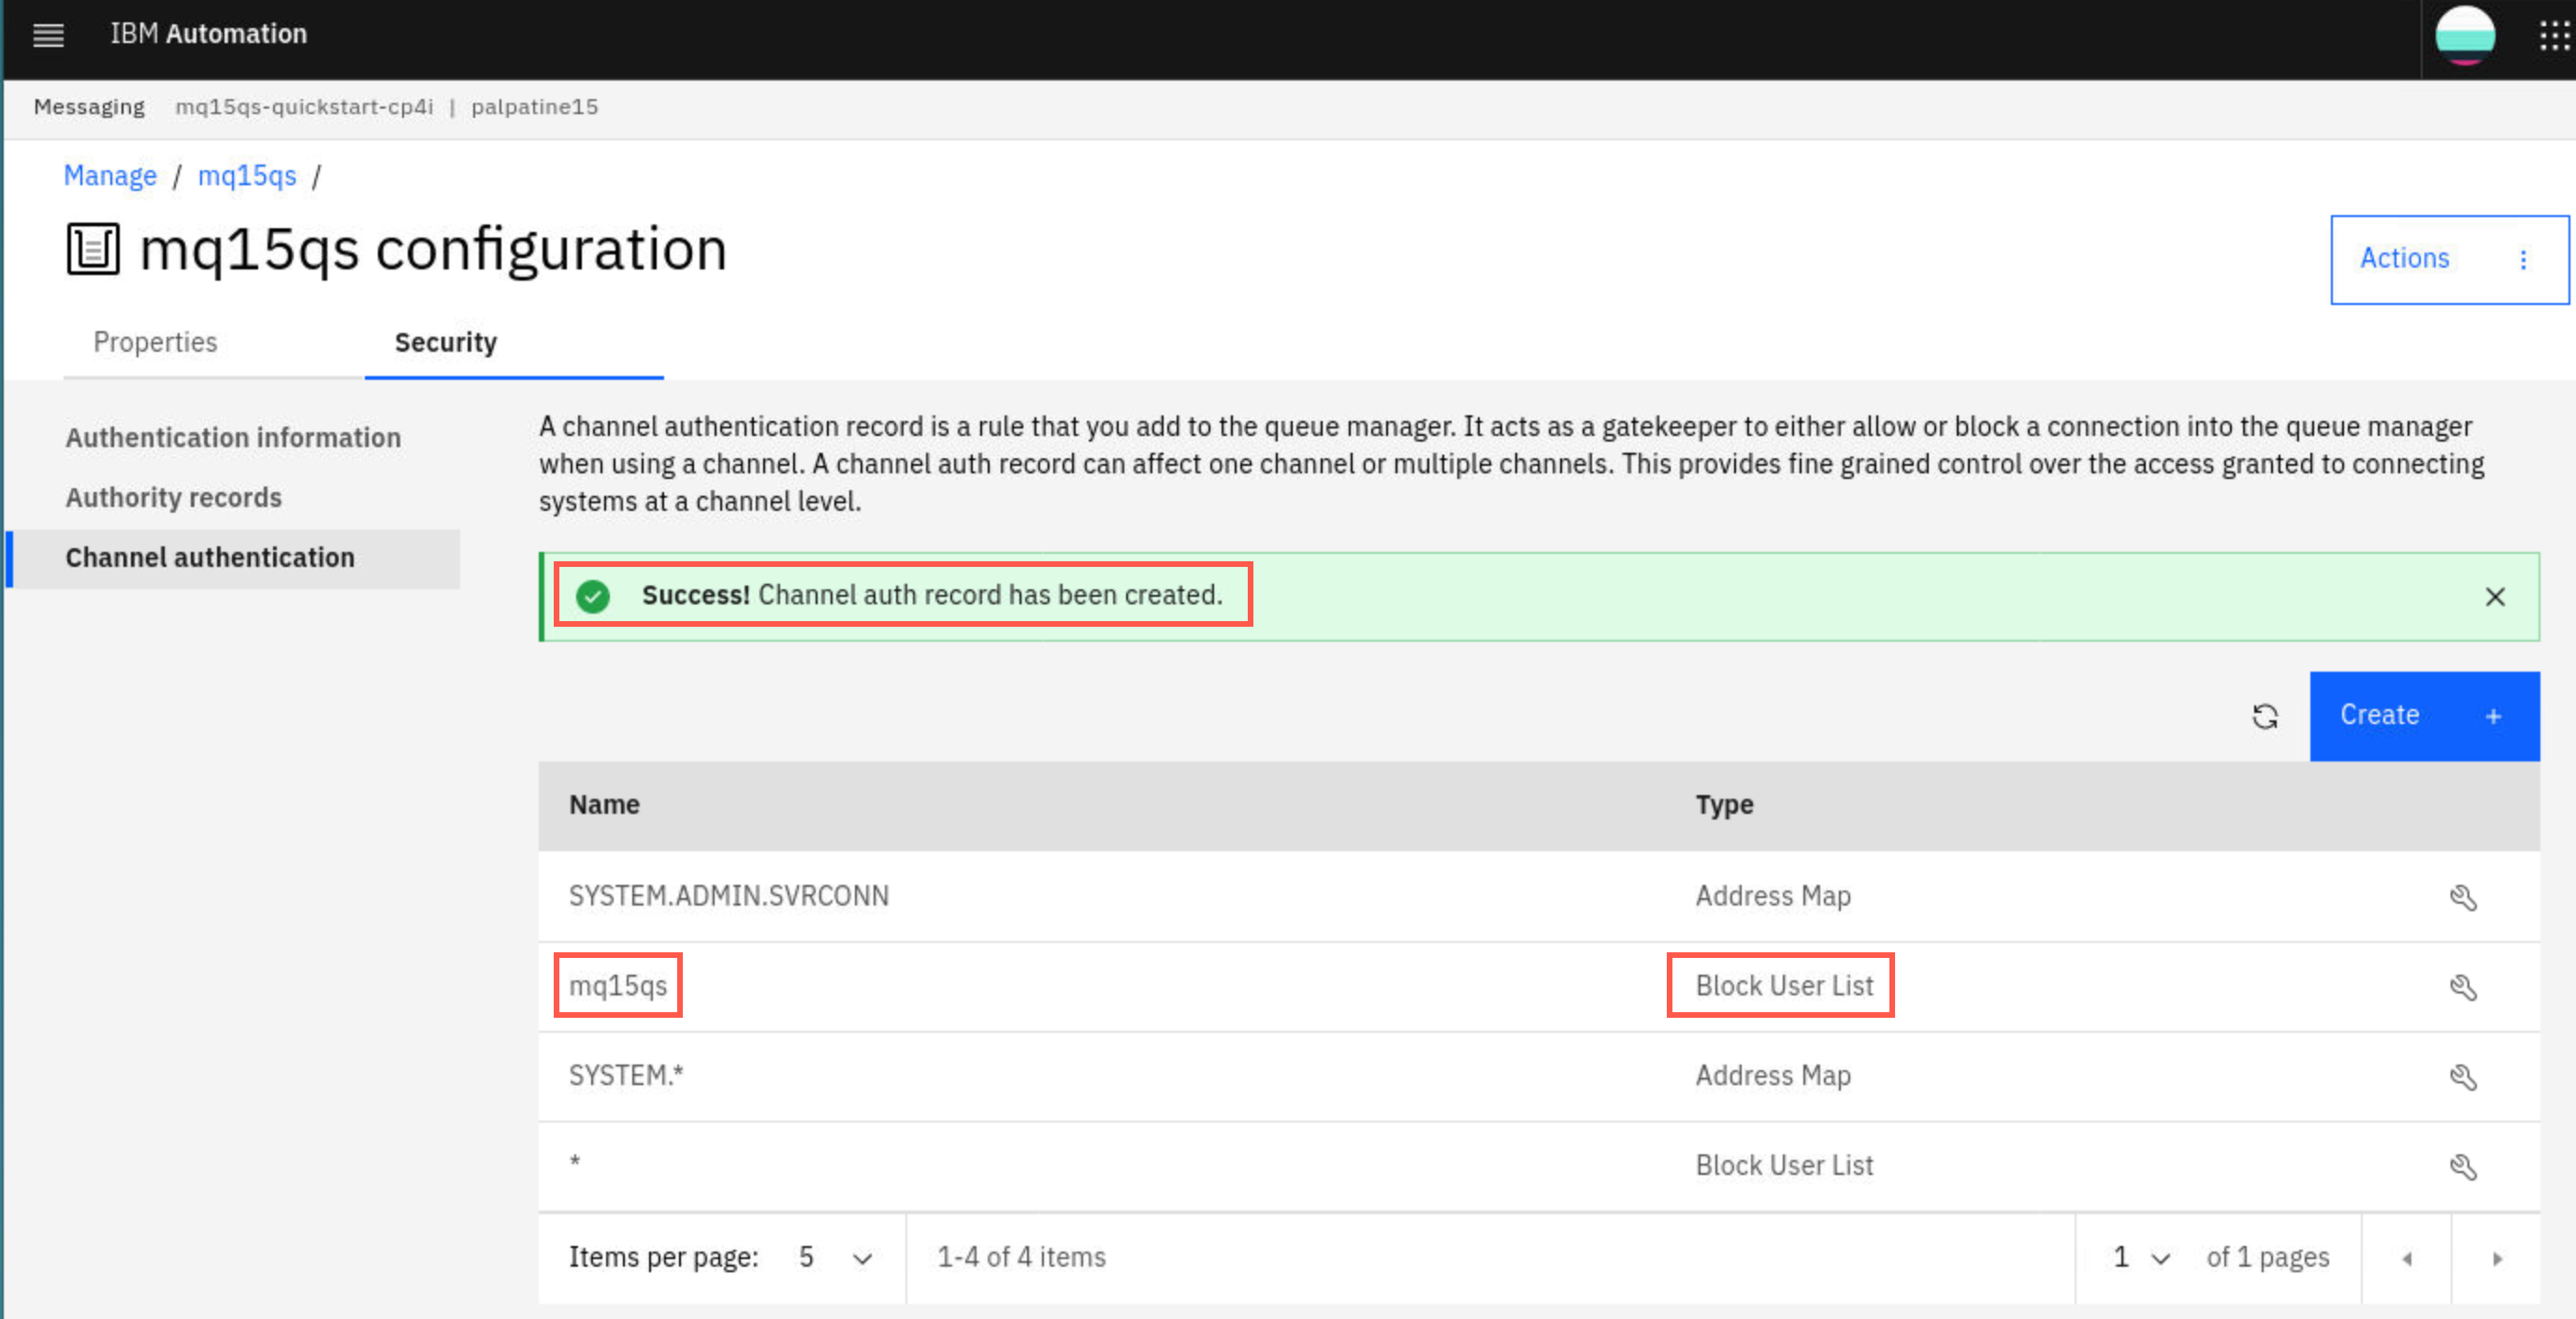
You will receive a green succes notification and the record appears in the list.
-
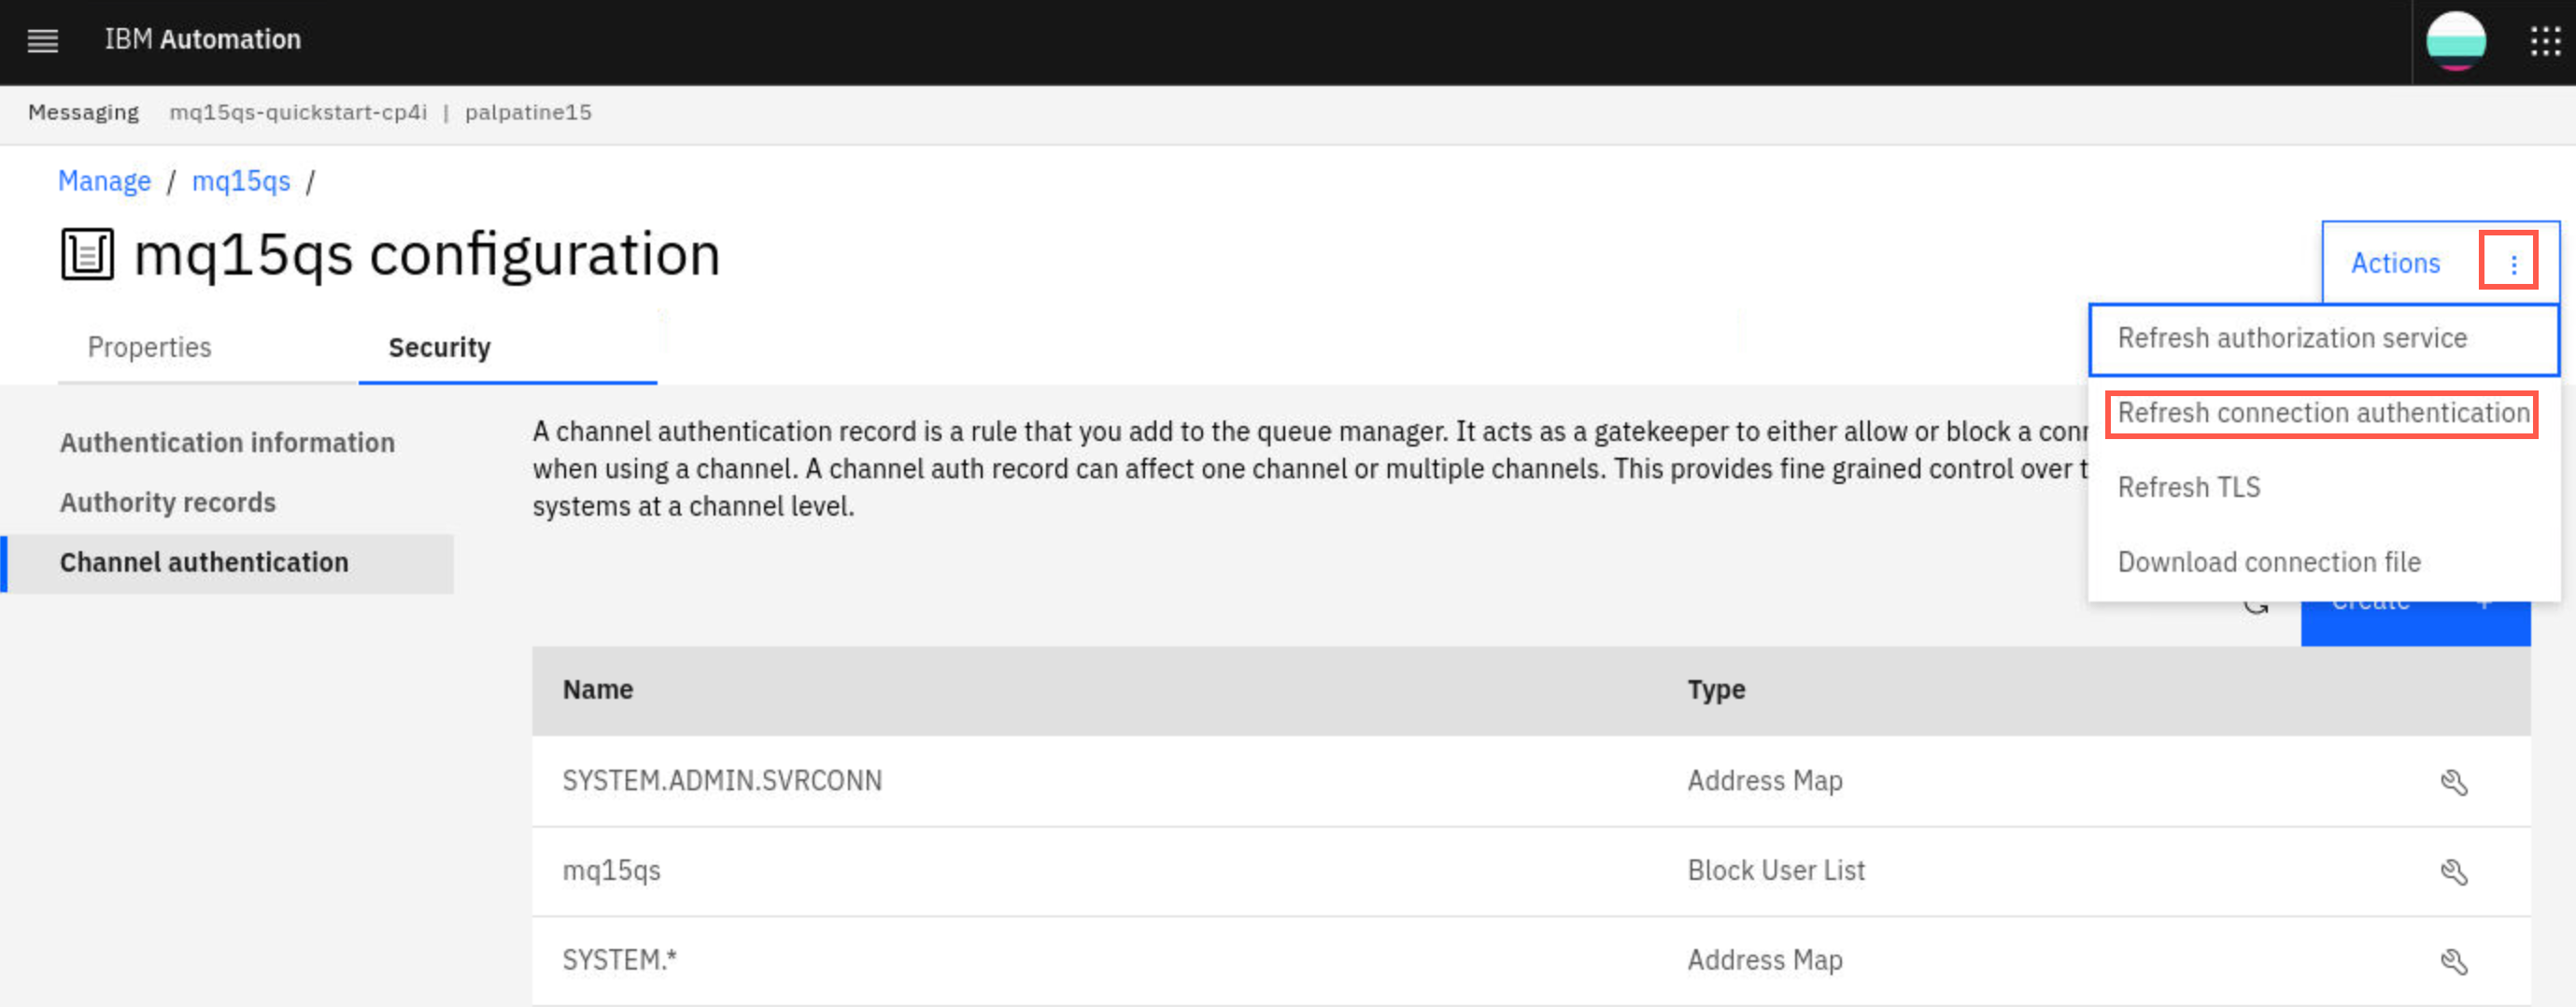
Click the elipsis next to Actions in top right corner and select Refresh connection authentication.
-
On the pop-up, click Refresh.
Test MQ
MQ has been deployed within the Cloud Pak for Integration as containers within pods along with other containers deployed within the same Cluster. This deployment is NOT accessible externally. Depending on your scenario you can connect ACE / API Connect / Event Streams, etc to MQ using the deployed service. This acts as an entry point into MQ within the Kubernetes Cluster. Assuming you followed the above instructions within the deployment the hostname will be of the form mq00qs-cp4i-ibm-mq. To verify the installation we will use an MQ client sample program within the deployment.
-
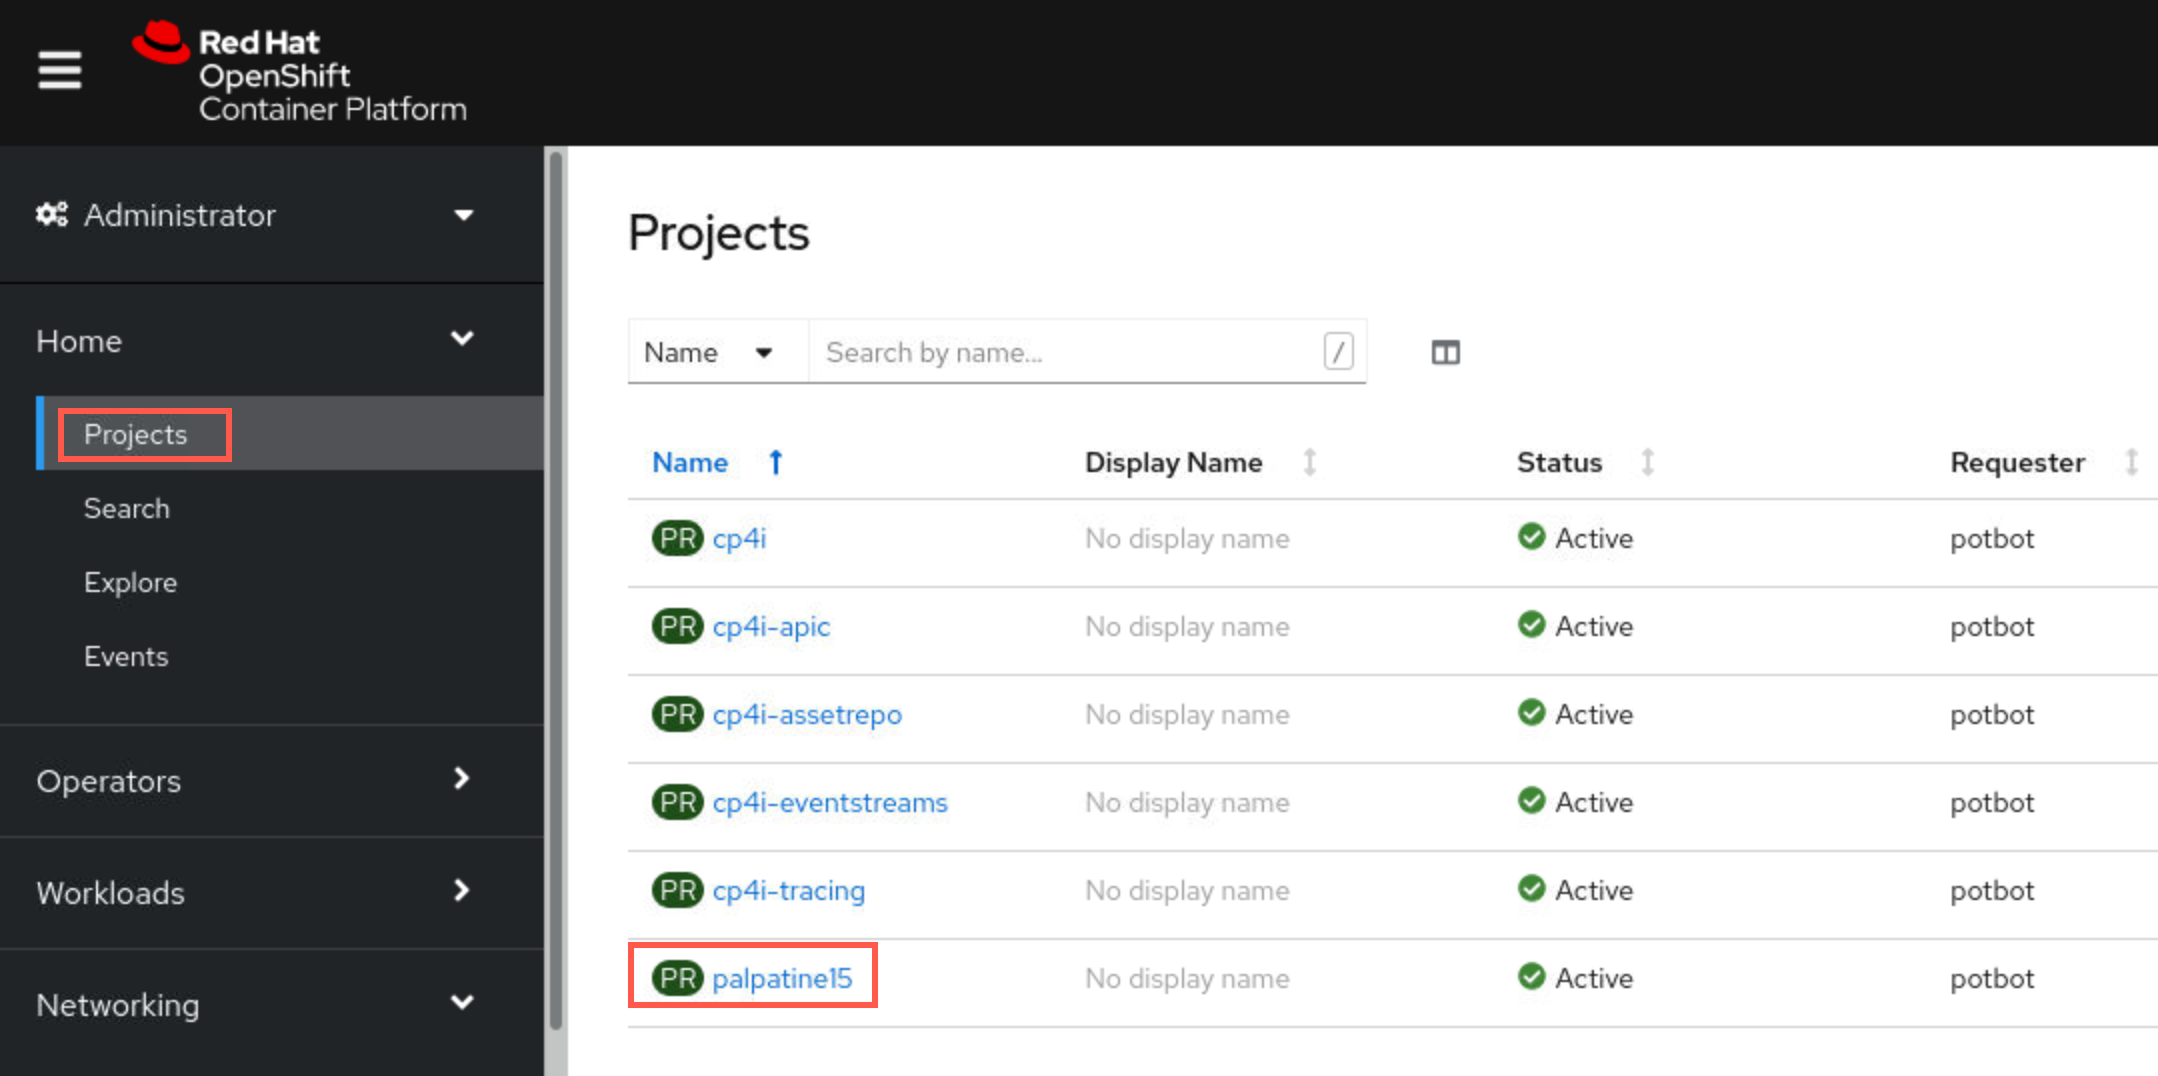
Return to the OCP Console. Make sure you are in your assigned namespace, by clicking Projects and clicking its hyperlink.
-
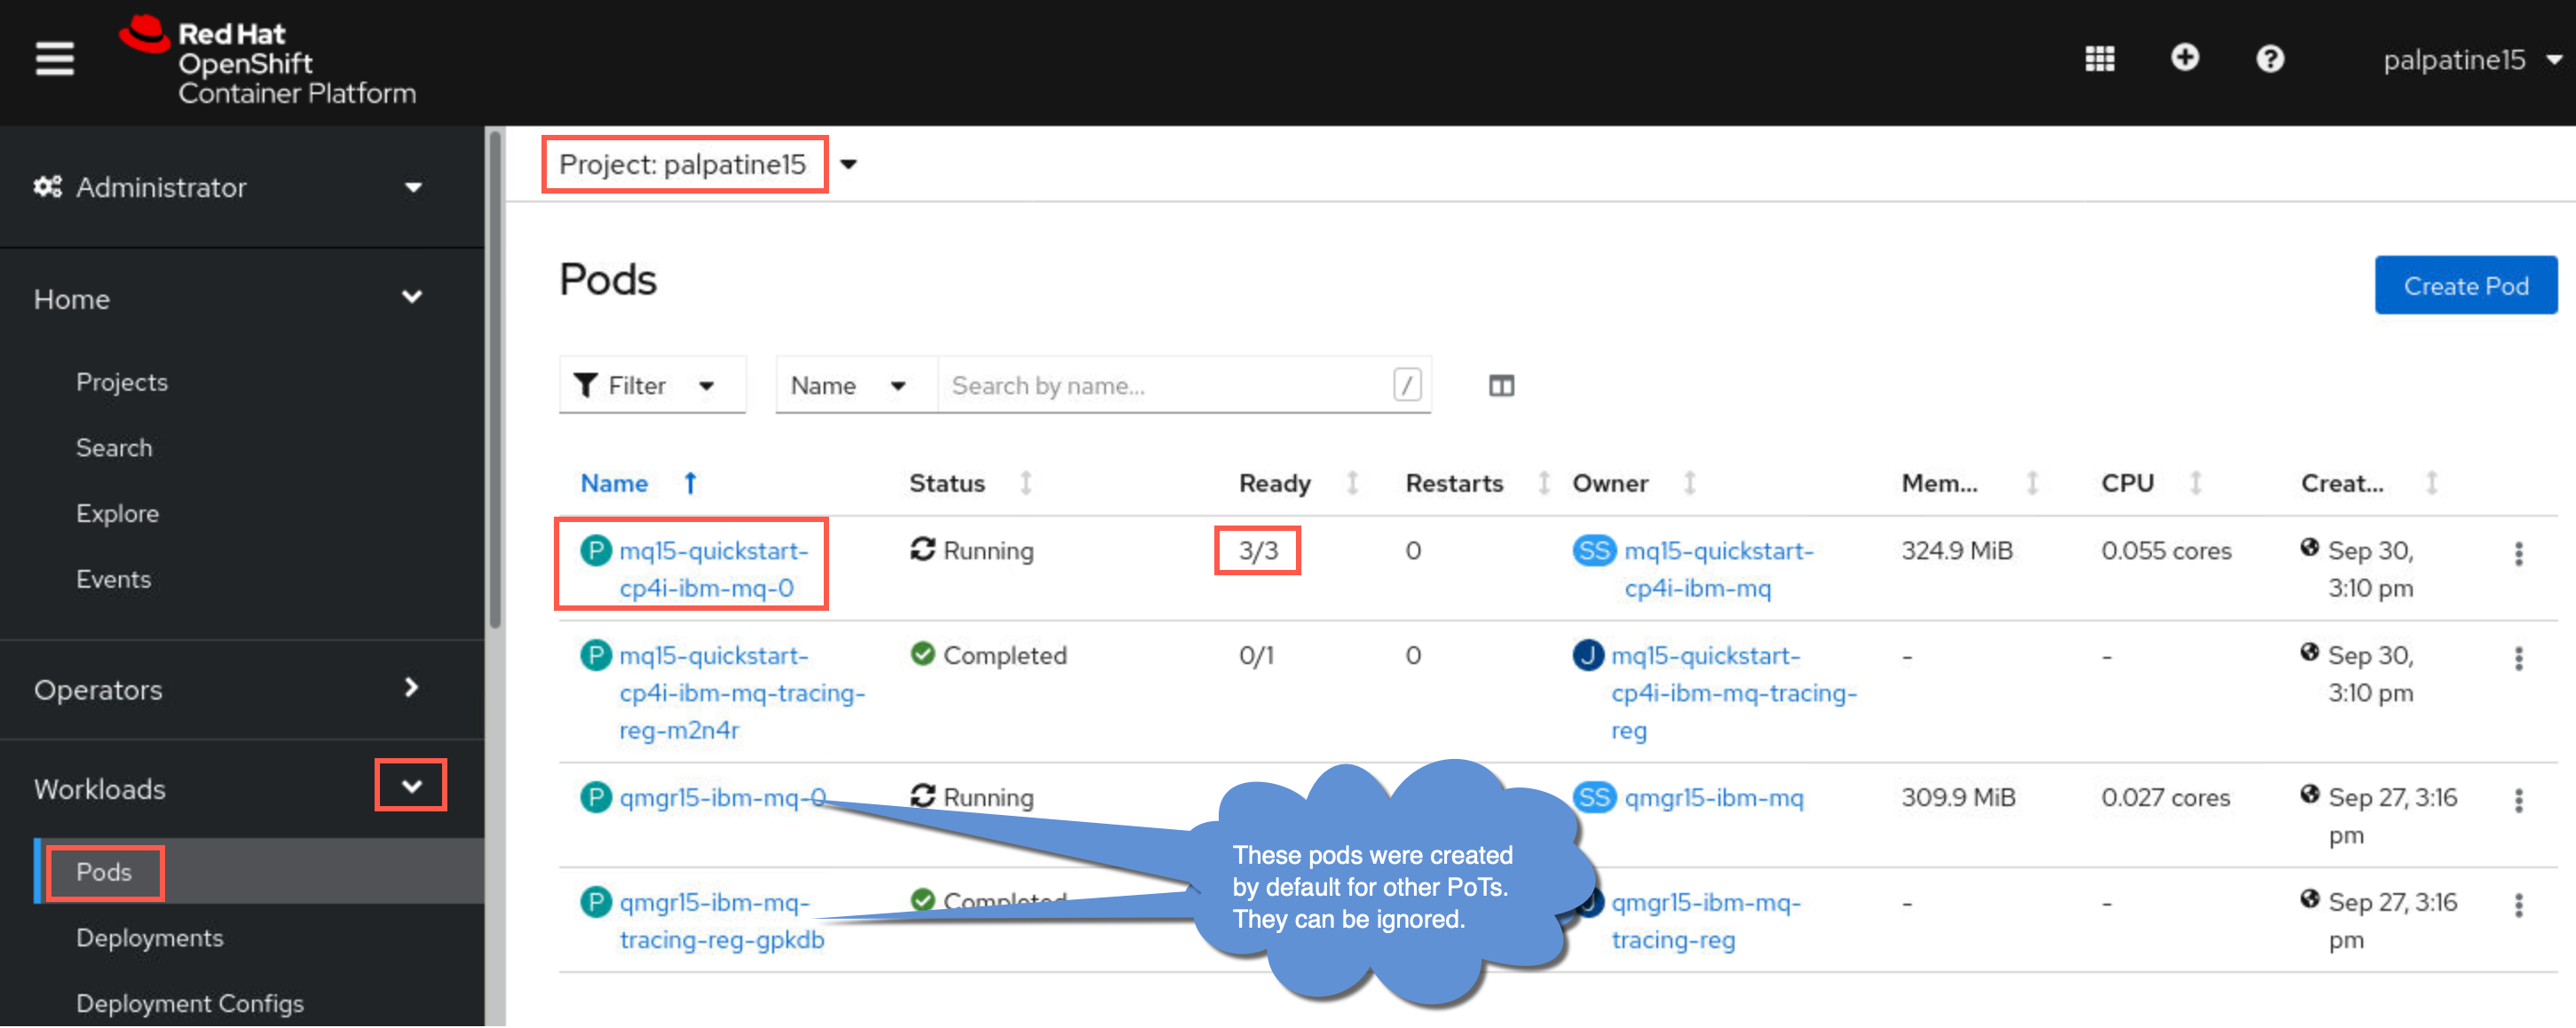
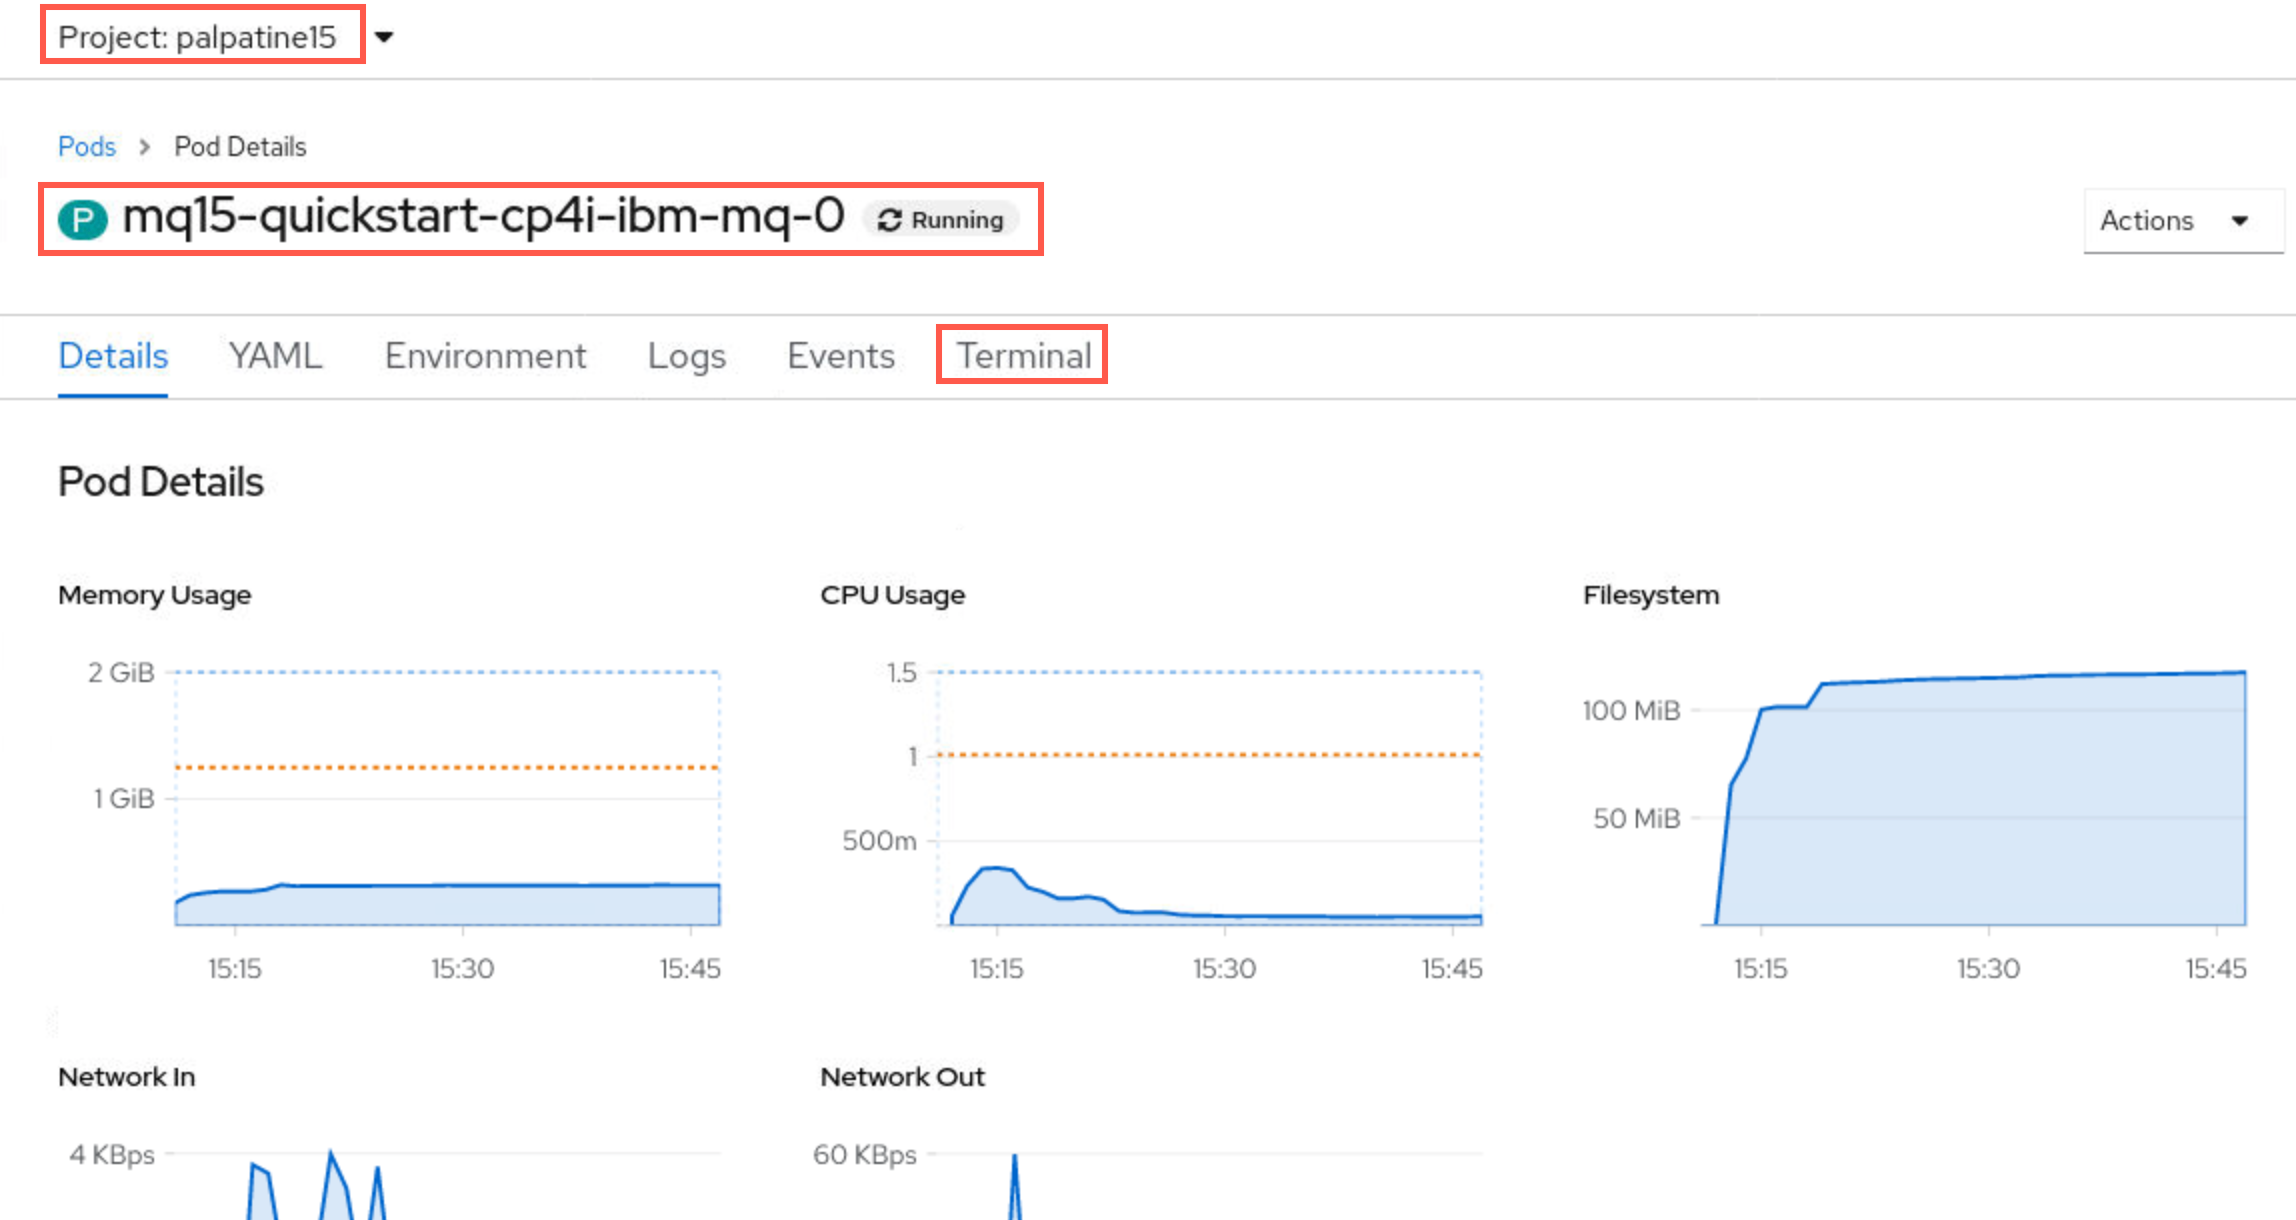
Once in your namespace, click the drop-down for Workloads then select Pods. You will see the one pod for your MQ instance. You will see that the Status is Running and there are three containers running in this pod. You will also see a pod for registering your instance with the Operations Dashboard (tracing) that has been completed.
-
Click the hyperlink for the pod. Now you will see quite a bit of details about the pod. Explore the details where you find graphs for memory and cpu usage, filesystem and network. Scroll down and you will find the containers and volumes. From this panel you can drill down into any of these. But for now, you need to run a test. Click the Terminal tab which will automatically log you into the Queue Manager container.
-
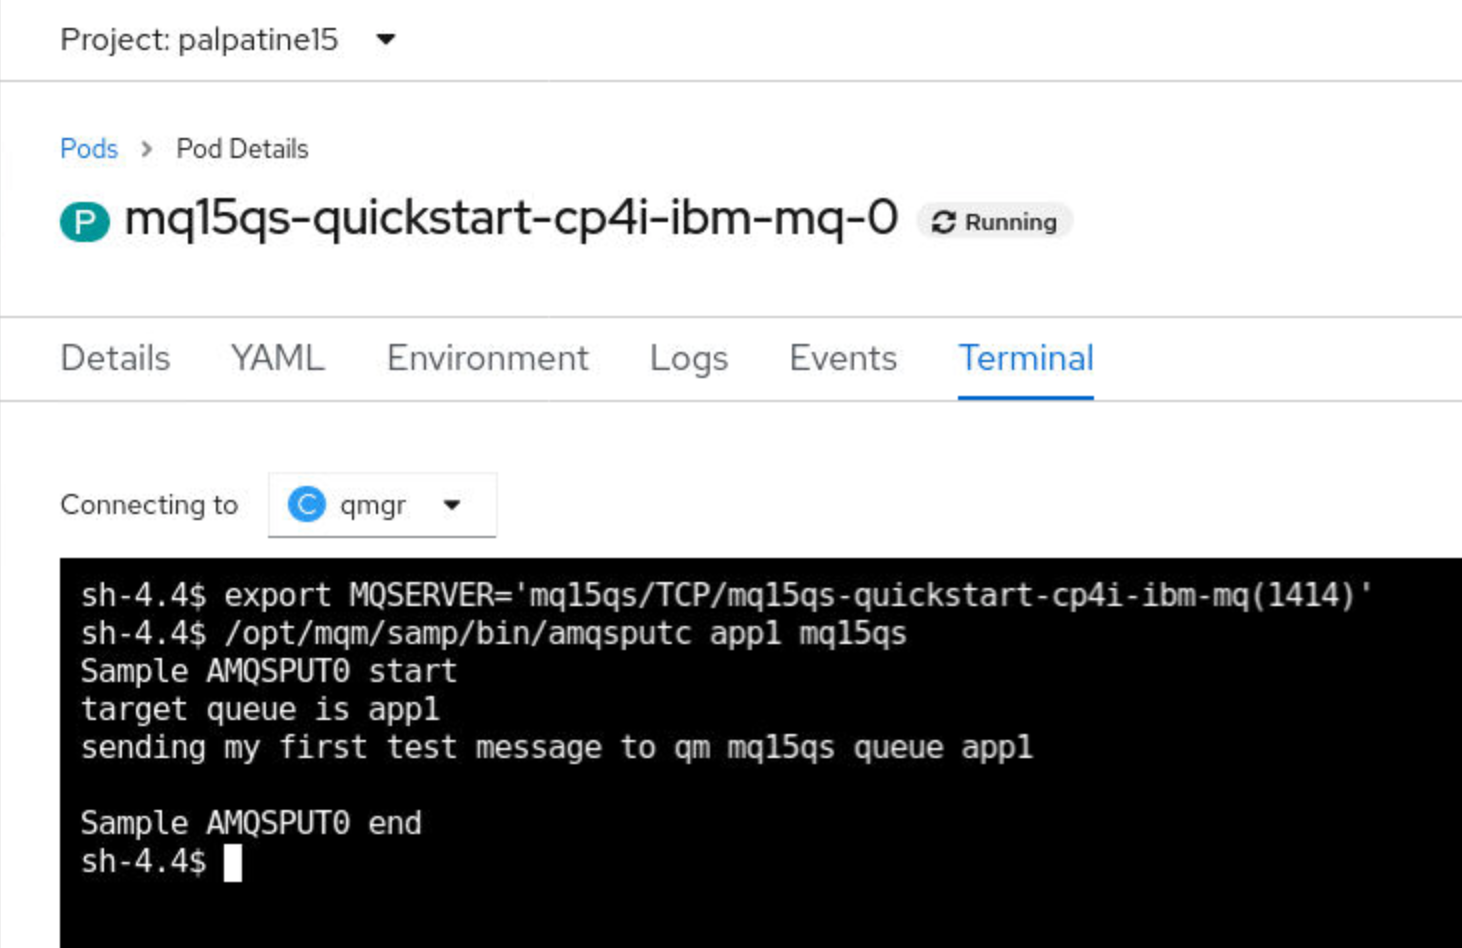
Run the following commands to send a message to the app1 queue. Don’t forget to replace xx with your student ID.
export MQSERVER='mqxxqs/TCP/mqxxqs-quickstart-cp4i-ibm-mq(1414)'The format of this environment variable is : channel name / TCP / host name (port)
The host name is actually the network service for your queue manager instance.
/opt/mqm/samp/bin/amqsputc app1 mqxxqsThis command is putting a message on queue app1 on queue manager mqxxqs. Type a message such as the following:
sending my first test message to qm mqxxqs queue app1Hit enter again to end the program.
-
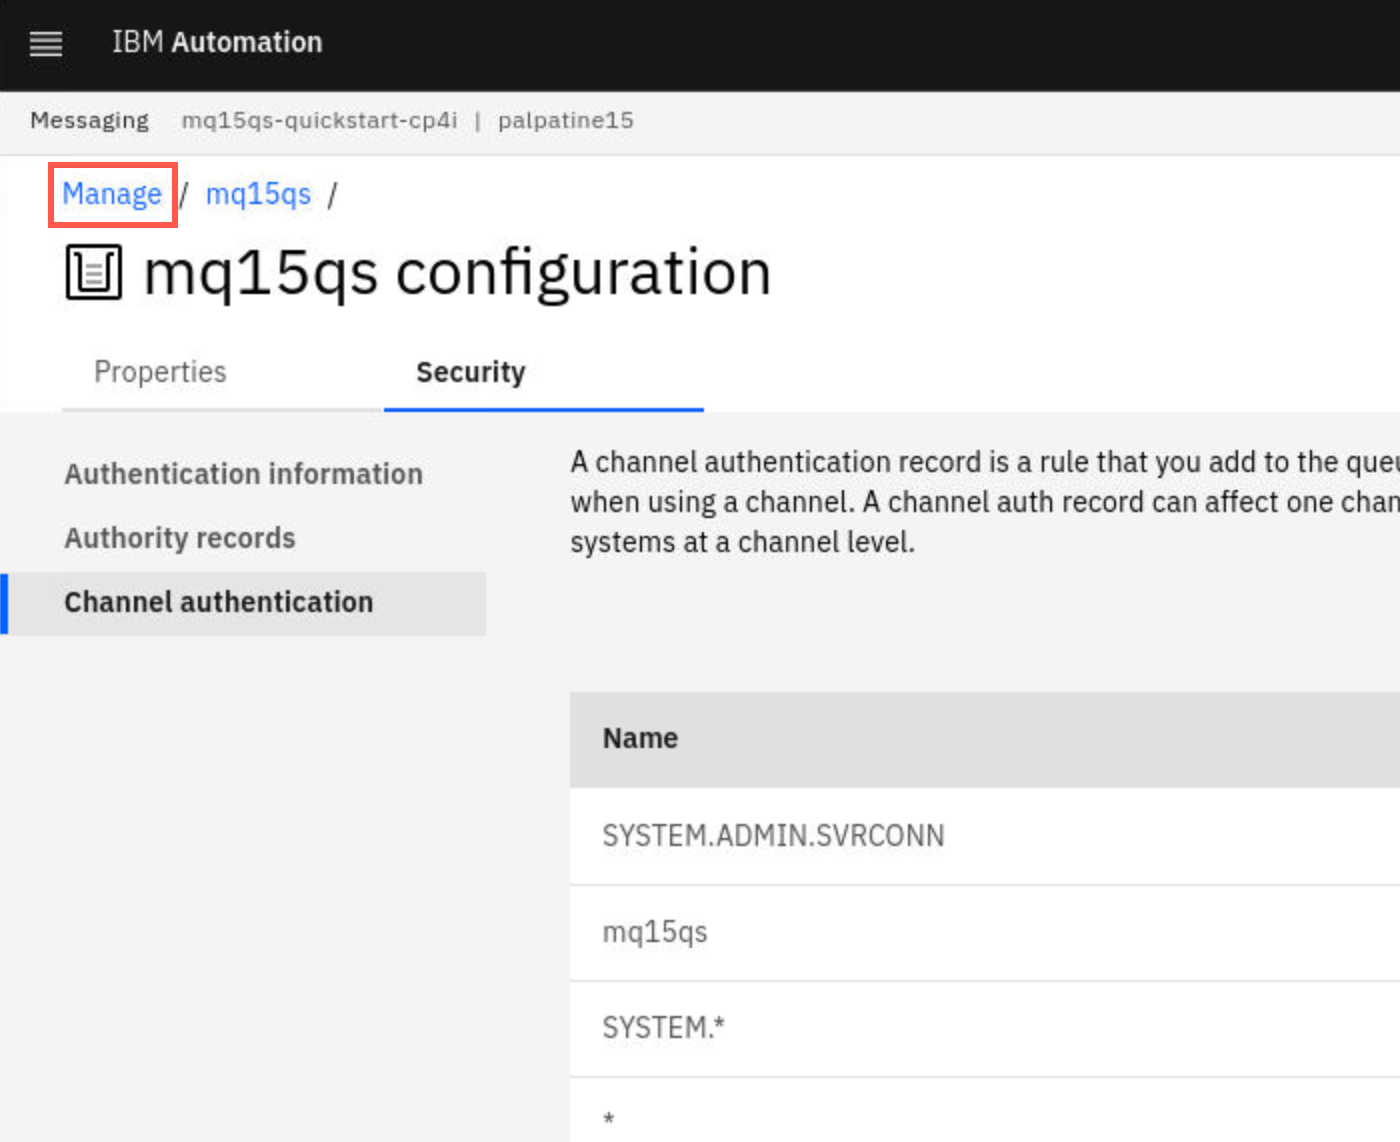
Return to the MQ Console and navigate back to the queue manager view by clicking on Manage.
-
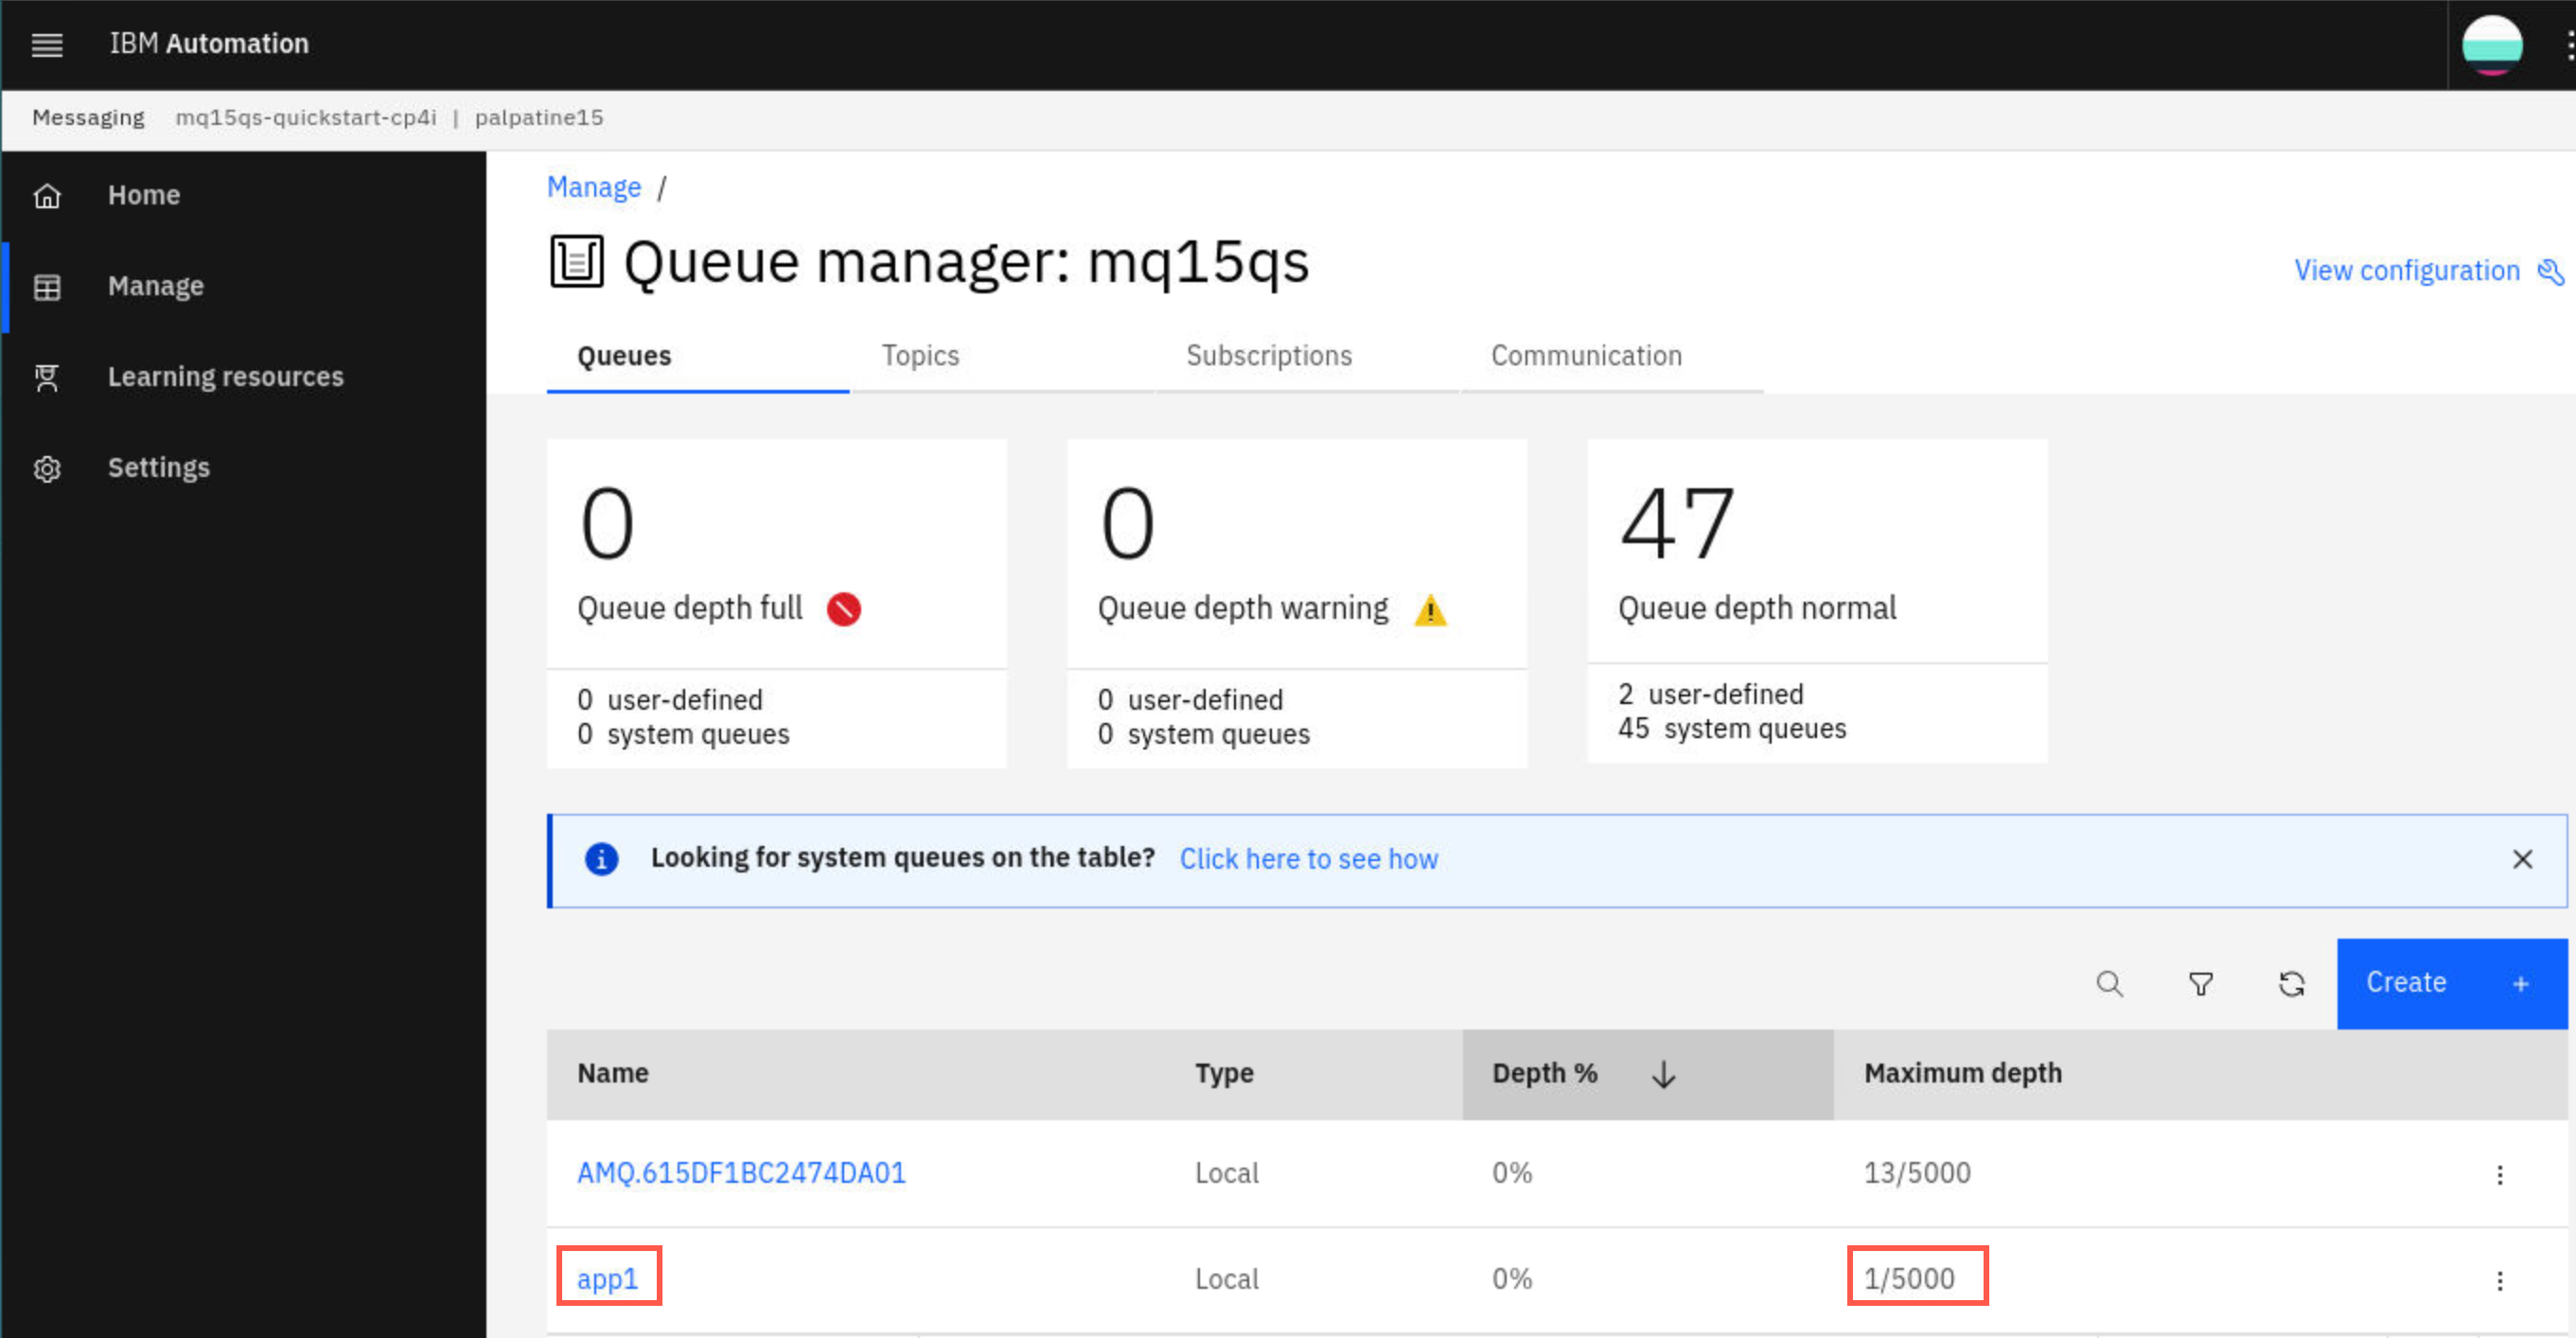
Notice the app1 queue has a queue depth of 1 with a maximum queue depth of 5,000. Select the app1 queue.
-
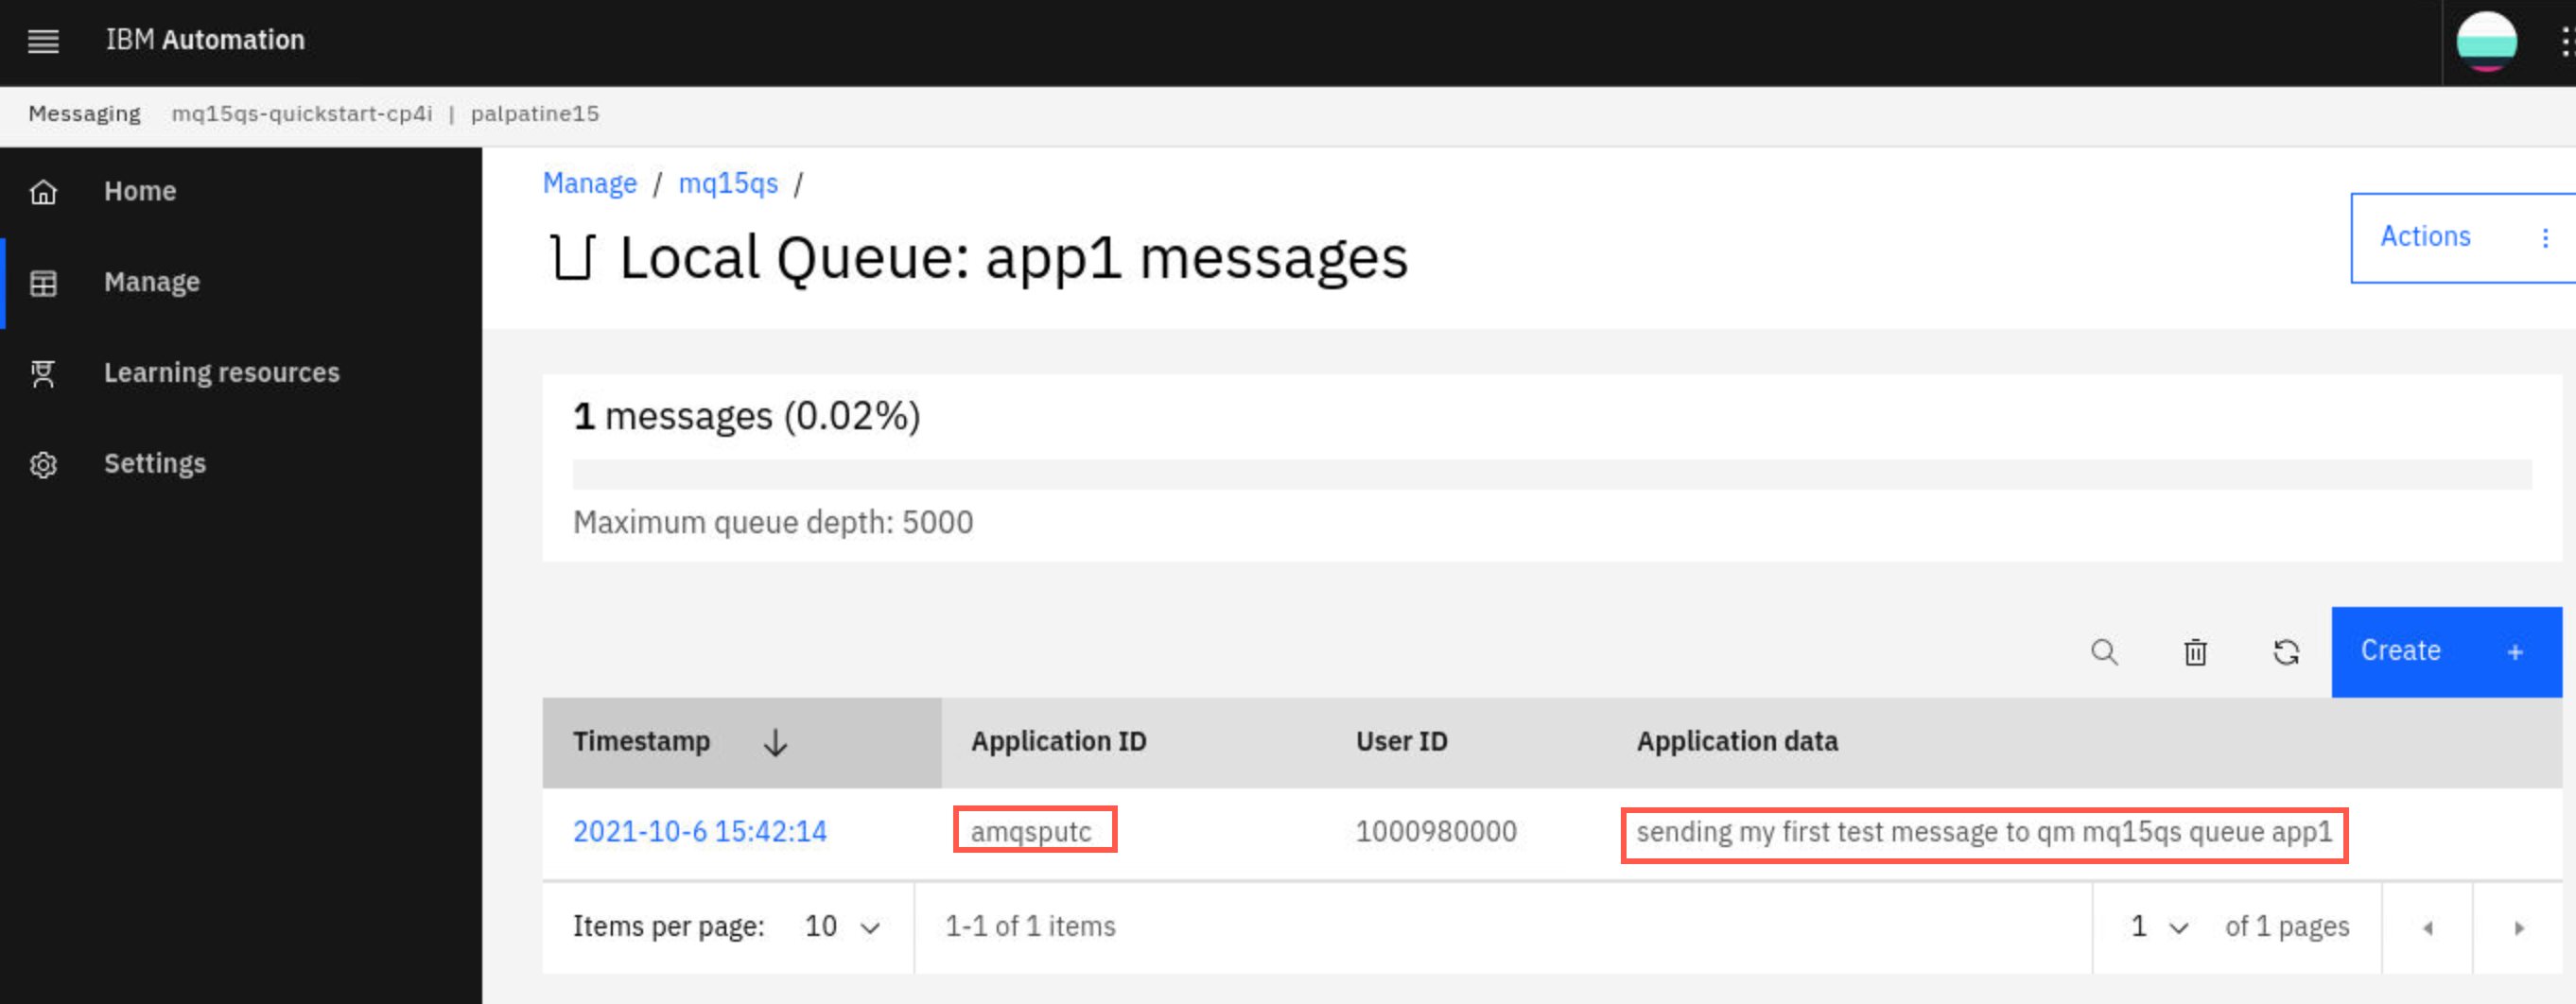
Click the hyperlink for queue app1. Here you see the messages on the queue. You will recognize your message under Application data along with application name and time stamp.
Congratulations! on completing Lab 1.
Cleanup
If you are doing this lab during the MQ on CP4I POT you should complete the cleanup to conserve resources on the cluster.
If you are an IBMer running the lab on your ROKS cluster it is up to you whether you want to leave this queue manager for demo purposes. If not then you should complete the cleanup.
-
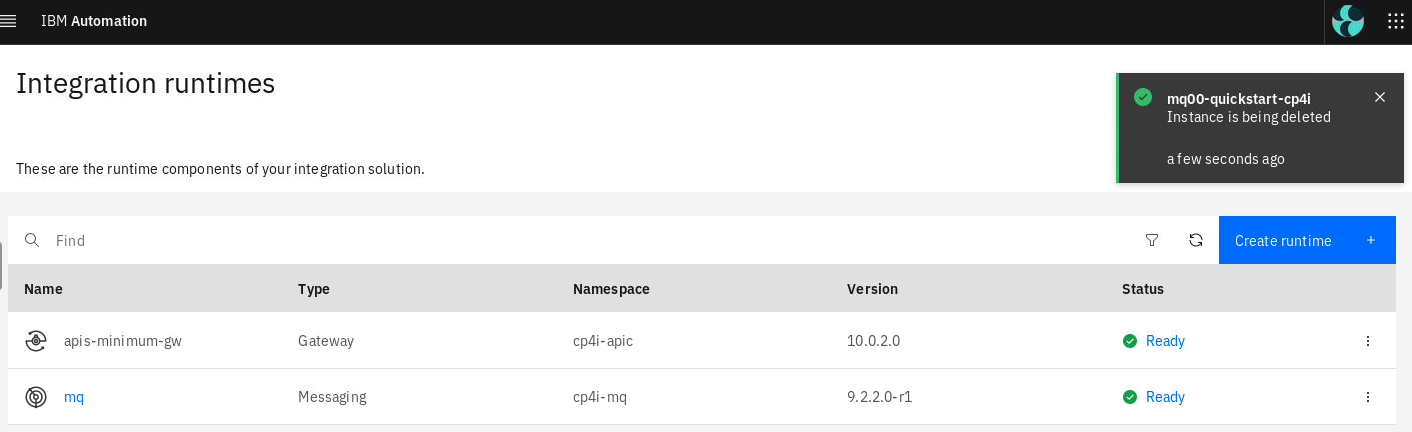
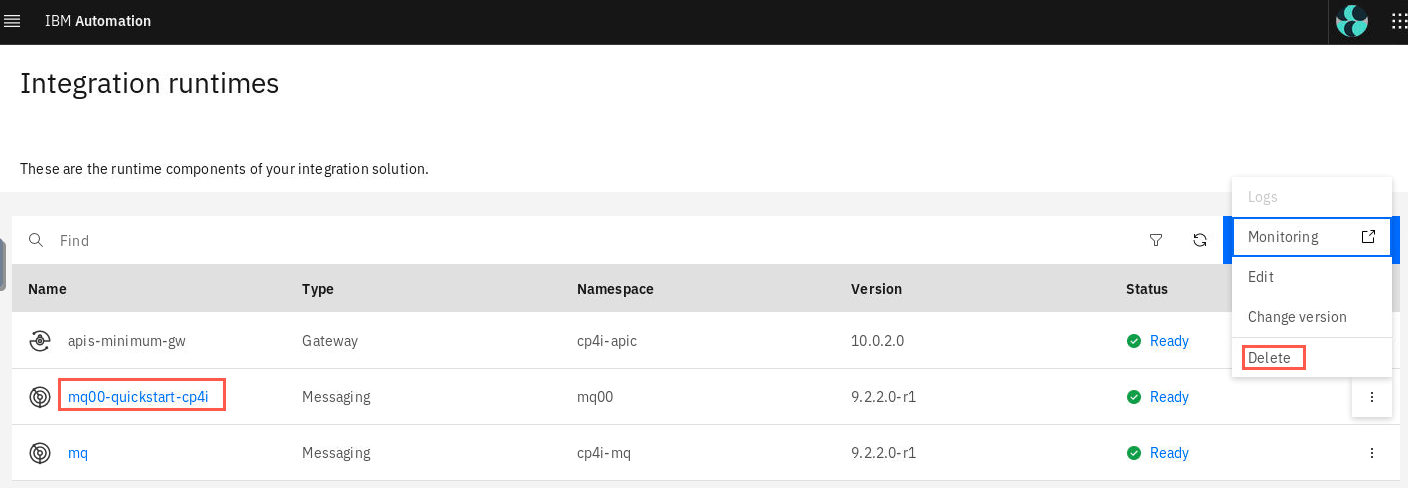
Return to the Platform Navigator. Under Runtimes find your instance, click the elipsis on the right and select Delete. This will delete the queue manager pods and all related artifacts. This will help reduce load on the cluster as you continue the rest of the labs. This queue manager will not be needed again.
-
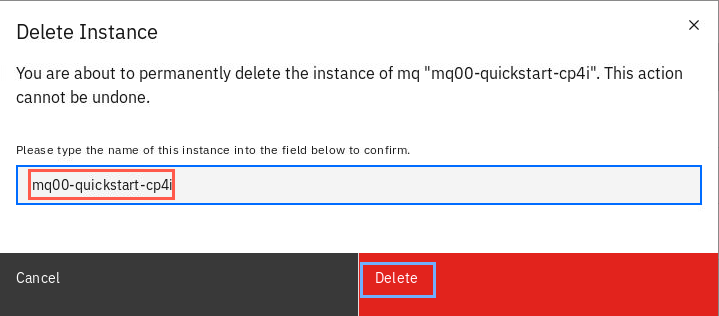
You will be required to enter the name of your instance. Then the Delete button becomes active. You must now click the Delete button.
-
Your instance is now gone and you will receive a success pop-up.