Overview
In this lab exercise you will create an IBM Event Streams instance and test its operation using sample applications that are provided with the Event Streams service.
In order to complete this lab you must first complete the steps that are listed in the Prerequisites section of this Proof of Technology.
Step 1: Login to IBM Cloud
Complete the following steps to login to IBM Cloud.
-
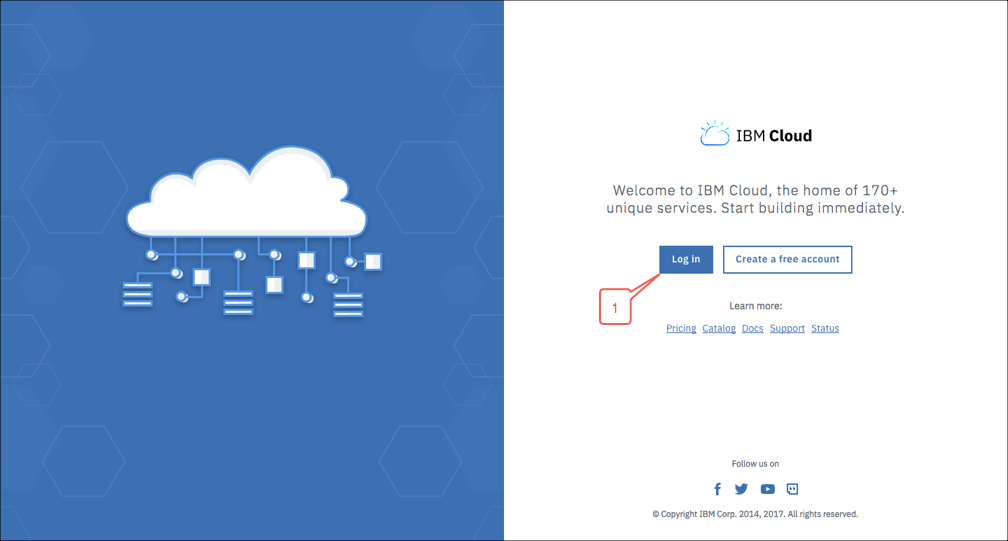
Using the Firefox browser navigate to the following URL to access the IBM Cloud login page and then click on the Log in button: https://console.bluemix.net/
-
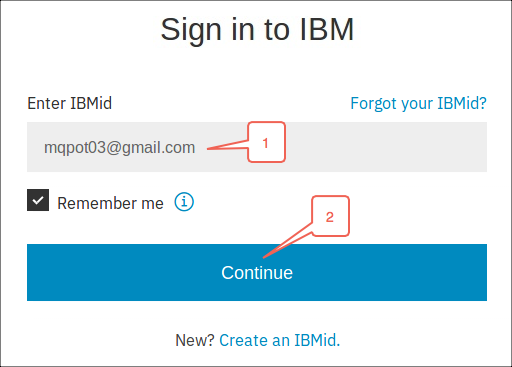
Enter the email address for your IBM Cloud account, or the one you used when you created your free IBM Cloud account and then click on the Continue button.
-
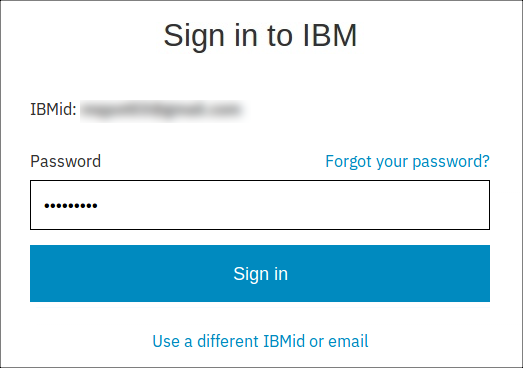
Enter your IBM Cloud password and then click on the Sign in button.
-
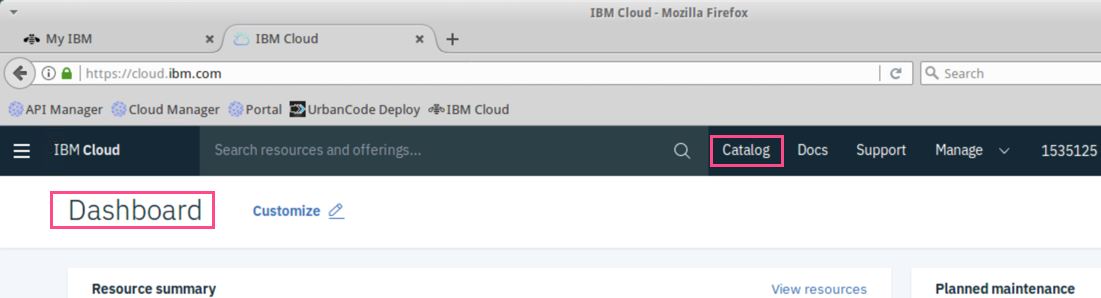
The IBM Cloud Dashboard will appear.
Proceed with the next step: Create a Event Streams Instance.
Step 2: Create a Event Streams Instance
The IBM Cloud Dashboard is the main entry point to all of IBM Cloud’s capabilities. This includes provisioning new applications and/or services as well as the ability to work with existing applications and services that have been deployed. For this lab exercise you will need to complete the following steps to provision a new instance of Event Streams.
-
Click the Catalog menu item to locate the application or service that you want to create.
-
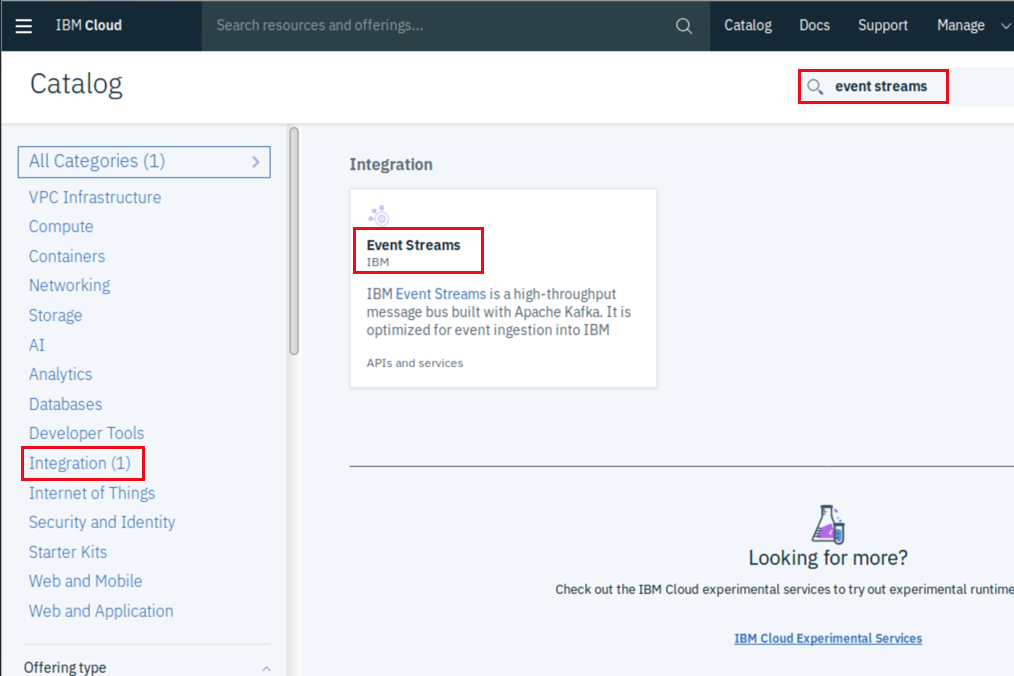
The next page that will be displayed will be a list of the available applications and services along with a brief description of each. You can browse through the various categories of applications and services in the menu on the left side of the page, or you may enter search text in the Search field to narrow your choices.
Enter Event Streams in the Search field to display the Event Streams service. Note that you may also click on the Integration link to locate various offerings that, in addition to Event Streams, are related to integration.
Once you have located the Event Streams service click on the tile that represents the service to continue.
-
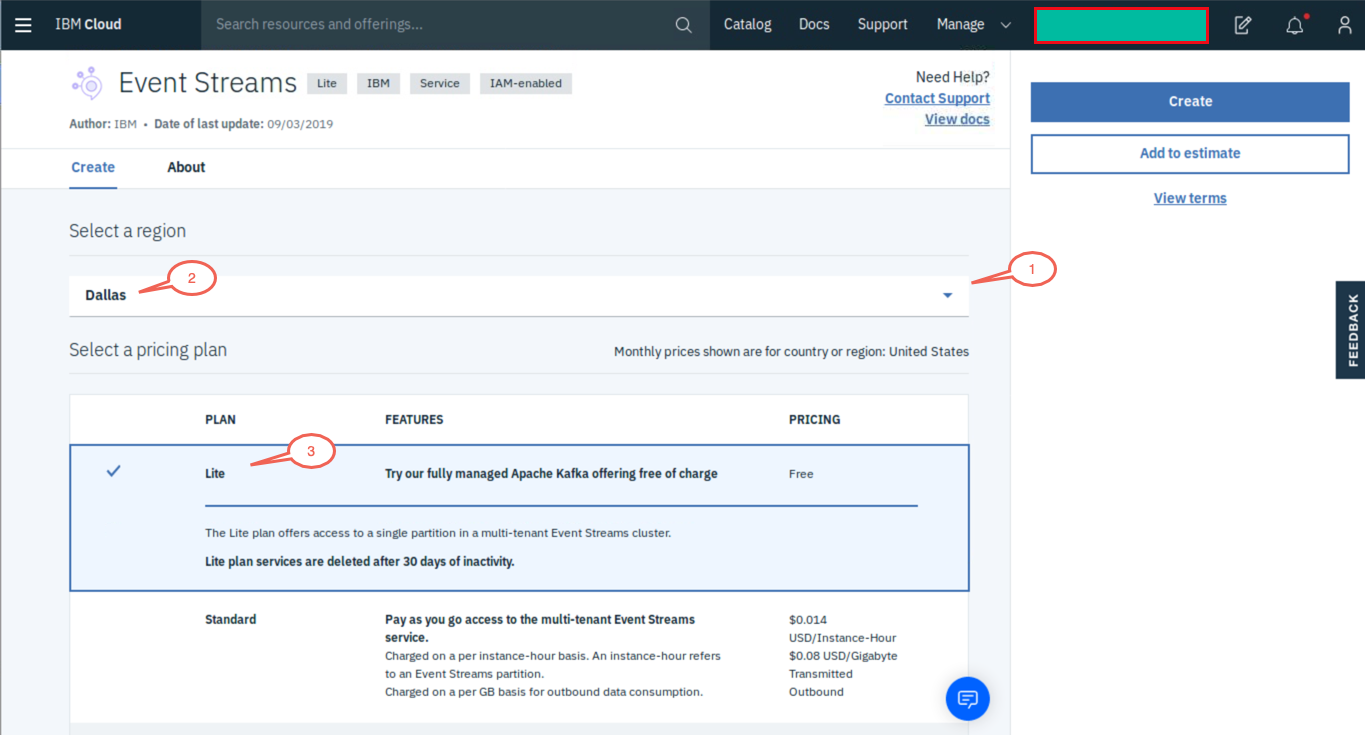
IBM Cloud consists of a number of different data centers. You will need to select a data center that is close where your users are located to reduce network latency. Click the drop-down under “Select a region” and select a data center.
Note:
Be aware that some of the IBM Cloud data centers may not host all of the available applications and services.Under “Select a pricing plan”, select the Lite plan.
-
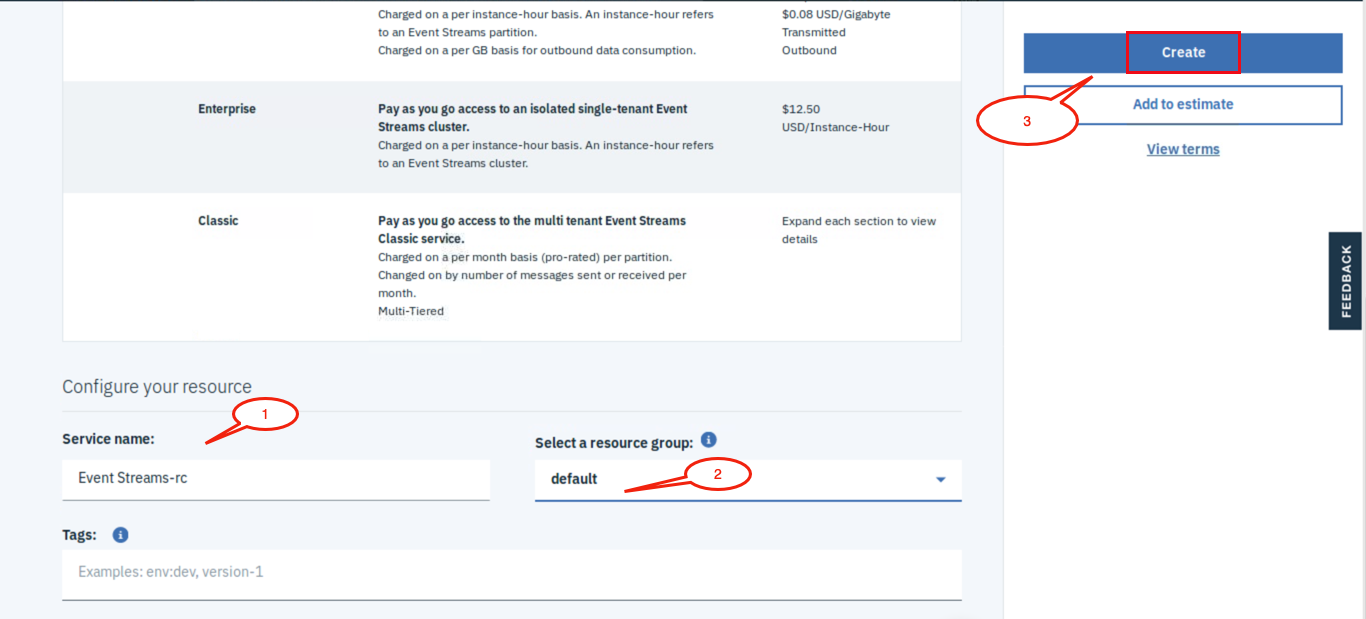
Scroll down to see the rest of the parameters. A Service name will be automatically assigned to your new Event Streams instance. You may change this, if desired. Leave the Resource Group set to Default. Click the Create button to provision the instance.
-
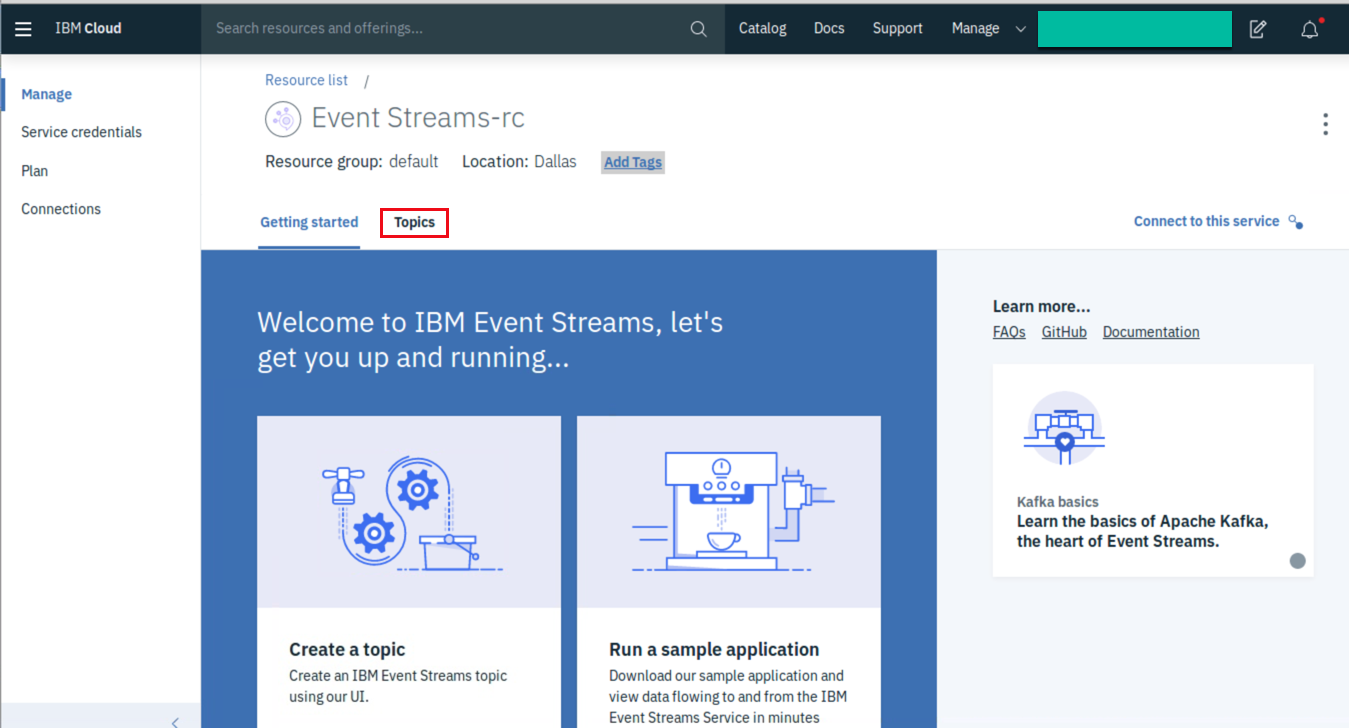
The management page for the Event Streams service will be displayed. As a managed service IBM Cloud configures Event Streams with a number of default values. For this lab exercise you will need to create a topic for testing purposes. To create a topic select the Topics tab and then click on the Create topic button.
-
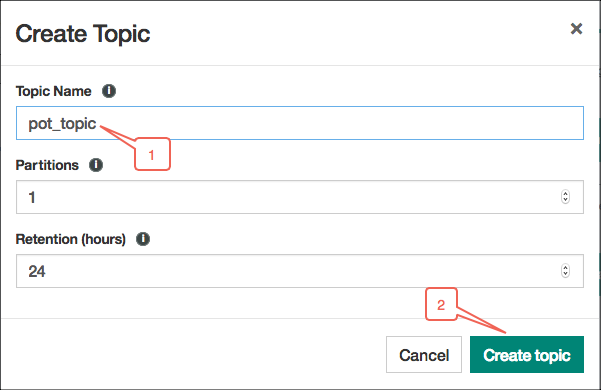
Enter pot_topic in the Topic Name field and then click on the Create topic button to create a test topic.
-
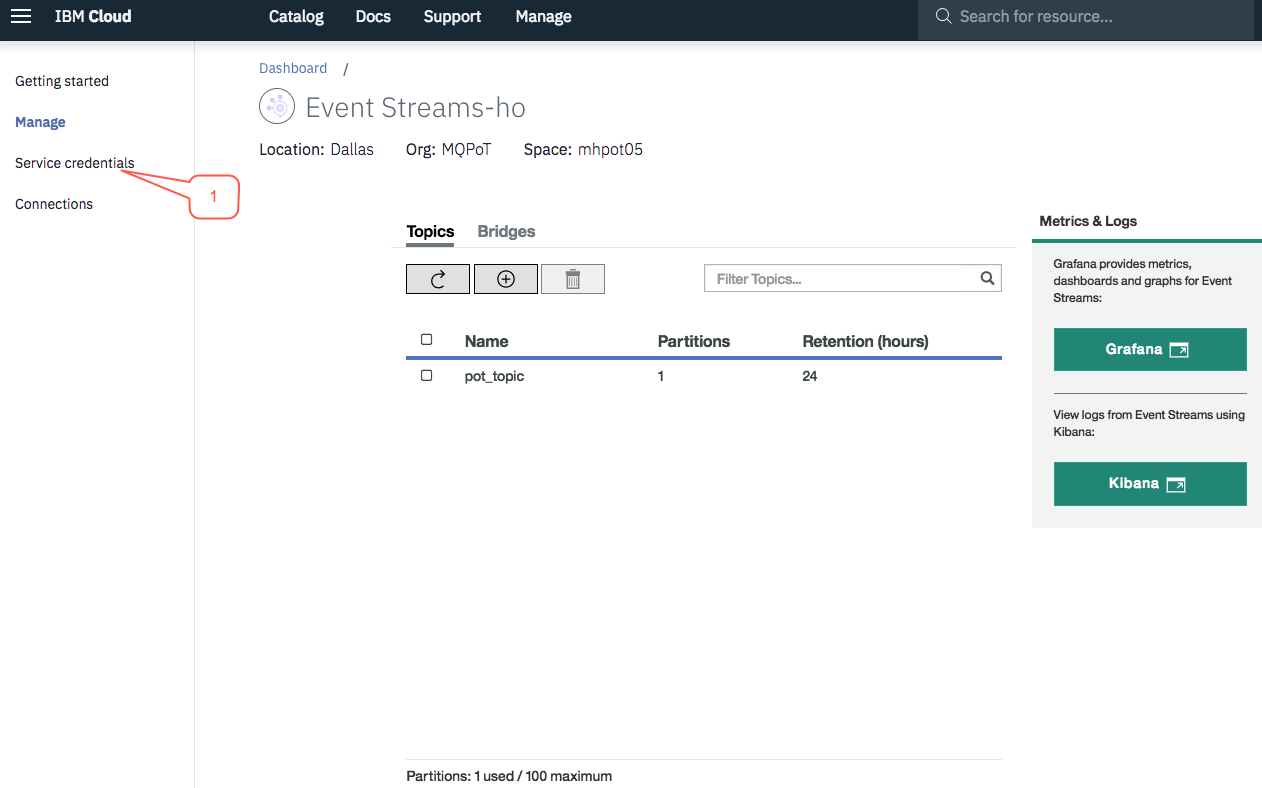
Next you will need to copy and save the service credentials for your Event Streams instance for later testing. Click on the Service credentials link on the left side of the page.
-
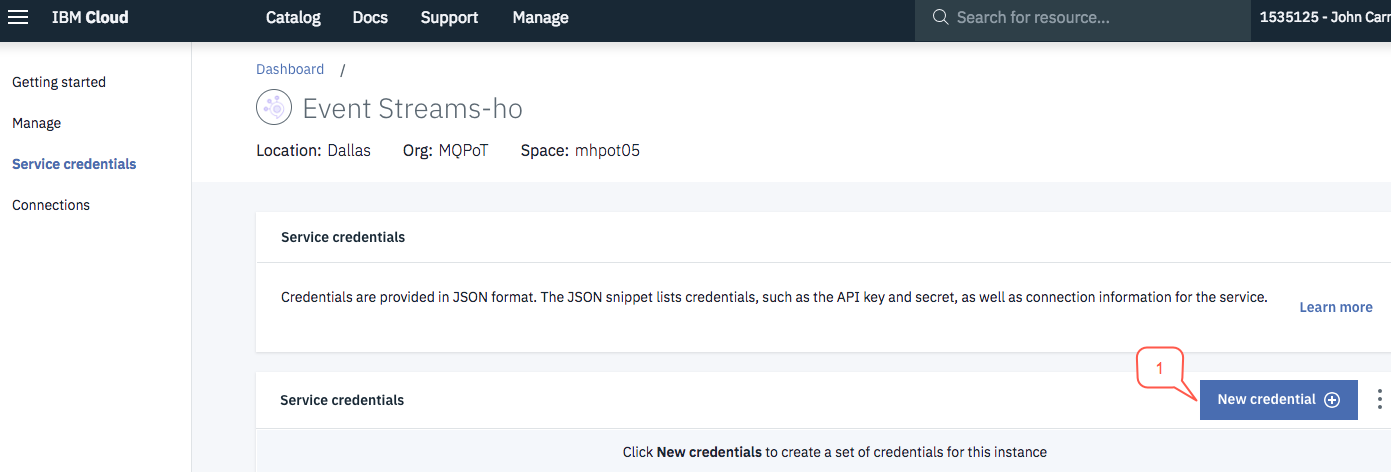
Click on the New credential button to create a new set of credentials.
-
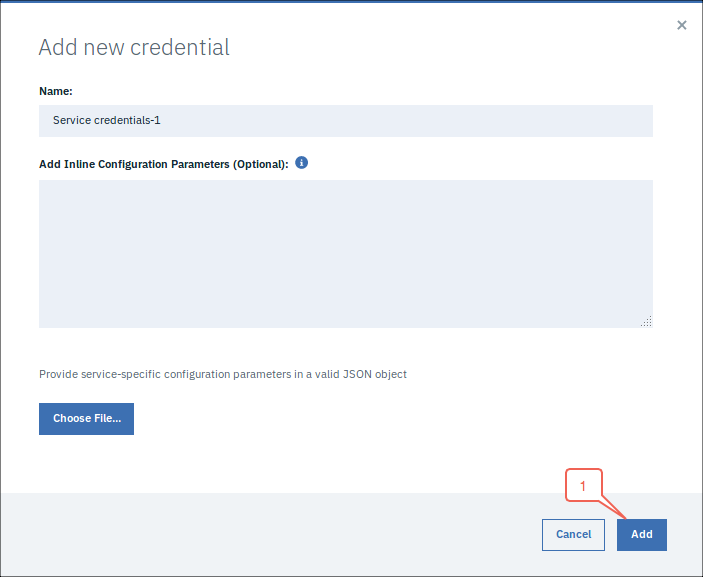
It won’t be necessary to add any inline configuration parameters. Simply click the Add button to continue.
-
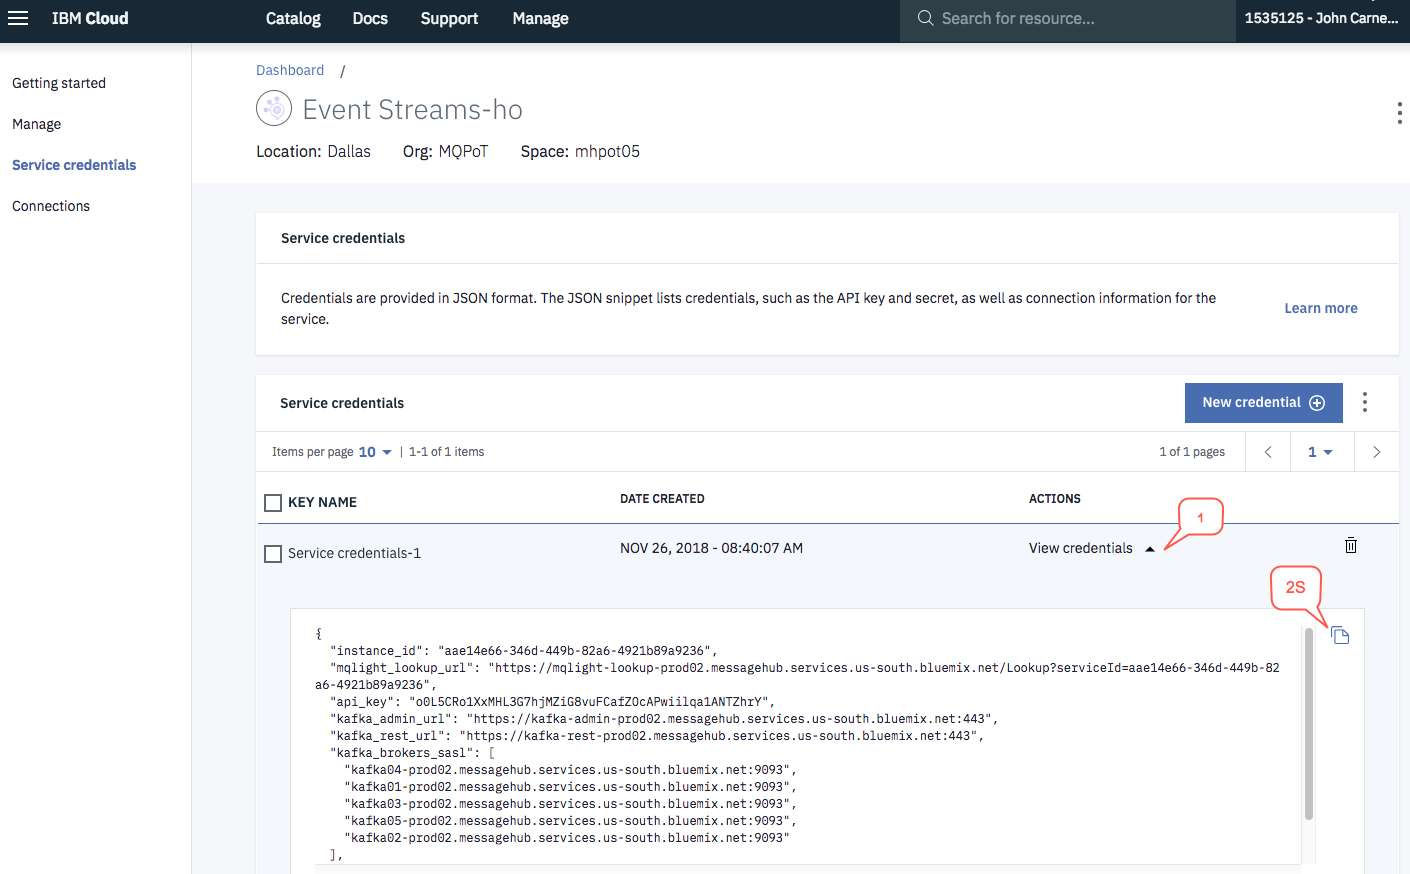
A new set of credentials will be added to the Event Streams instance. Click on the View credentials link and then click on the copy icon to copy the credentials to the clipboard. You will need to paste these values into a temporary file to use when you perform step 3, Test Event Streams Operations.
-
The Event Streams instance is now ready for testing. Do not close the browser window at this time since you will return to the Event Streams service when you perform Step 3, Test Event Streams Operations.
Step 3: Test Event Streams Operations
In order to test the Event Streams instance you will use two of the sample applications that are provided with Event Streams. These applications have already been created in your lab image. (Refer to Appendix A - Create Event Streams Sample Applications for information on how to create the sample applications.) The first sample will act as a consumer of messages that have been sent to a specific topic. The second sample will act as a producer of messages on a given topic.
In order to connect with your specific Event Streams instance you will need to pass in the credentials that were copied in step 2: Create a Event Streams Instance. The credentials are in JSON format. You will need to use the following values from the credentials:
-
kafka_brokers_sasl
Note:
You will need to concatenate these values into a single text string, separated by commas and enclosed in double quotes. For example: “host1:port1,host2:port2,host3:port3” -
api_key
Tip:
Store these values in environment variables for use when you launch the sample applications. For example, store the concatenated values for kafka_brokers_sasl into an environment variable named kafka_brokers_sasl. Then, when you launch the sample applications you can simply use the environment variable $kafka_brokers_sasl rather than typing out the entire string.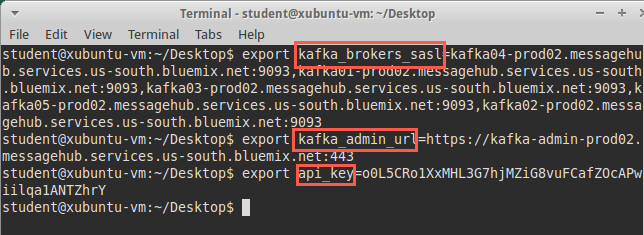
Perform the following steps to launch the sample applications and observe the operation of Event Streams.
-
Start the sample message consumer by entering the following command:
 cd /home/student/event-streams-samples/kafka-java-console-sample/
 java -jar build/libs/kafka-java-console-sample-2.0.jar $kafka_brokers_sasl $api_key -consumer -topic pot_topic
Note:
Do not close this window or stop this application since you will need to keep the message consumer active for the next lab exercise. - Start the sample message producer by completing the following steps.
- Open a second command prompt window.
- Set the environment variables as described in the tip above.
- Navigate to the samples directory and start a message producer using the following commands:
cd /home/student/event-streams-samples/kafka-java-console-sample/java -jar build/libs/kafka-java-console-sample-2.0.jar $kafka_brokers_sasl $api_key -producer -topic pot_topic -
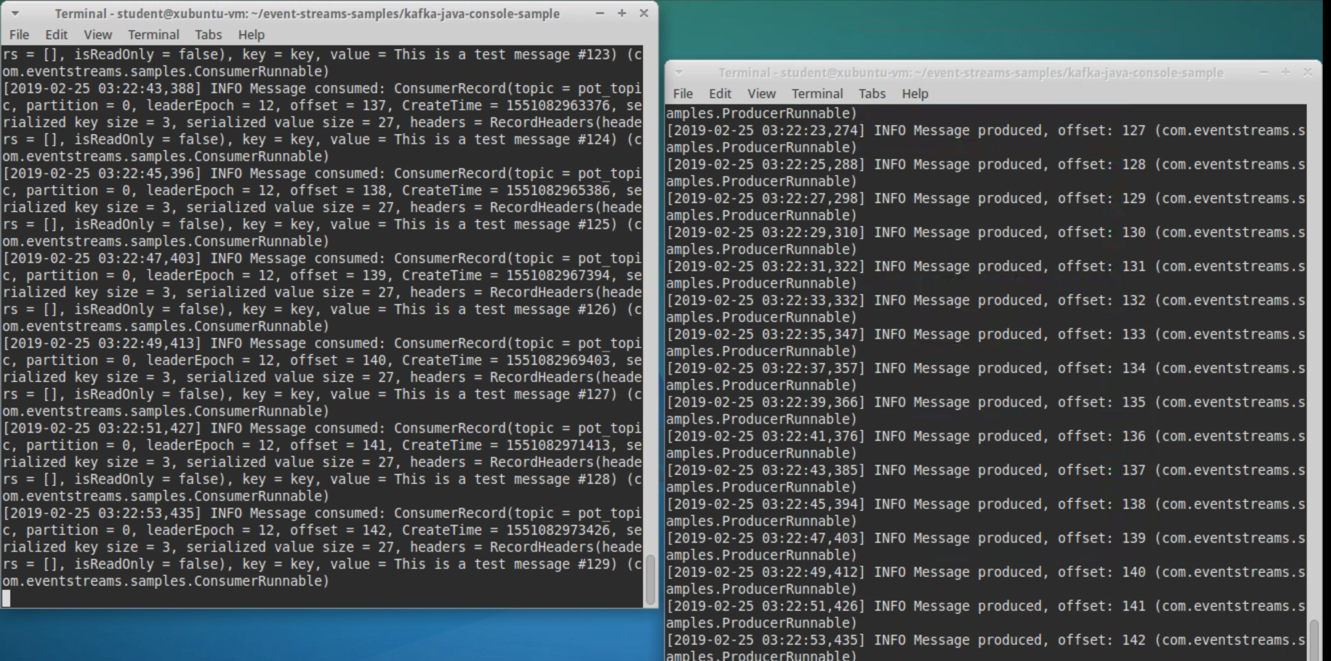
Observe the behavior of the two sample applications. Note that for every message produced by the Producer application the Consumer application will receive and print the content of the test message.
-
Return to the Event Streams browser window and then click on the Manage link.
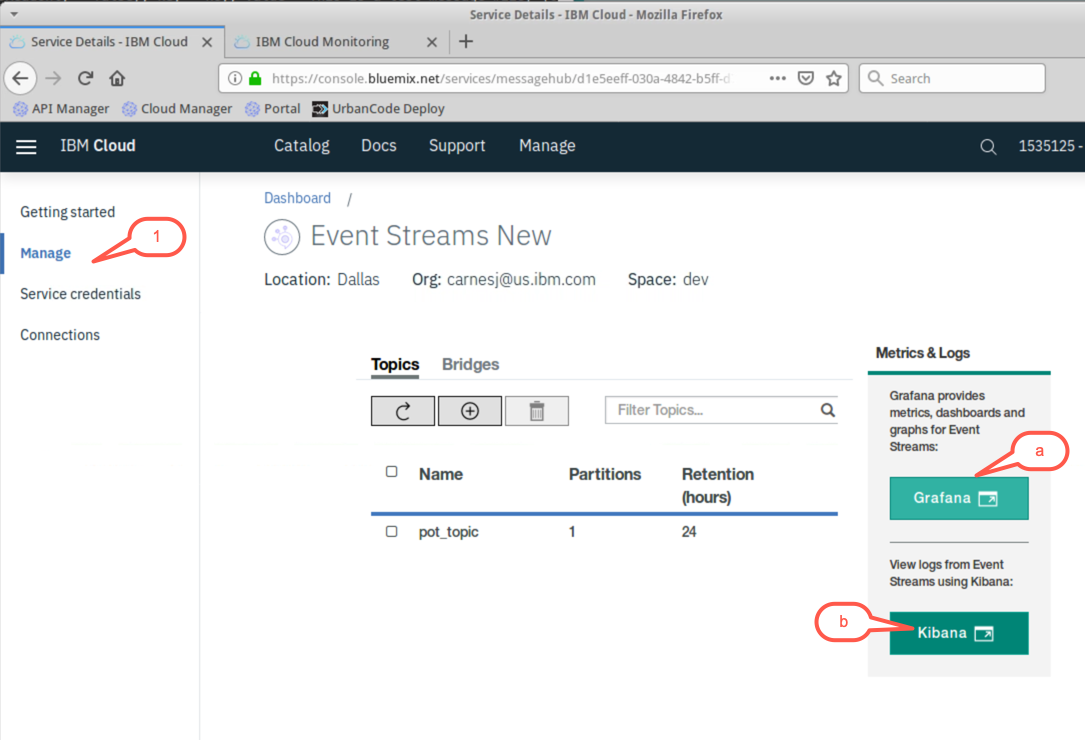
- IBM Event Streams includes two dashboard views that provide the following:
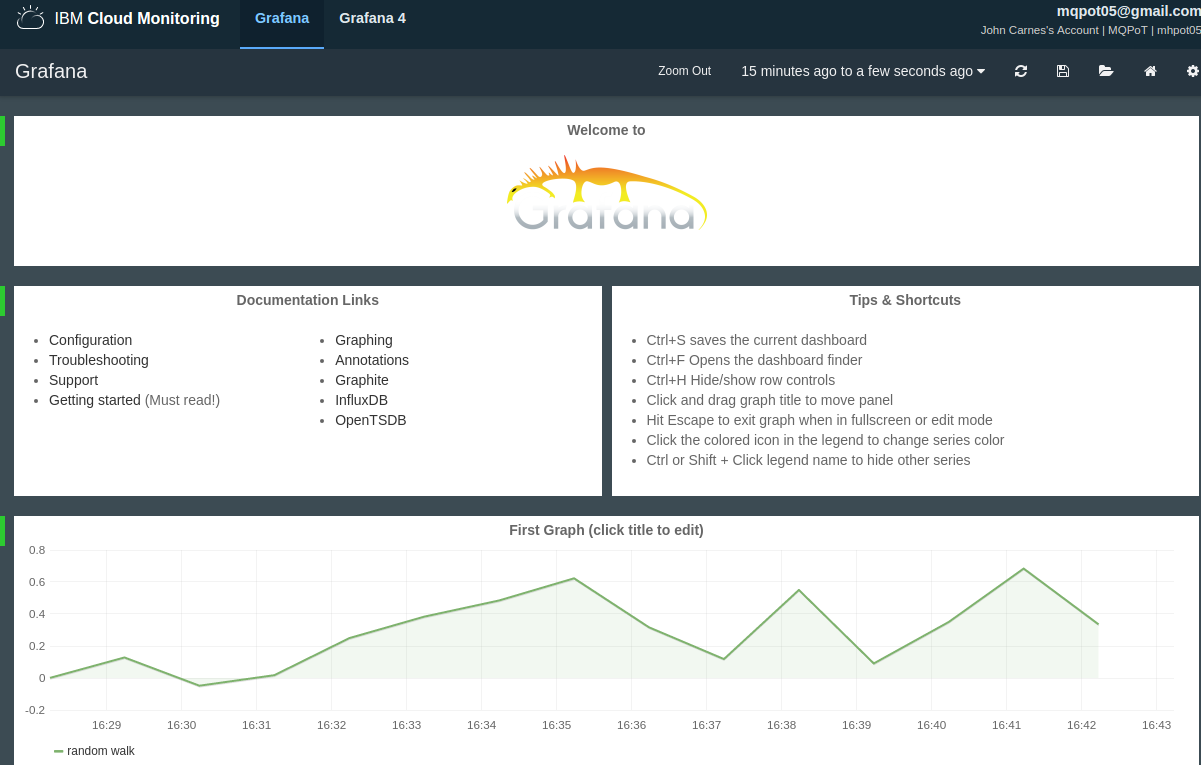
- A Grafana based dashboard that provides a graphical view of the message activity in the Event Streams instance.
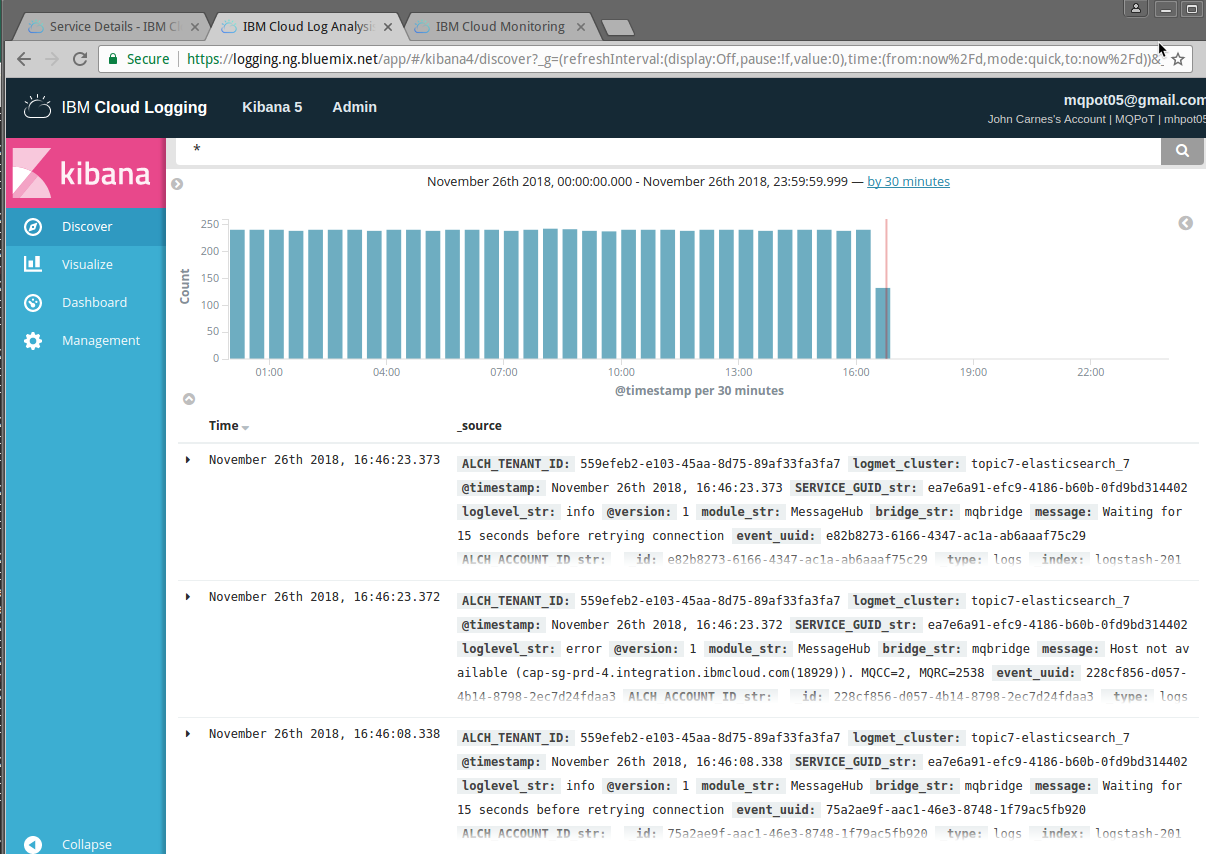
- A Kibana based dashboard that shows log messages for the Event Streams instance.
Take a moment to explore each of these dashboards. When you have finished exploring the dashboard(s) leave the browser open to the Event Streams instance and then exit the message producer sample application.
Note:
Leave the message consumer sample application active since you will use it in the next lab exercise.
Congratulations
You are now ready for Lab 2 exercise.