Overview
This lab exercise assumes that you have an existing IBM Cloud Private (ICP) instance provisioned and have loaded the IBM Event Streams assets to the Docker and Helm repositories that the ICP instance uses.
In this lab exercise you will create an instance of IBM Event Streams and test its operation using a sample application that generated from Event Streams.
Prerequisites
You have two options that you may use as a starting point for this lab.
- You may use the ICP instance that has been pre-built in Skytap. To use this option you must create a new environment from the IBM Event Streams Installed on ICP 3.1.1 - 20190221 Skytap Template.
- If you have successfully completed Lab 3 - IBM Event Streams 3.1 pre-Installation on ICP 3.1.1 - 20190310 you may use that Environment as the starting point for this lab.
Step 1: Install the Event Streams Helm Chart
ICP offers the option to install Helm charts from a command line interface (CLI) as well as using the admin console. Automated deployment tools typically use a CLI to deploy Helm charts. For this lab you will install IBM Event Streams via the Helm chart that was added to the ICP Catalog. Perform the following steps to login to ICP and install the Event Streams Helm chart.
-
From the ICP Master VM image open a web browser and then navigate to the following URL: https://mycluster.icp:8443/
Note:
You may see a warning message related to an insecure connection. This is due to the fact that the default installation of ICP using self signed certificates. It is safe to simply use the self signed certificate and proceed with the lab exercise.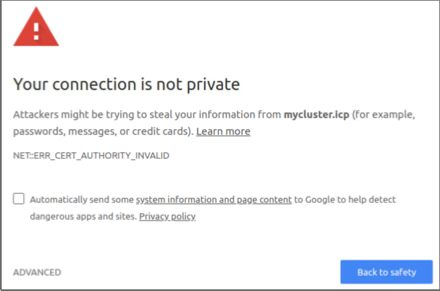
-
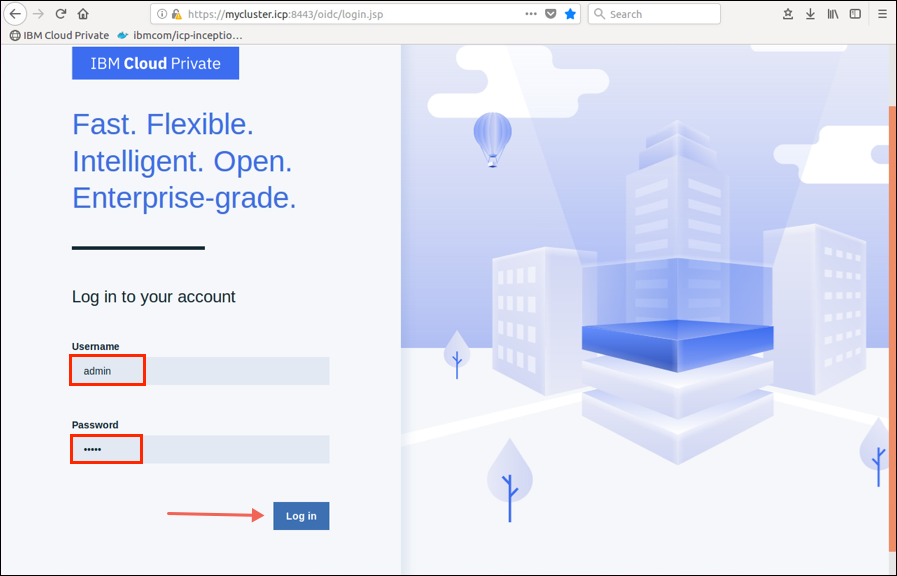
Login to ICP by entering admin as the Username and Password and then click on the Log in button.
-
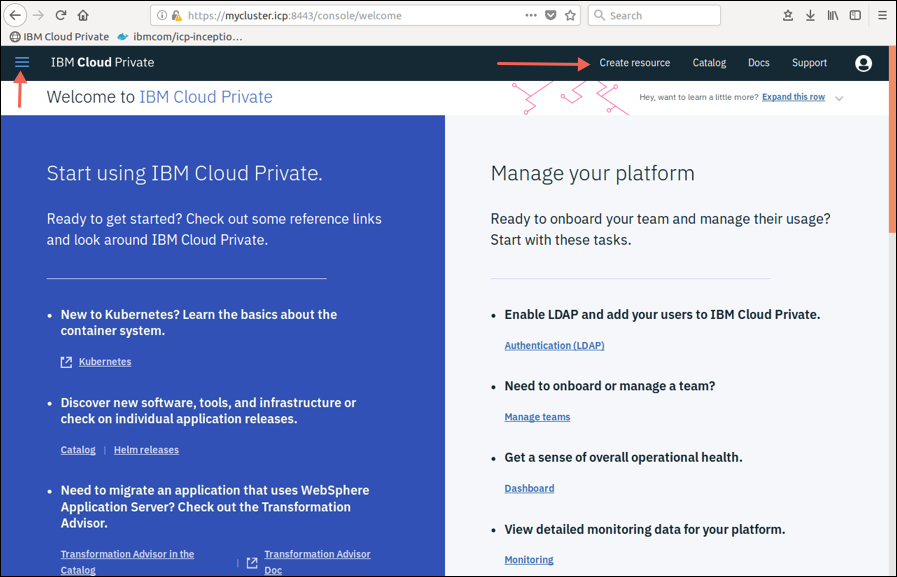
The Welcome to IBM Cloud Private page will be displayed. If this is the first time you have worked with ICP take a moment to explore the console by using the menu icon (referred to as the “hamburger” menu) in the upper left of the page and the tabs along the upper right side of the page.
-
The first action you should take when installing new assets such as Event Streams is to determine which Kubernetes Namespace should be used to install assets into. Like many other uses of namespaces, an ICP Namespace is used to provide a mechanism to categorize assets. This will help to minimize naming conflicts as well as provide the ability to control access to assets within the namespace.
Important:
You must use a namespace dedicated for use by IBM Event Streams to ensure that the network access policies created by the chart are only applied to the Event Streams installation. Installation to the default namespace is not supported. -
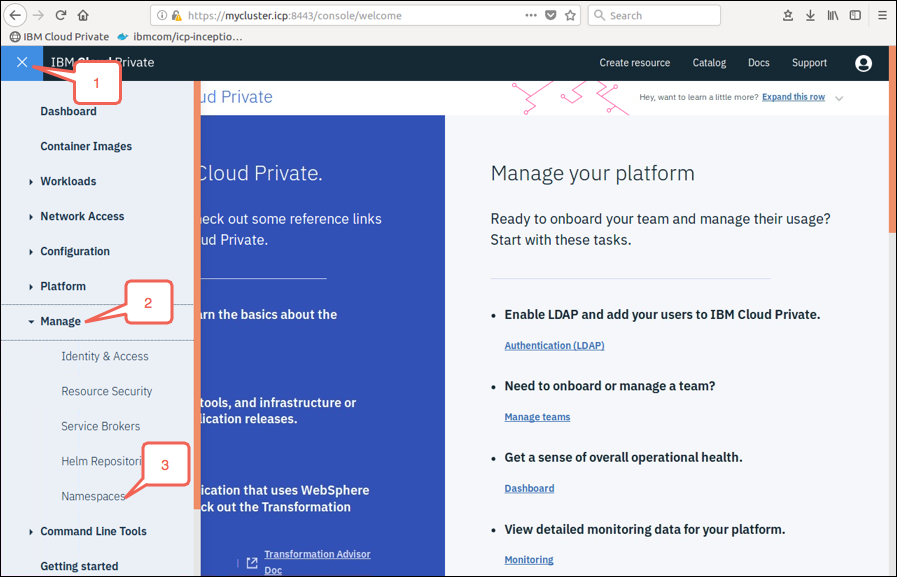
Click on the hamburger menu and then click on the Namespaces menu under the Manage category to view all of the existing Namespaces defined in ICP.
-
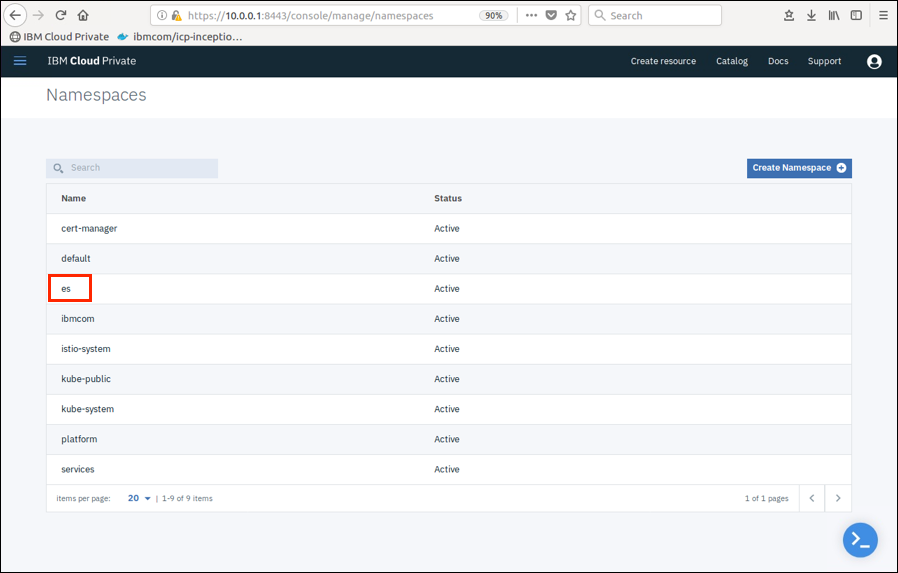
A list of the currently defined Namespaces is displayed. You will use the existing es namespace to install Event Streams.
-
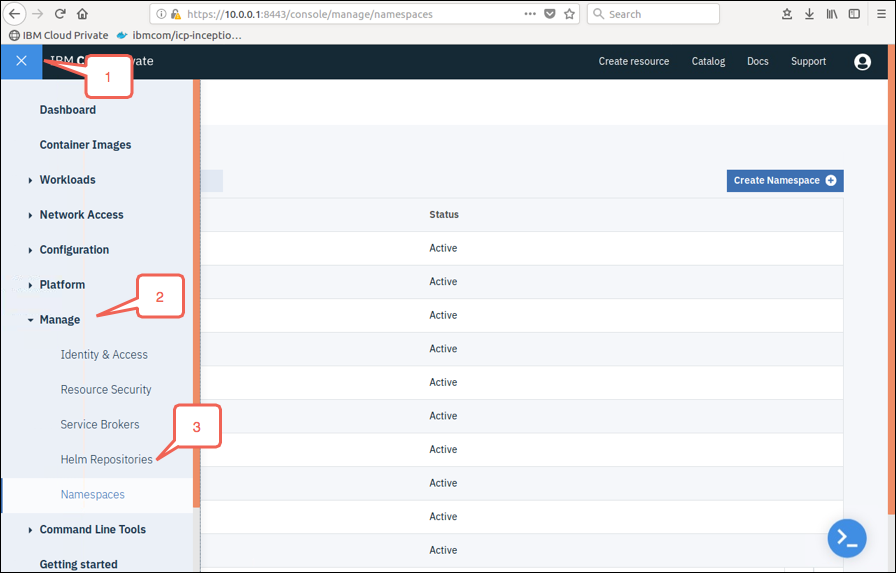
You are now ready to proceed to install the Event Streams Helm chart. Before you access the ICP Catalog you should synchronize the Helm chart repositories in your ICP instance. Click on the hamburger menu and then click on the Helm Repositories menu under the Manage category.
-
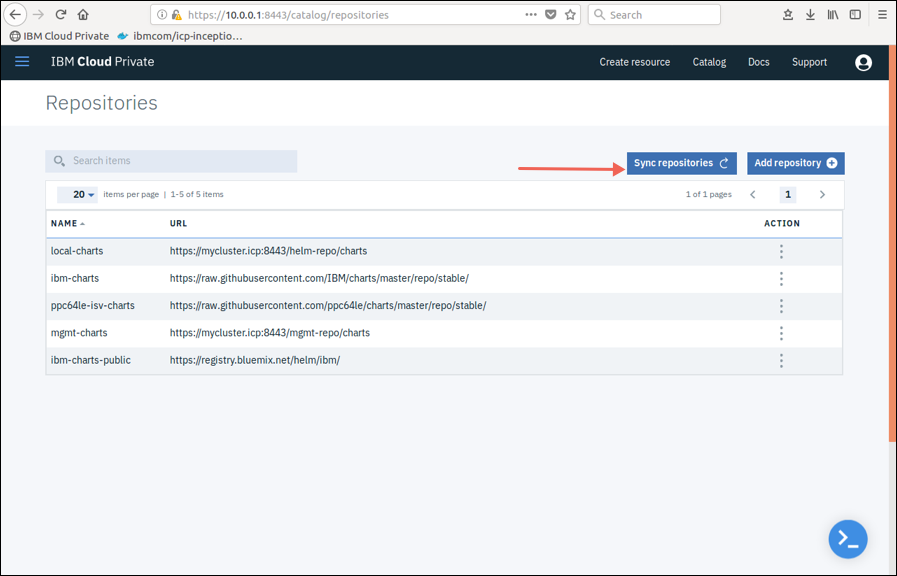
Click on the Sync repositories button to ensure that all of the Helm charts are up to date.
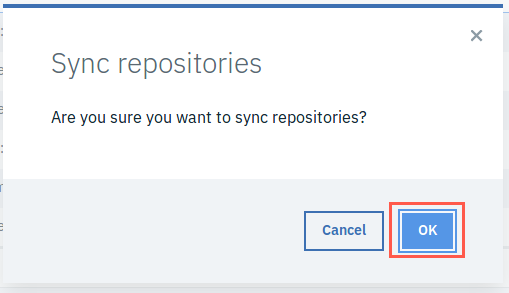
Click OK to confirm you want to sync repositories.
 Note:
Note:
Take note of the message stating that synchronization may take a few minutes to complete. The lab environment normally won’t take too long to complete the synchronization step. -
Now that you have identified a Namespace to use for your Event Streams installation, and you have synchronized your Helm chart repositories, you will need to open the ICP Catalog to start the installation process. Click on the Catalog tab to open the ICP Catalog.
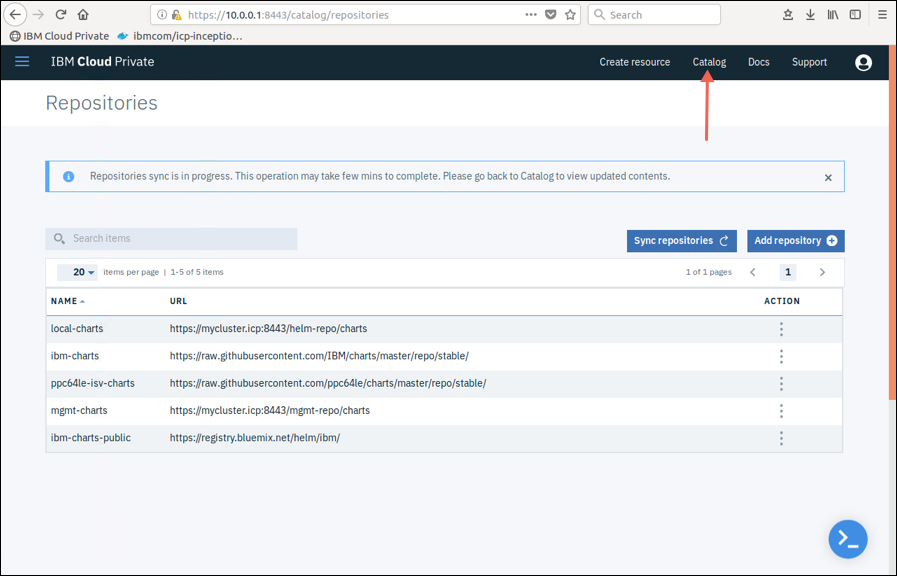
-
A list of all of the Helm charts that are available to install is displayed. Click Integration from the category list on the left side of the panel. Locate and then click on the ibm-eventstreams-prod Helm chart.
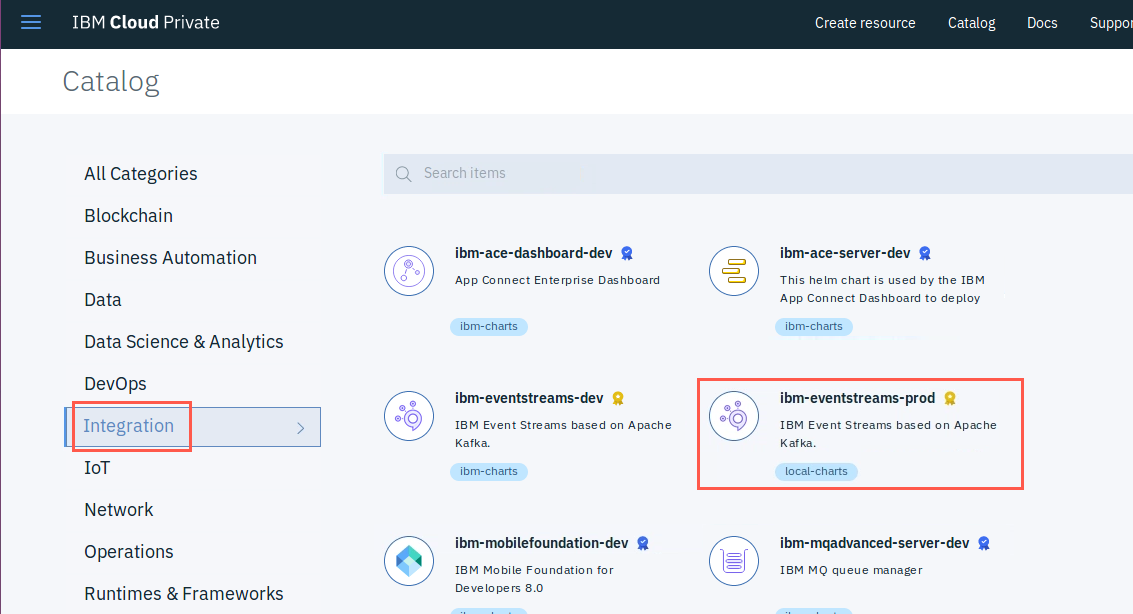
-
Take a moment to review the Overview page to become familiar with all of the configurable options that are available for Event Streams. As you might expect, this Helm chart creates a number of ICP configuration objects and offers the ICP administrator a number of configurable options to customize their installation. Click on the Configure button when you are ready to proceed.
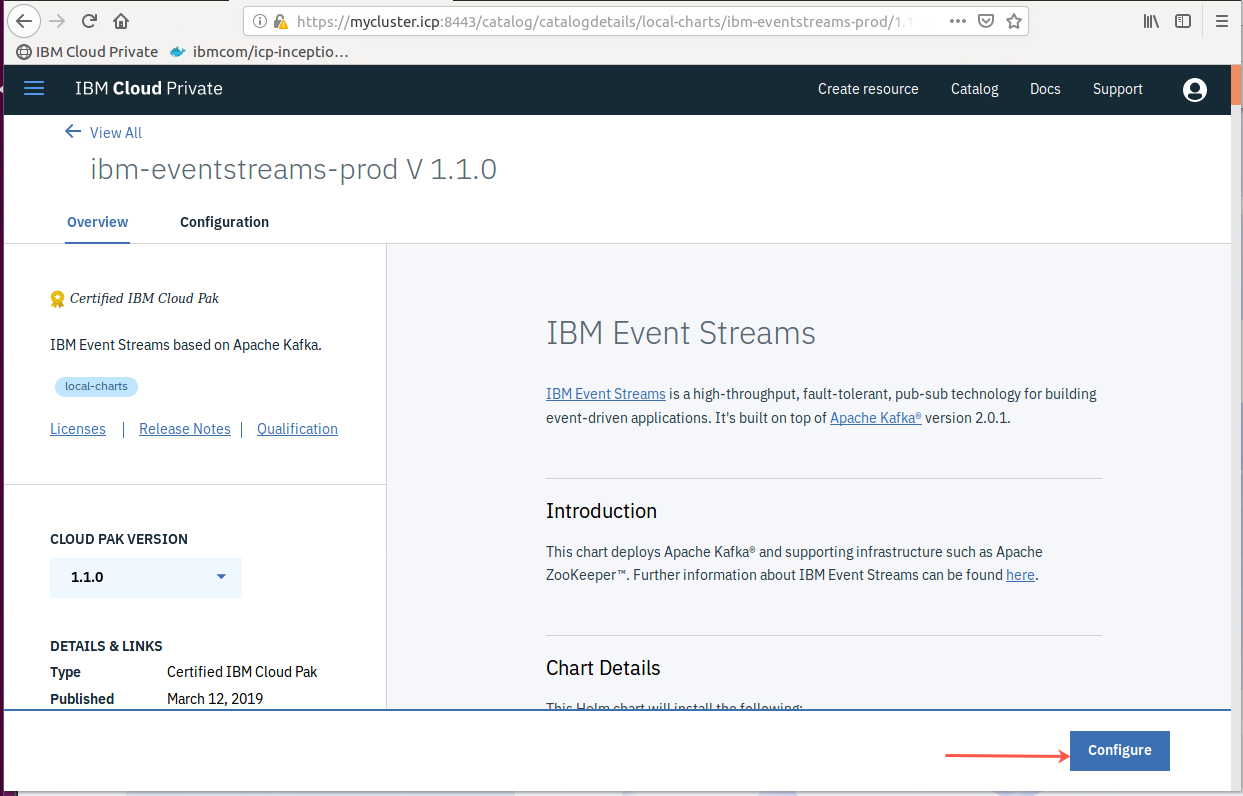 Note:
Note:
This lab exercise will create the minimum environment required for Event Streams to operate. You should refer to the documentation for Event Streams for information on how to create a more robust installation. https://ibm.github.io/event-streams/about/overview/ -
Enter eslab as the Helm release name and then select the es Target namespace. Also select the license agreement checkbox.
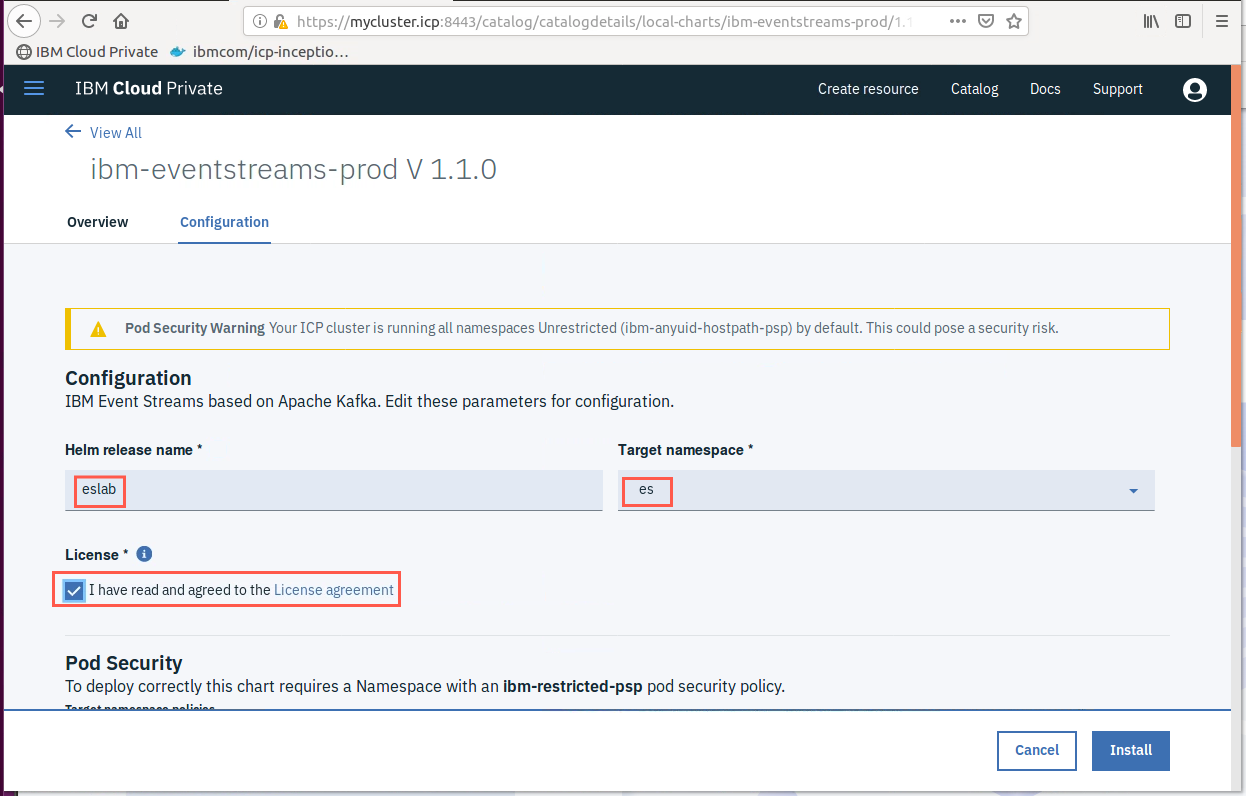 Note:
Note:
The Helm release name is specific to this lab exercise. The remaining lab steps refer to the eslab Helm release. -
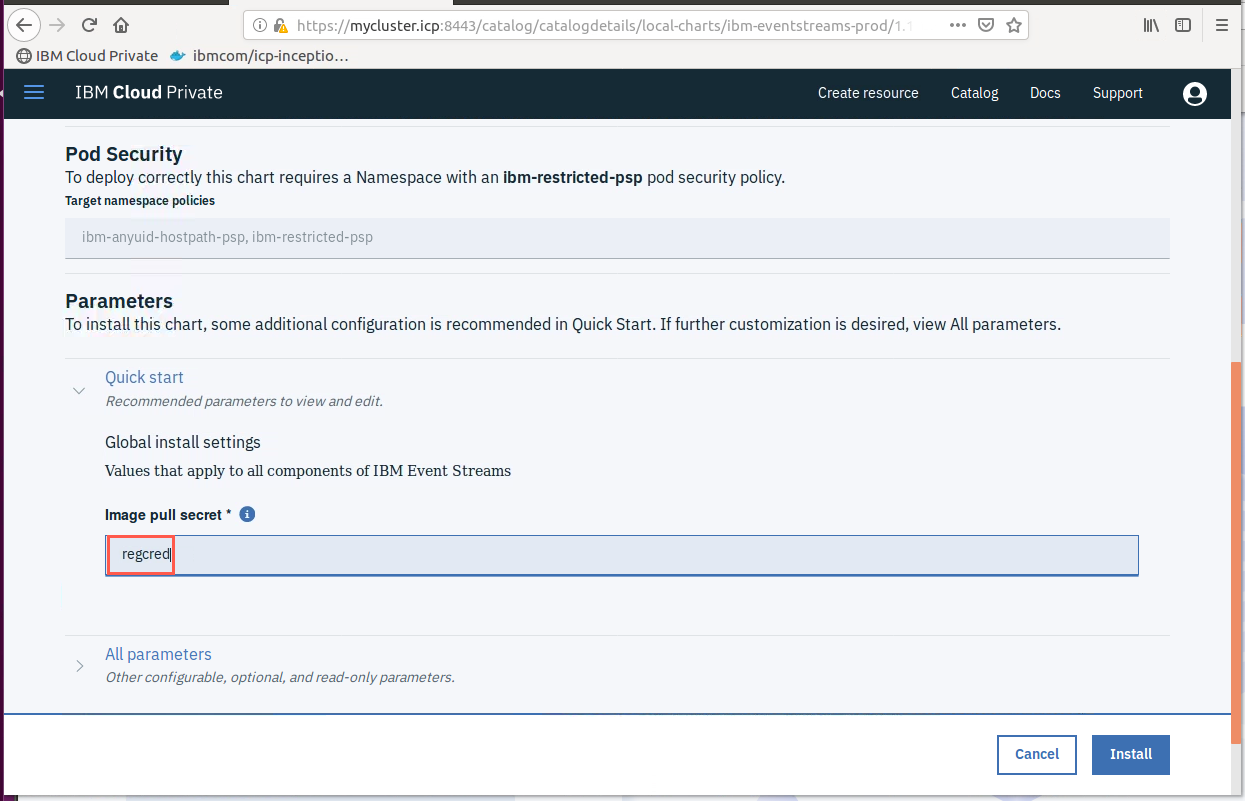
Scroll down and (if necessary) expand the Quick start section. Enter regcred as the Image pull secret.
 Note:
Note:
The Image pull secret is specific to this lab exercise. The Image pull secret was created when the Event Streams installation package was installed into ICP. (This was created in Lab 3.) -
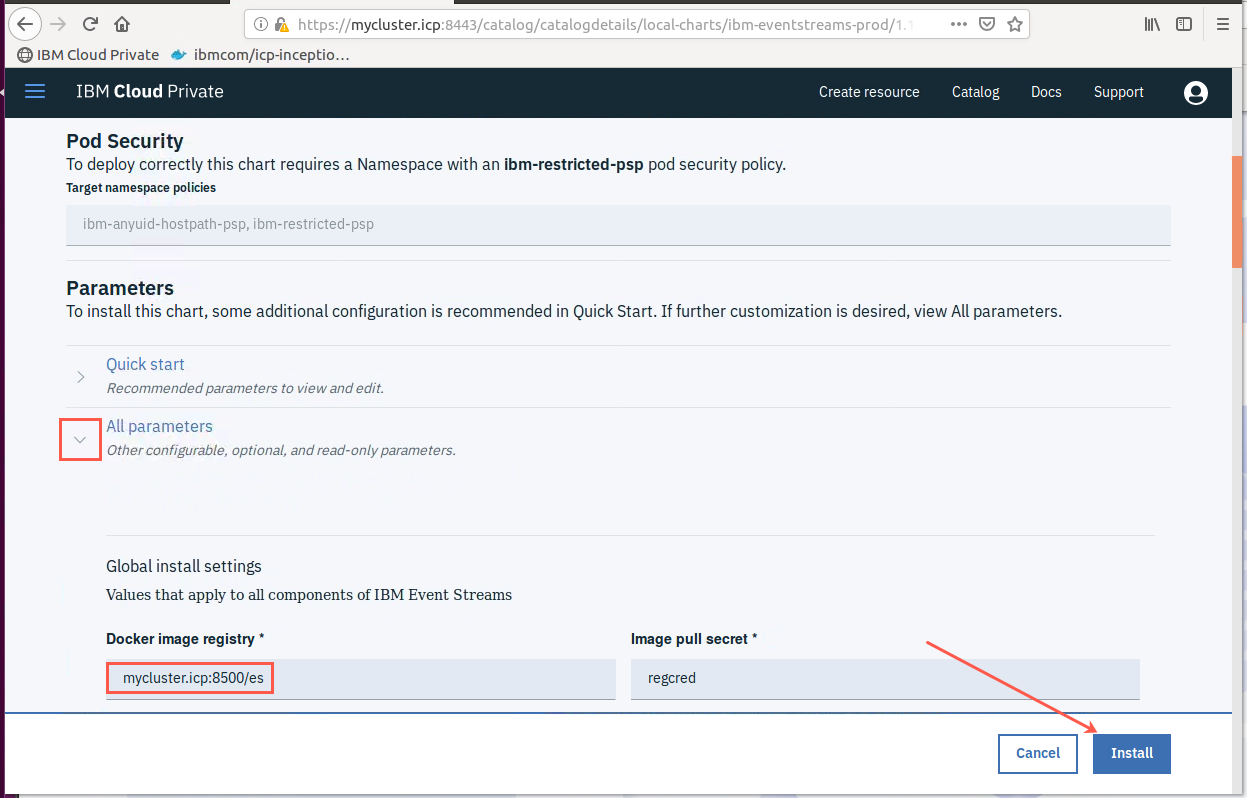
Expand the All parameters section and ensure that the Docker image registry value does not include a trailing slash. The URL should be: mycluster.icp:8500/es. (This is a typo in the Helm chart that will be corrected.) Click on the Install button to start the installation.
-
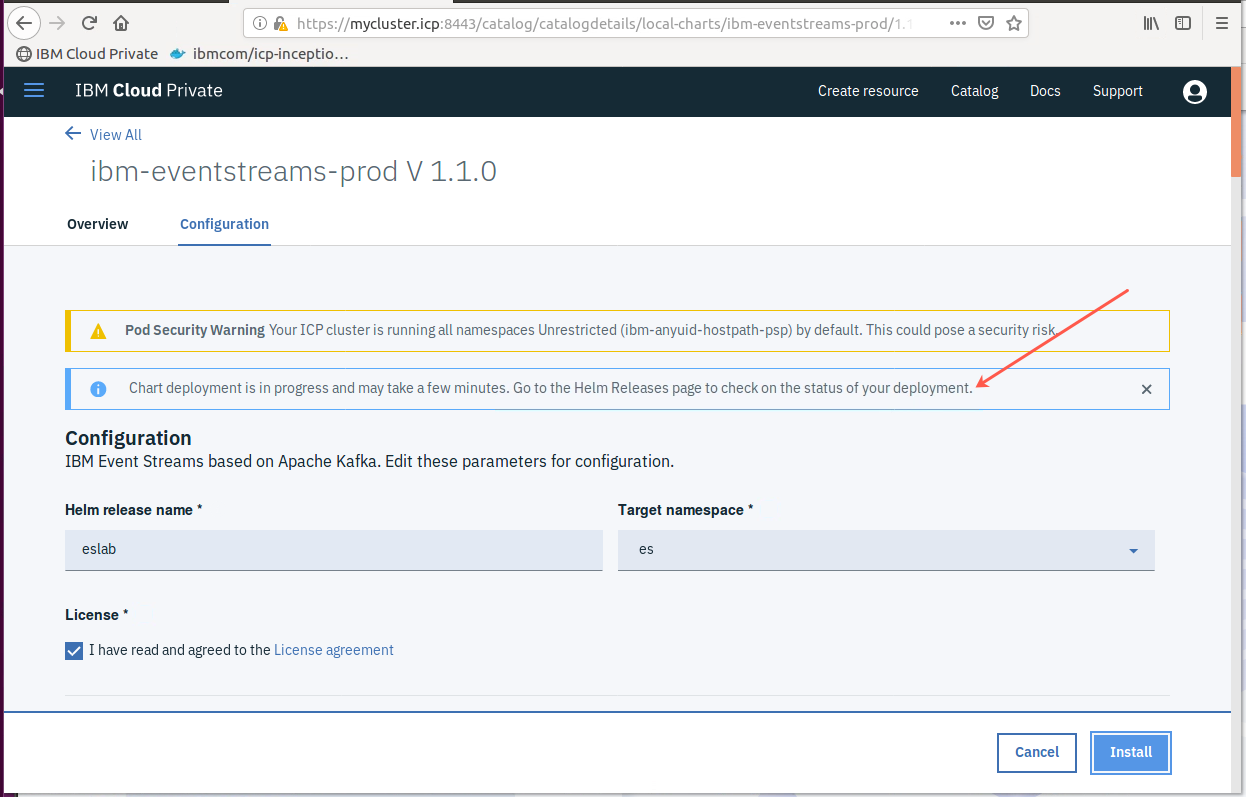
The installation will take a few minutes to complete. You receive a message that the deployment is in progress. You also receive a warning that namespaces are running with the default pod security policy. You may ignore this as you included a more restrictive policy for the es namespace in a previous step.
-
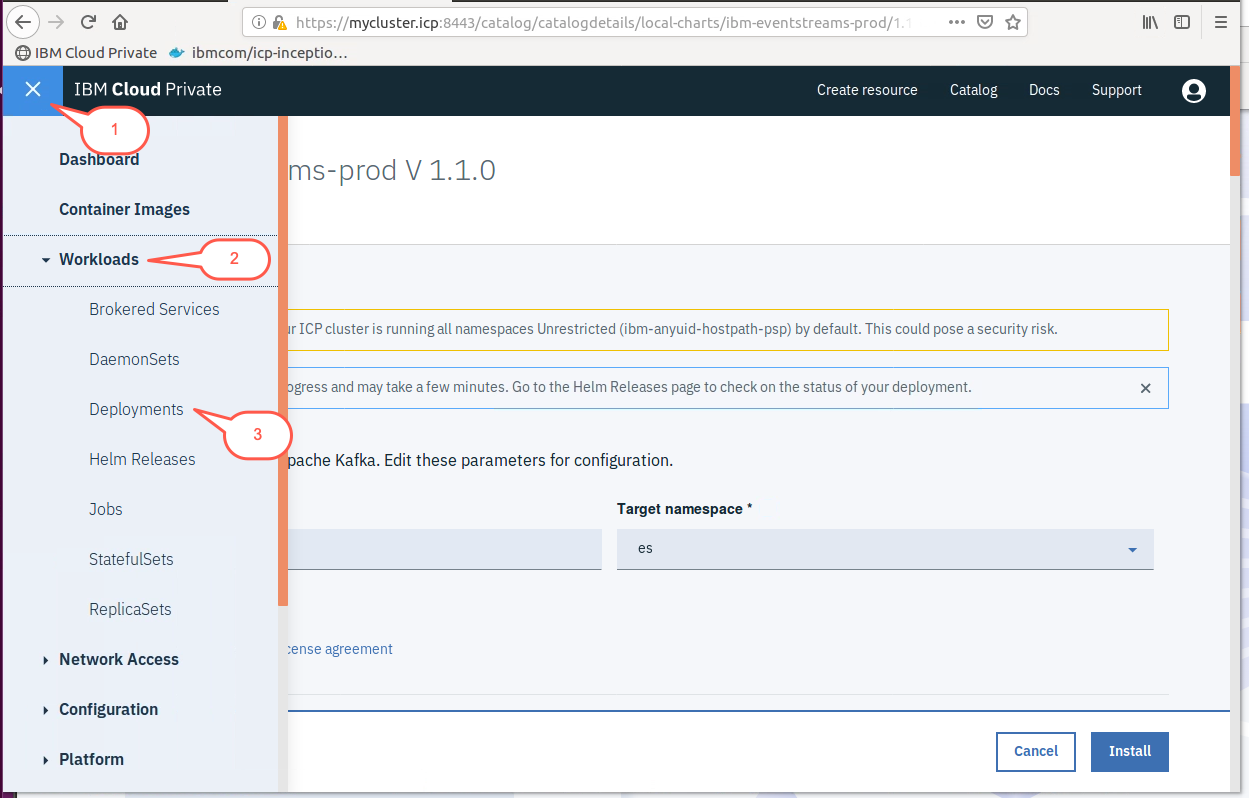
Check on the status of the deployment by clicking on the hamburger menu and then click on the Deployments menu item under the Workload category.
-
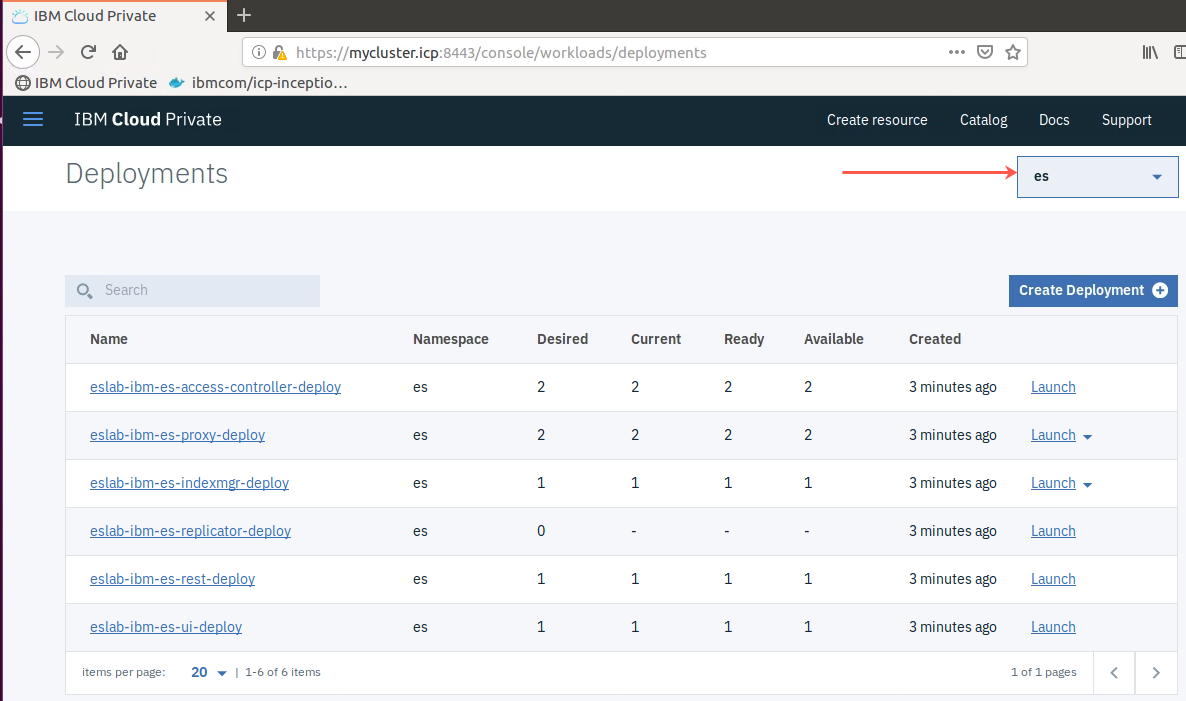
A list of the Helm deployments will be displayed. Select the es namespace in the upper right corner of the page to view just the assets that are related to Event Streams.
-
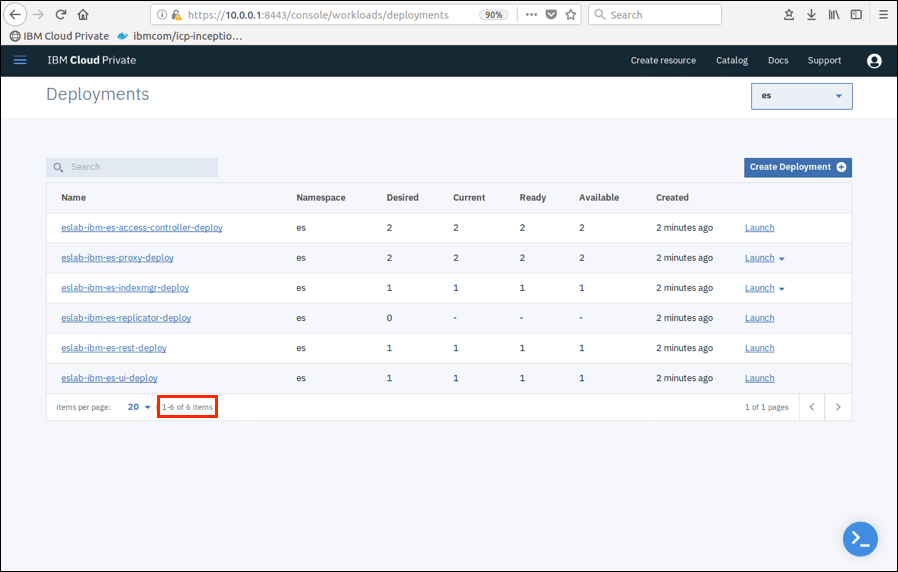
Compare the columns for each row that is displayed. When the Event Streams installation is ready you will see the values of the Desired, Current, Ready and Available columns all display the same value for each row. Scroll to the bottom of the page and you should see that a total of 6 items are displayed.
 Note:
Note:
There may be one or more deployments that are set at 0 for the Desired count. This is expected for a minimum configuration. -
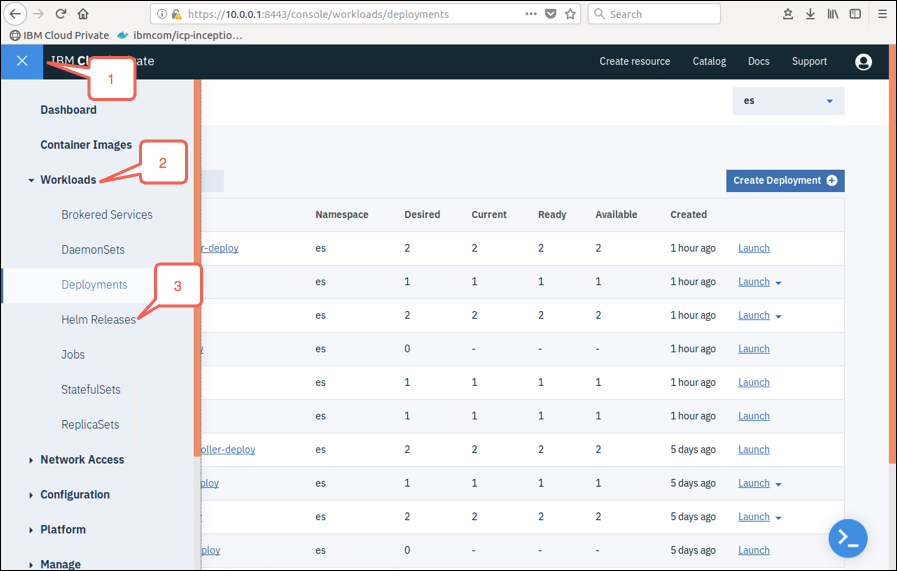
Now that you have deployed Event Streams and you have verified that all of the deployments have completed their startup you will need to open the user interface for Event Streams. Click on the hamburger menu and then click on the Helm Releases menu under the Workload category.
-
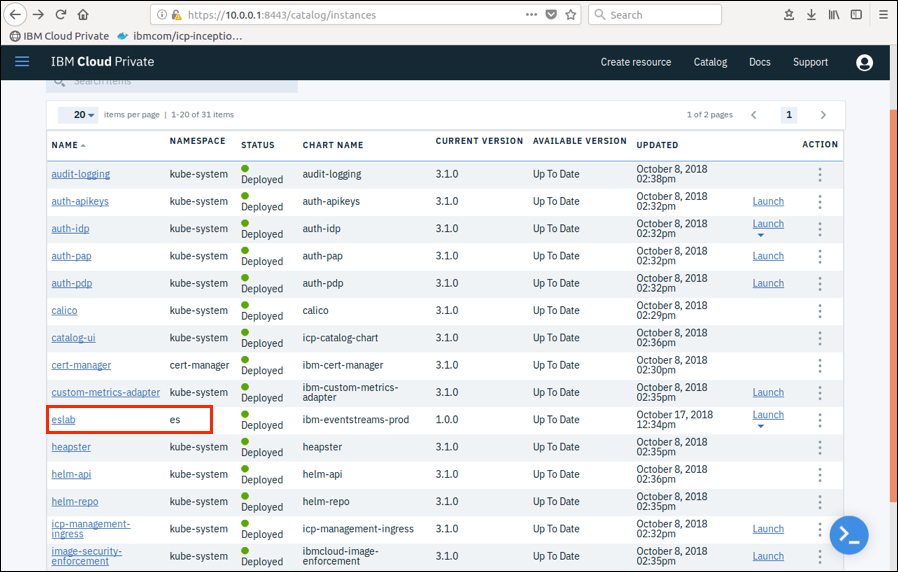
Click on the eslab Helm release to view the various assets that have been deployed for your Event Streams instance.
-
There are a number of ICP assets that are deployed via the Event Streams Helm chart. Take a moment to review the assets that were deployed. From this page you can open the Event Streams admin console by clicking on the Launch button in the upper right corner of the page and then click on the admin-ui-https link.
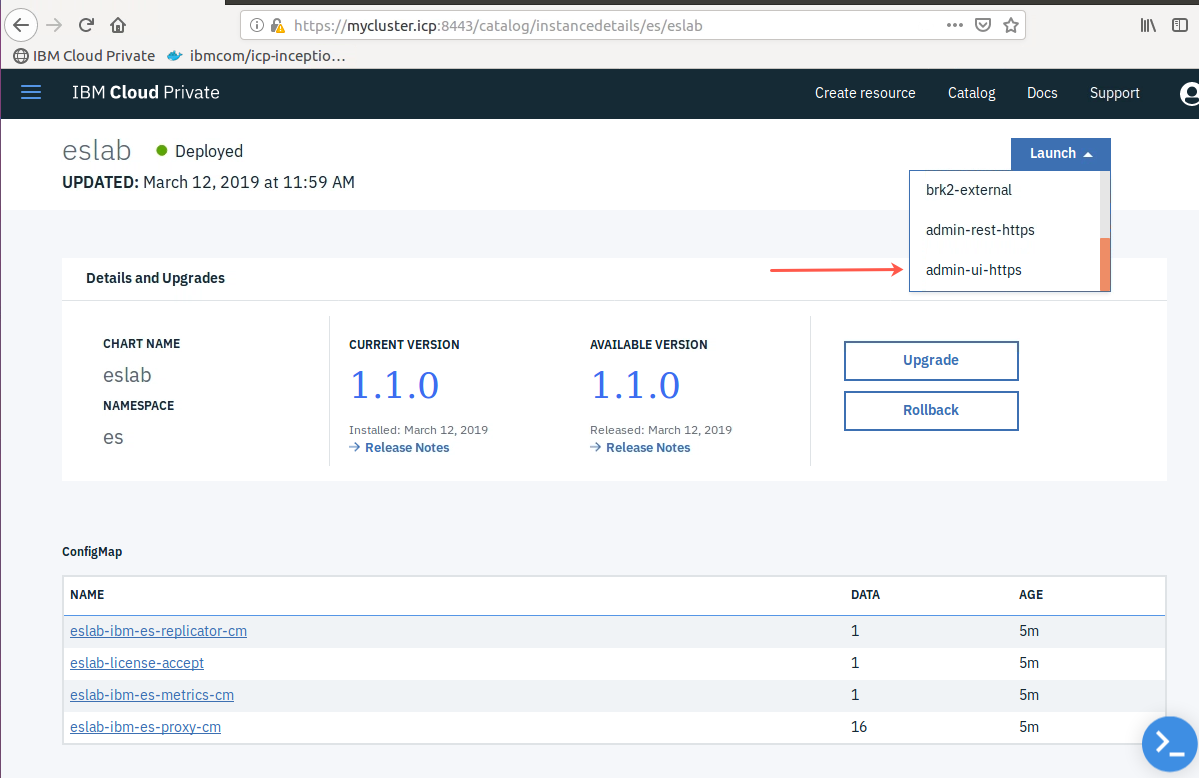 Note:
Note:
You may see a warning message related to an insecure connection. This is due to the default installation of ICP using self signed certificates. It is safe to simply use the self signed certificate and proceed with the lab exercise. -
If the Your connection is not secure error message is displayed then you will see a new browser tab open and an OAuth error will be displayed.
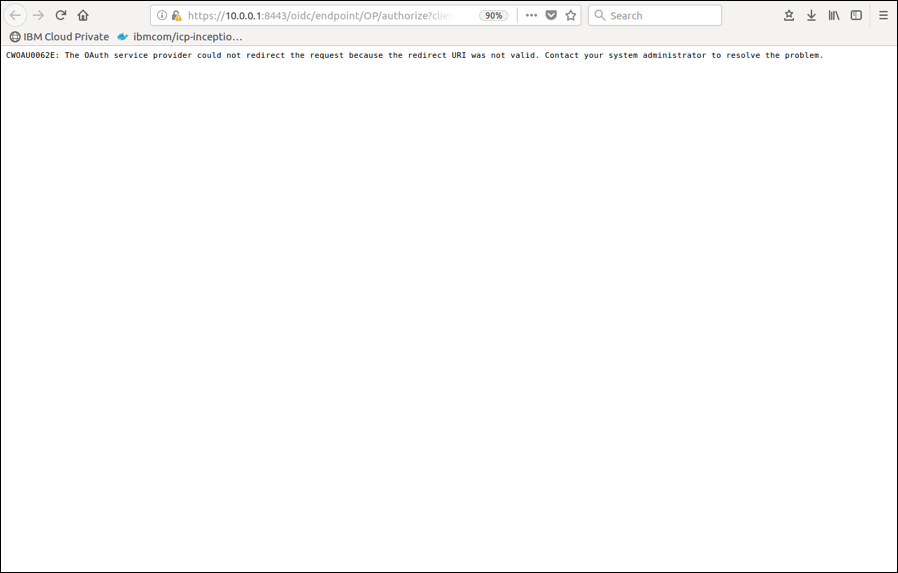
-
If the OAuth error appears you will need to open the Event Streams admin console from the link in the eslab-ibm-es-ui-svc Service to continue. Locate and then click on this entry in the Service section of the page.
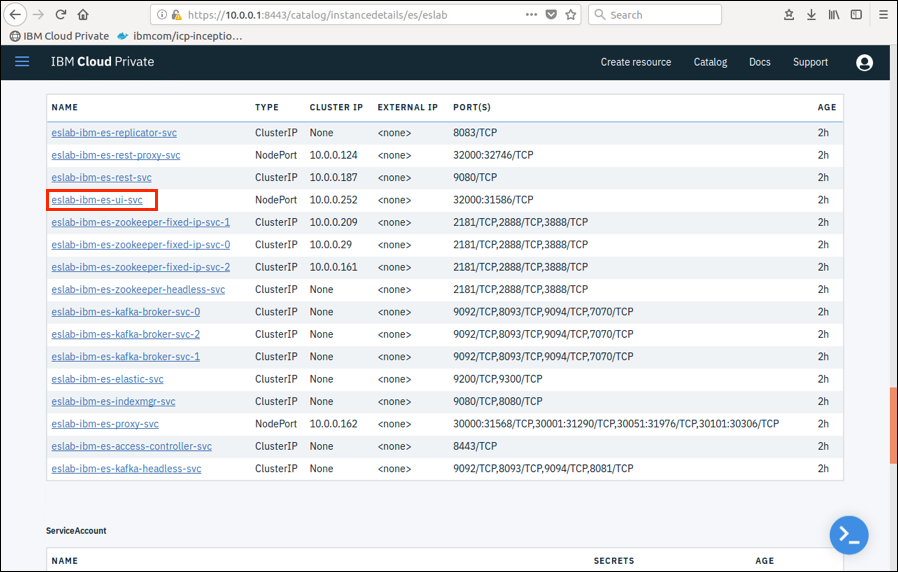
Locate the Node port entry and then click on the hyperlink for the admin console. Note that the port number of this entry may be different in your lab machine.
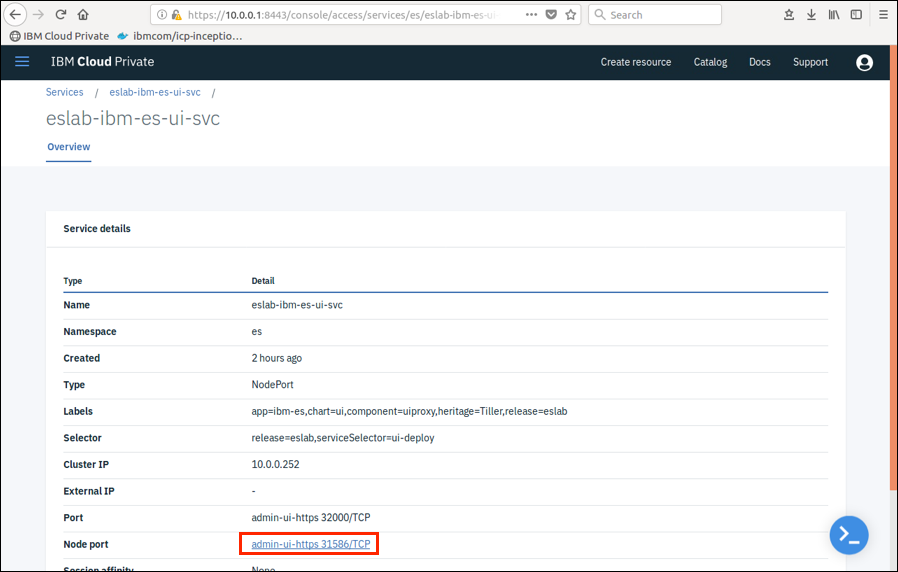
-
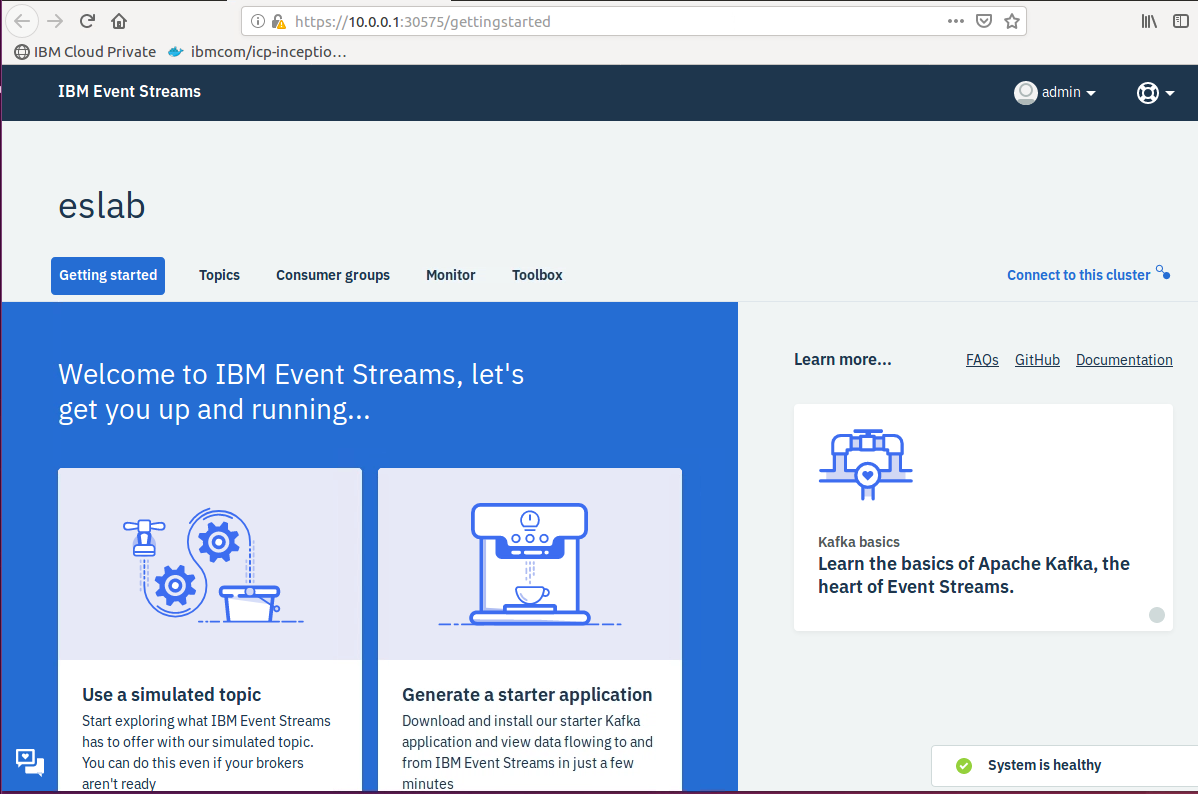
A new browser tab will open and the Event Streams admin console will appear. Note that it may take some time the first time that you access this page.
-
Take a moment and explore the Learn the basics of Apache Kafka tile on the main page. You should also note the System Health indicator in the bottom right corner of the page. Expand this to see the entries for each component in your Event Streams deployment. When you are ready you may proceed to Step 2: Managing Event Streams Topics.
Step 2: Managing Event Streams Topics
Event Streams applications write to and read from entities called Topics, which is a grouping of related data which is known to the applications that produce and consume data. Applications connect to Topics. Topics are created and configured once only by the Event Streams administrator.
The deployment of Event Streams conveniently creates a “simulated” topic which allows you to quickly familiarize yourself with the configuration and management of topics and the messages which are stored on them, before creating any configuration yourself. Perform the following steps to work with the simulated topic that has been created.
-
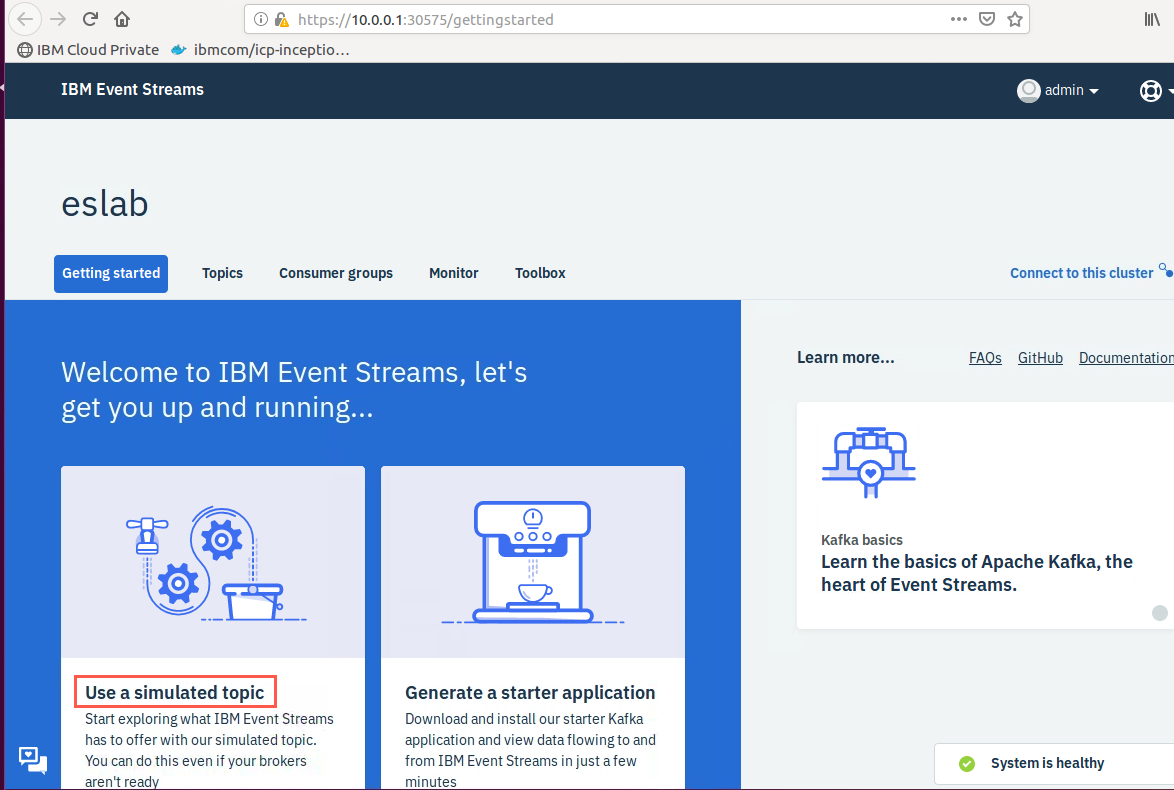
Click on the Use a simulated topic tile to open Topics tab.
-
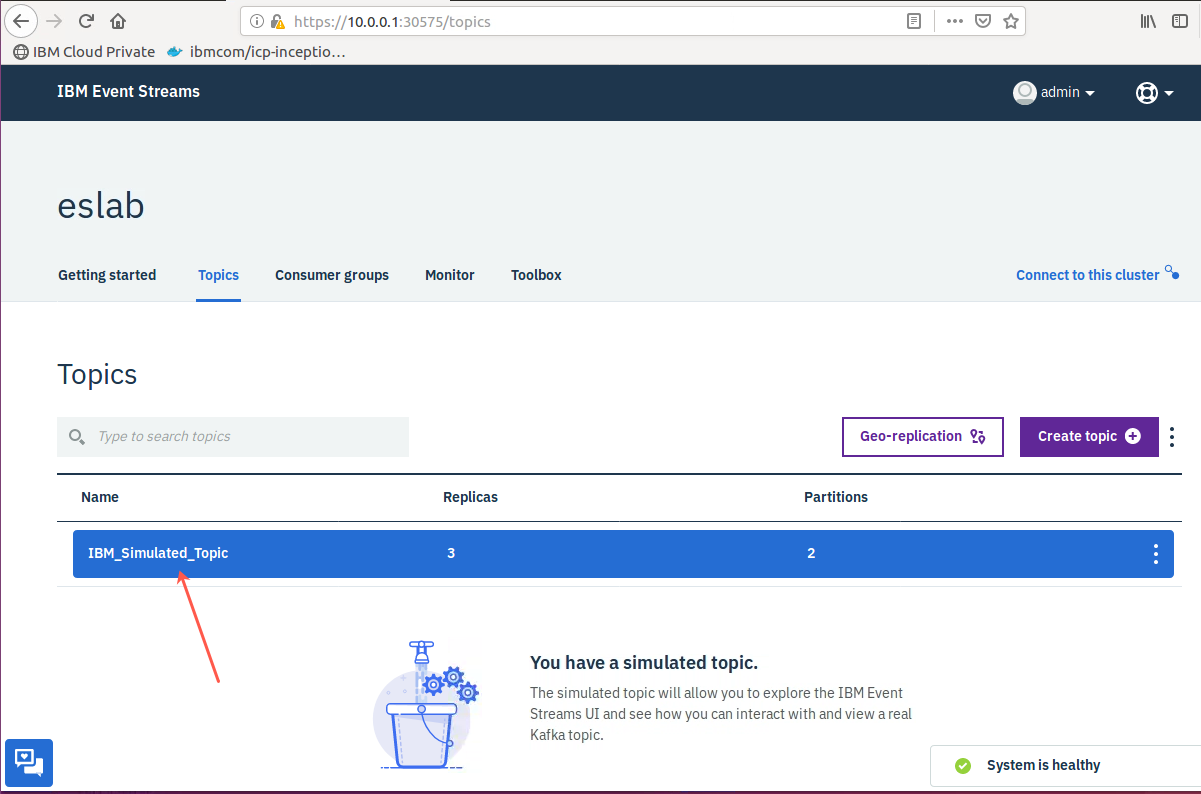
The Topics tab is used to manage the Topics that have been configured for your installation. Note the IBM Simulated Topic entry that has been created during installation. Click on this entry.
-
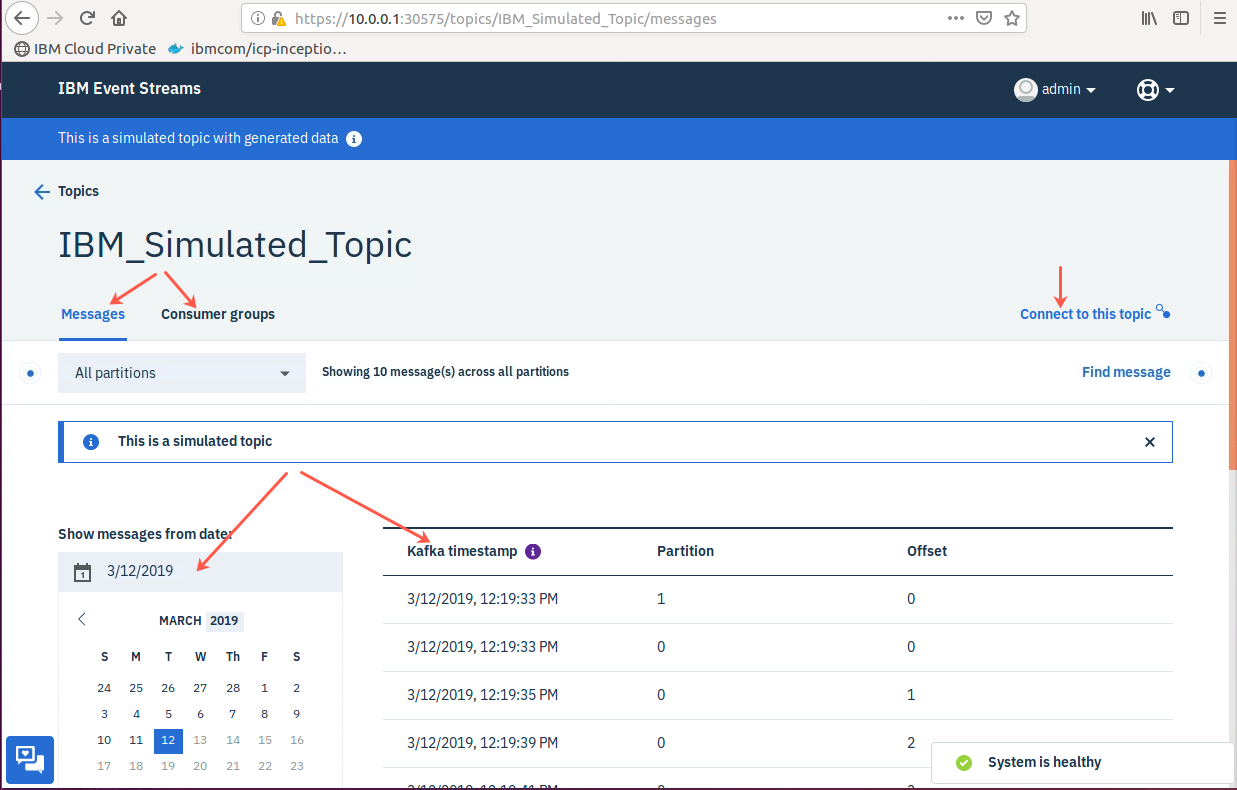
The view opens at the Messages tab for the selected Topic. Note that a calendar widget and a table that contains a list of sample messages and their associated partition and offset is displayed. Take a moment to explore each of the tabs along the top of this page.
-
Now that you’ve explored Topics a little using the simulated Topic, you will configure a real topic to use in validation and application testing. A starter application will be used to do that validation. Return to the Topics tab by clicking on the link in the top left portion of the page.
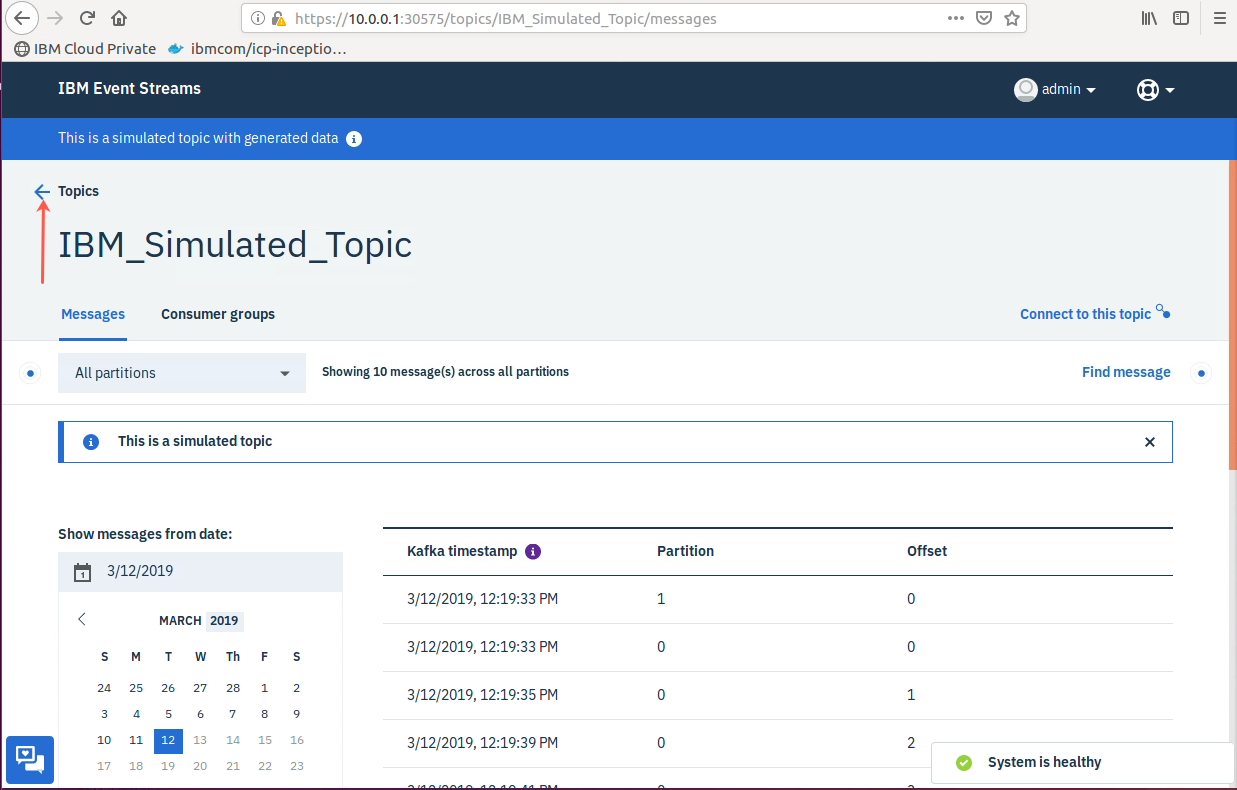
-
Click on the Create topic button. A wizard will launch to help guide you through creating your new Topic.
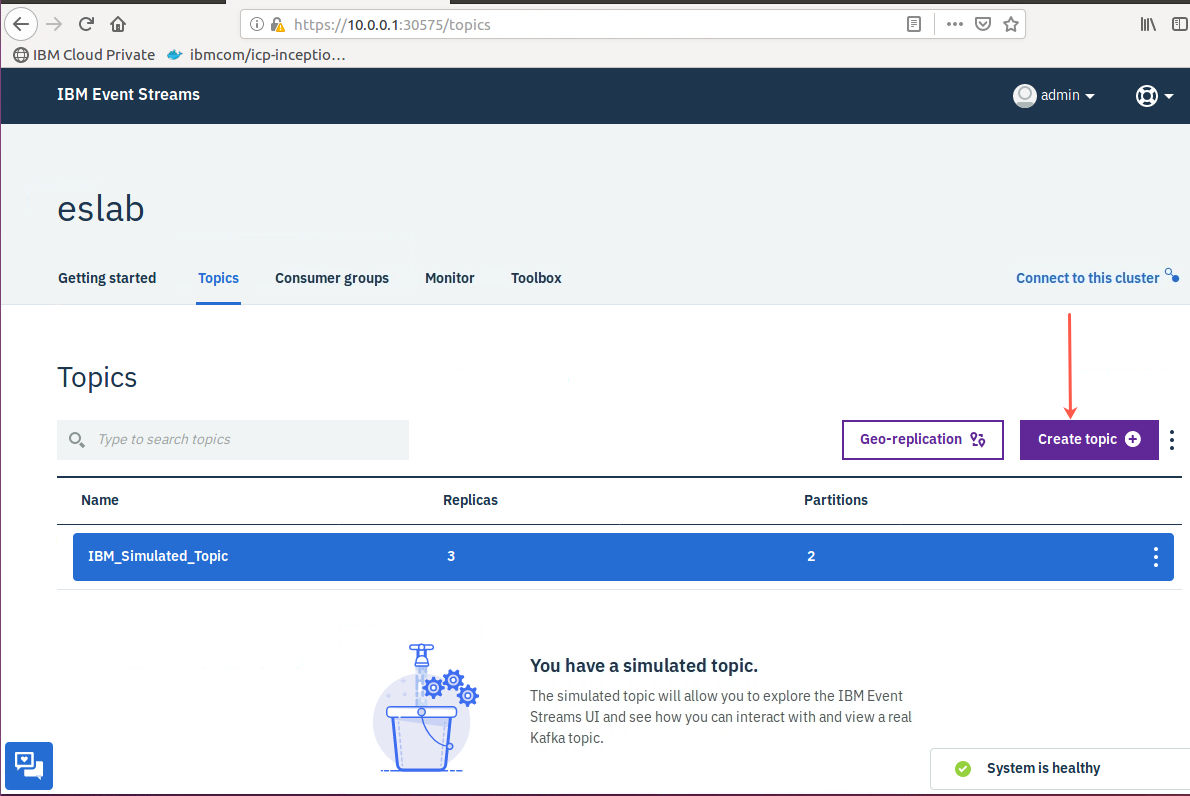
-
Enter eslab as the Topic name. Note that there are restrictions on the characters that can be used in the Topic name. Expand the Advanced view and examine the detailed configuration parameters which may be specified. Click on the Next button when you are ready to proceed.
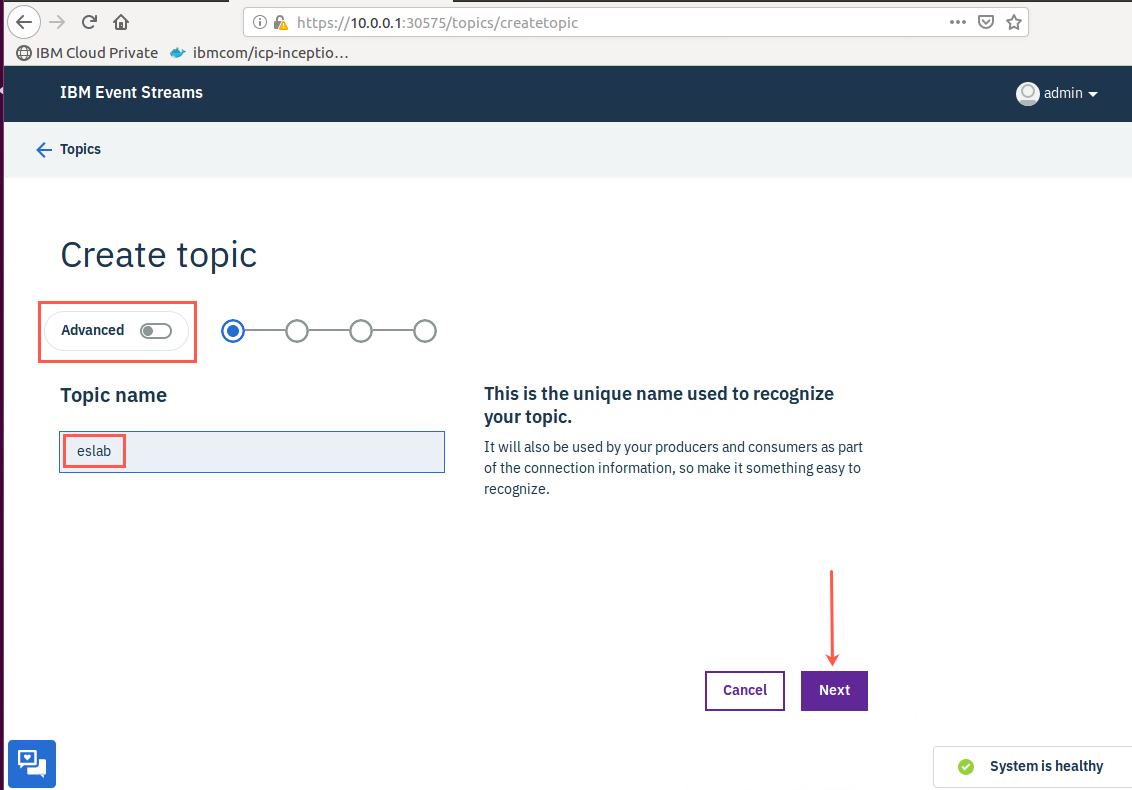
-
Advance through the remaining options, accepting defaults for all options. Ensure that you take time to click on the Advanced link at each step to review the various options that are configurable as you finish using the wizard. Click on the Create topic button on the final step in order to complete the wizard.
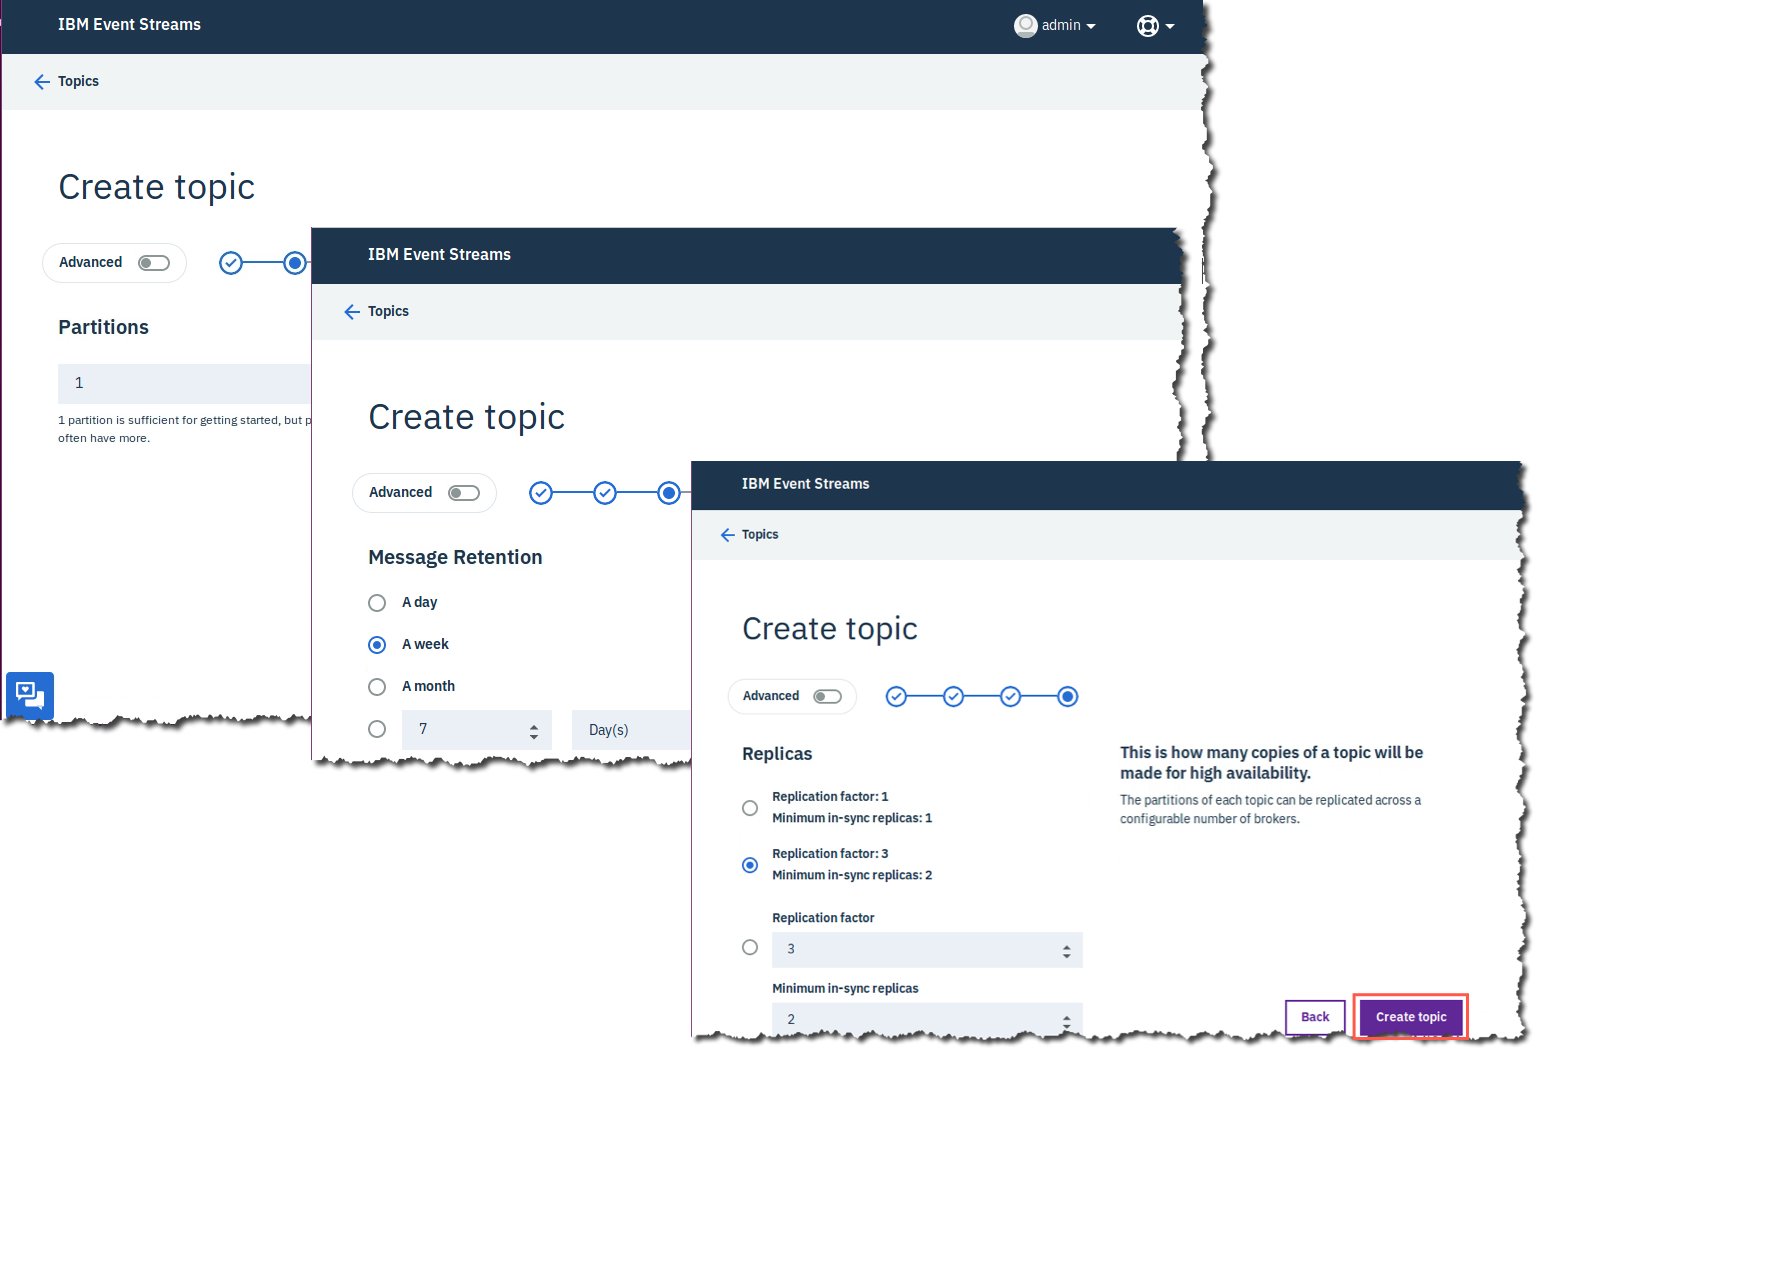
-
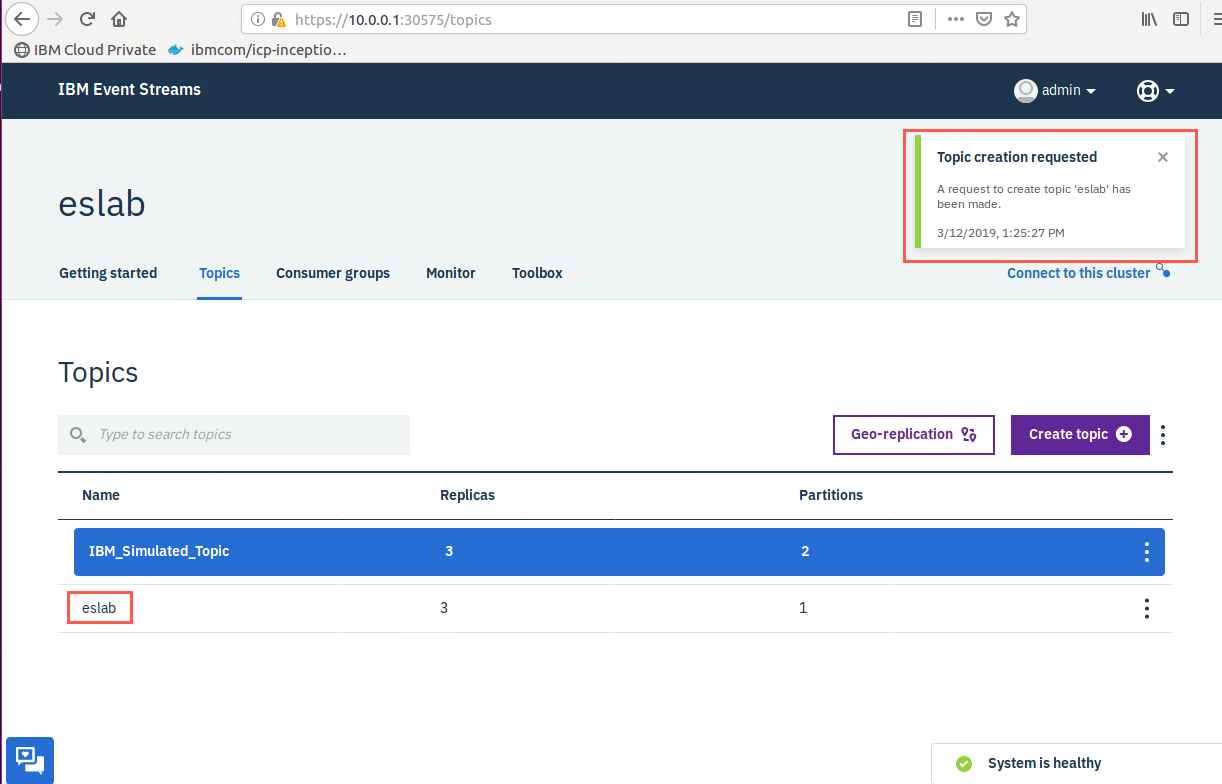
You will be returned to the Topics page. Your new Topic is now displayed along with a completion message in the upper right corner of the page. At this time you are ready to connect your application(s) to Event Streams.
When you are ready you may proceed to Step 3: Test Event Streams Operations.
Step 3: Test Event Streams Operations
Now that a functional Topic is available it is time to test sending and receiving messages. Event Streams provides a starter application that you may use as a producer and consumer of messages on your topic. Perform the following steps to generate and execute a starter application for your Event Streams installation.
-
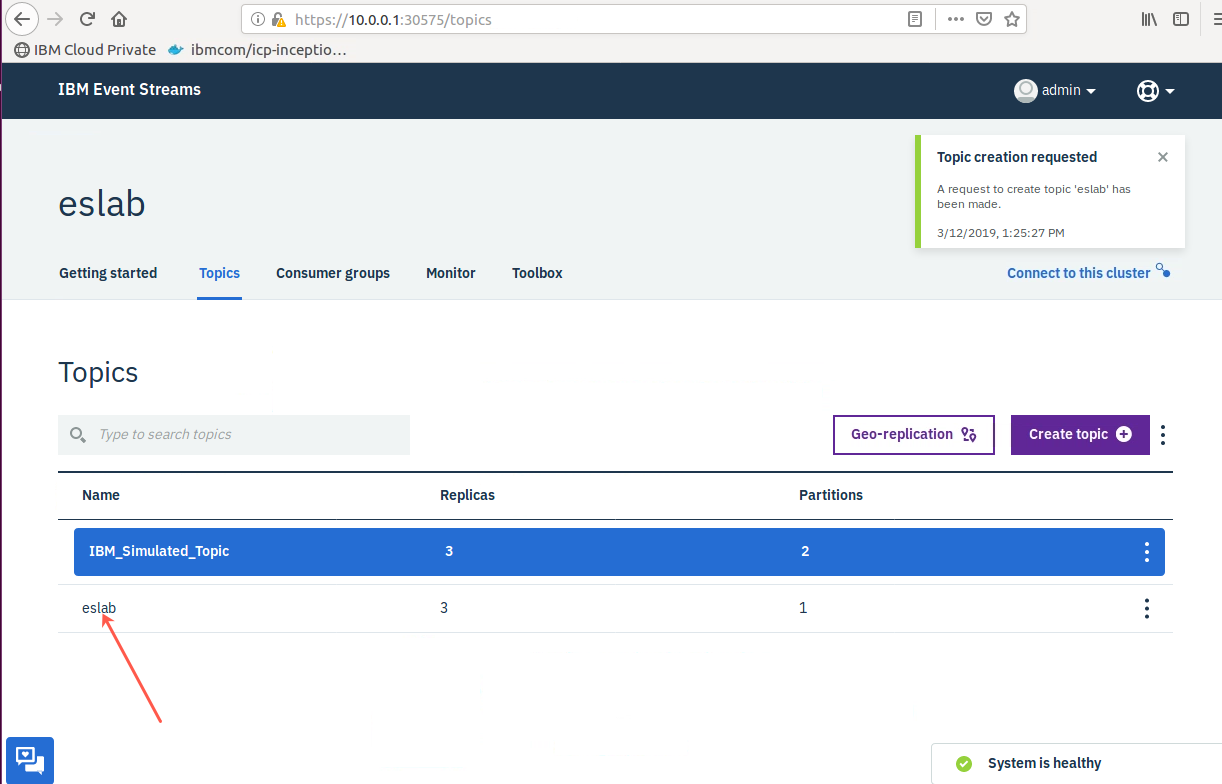
Click on the eslab topic. The Messages tab for the eslab topic will be displayed.
-
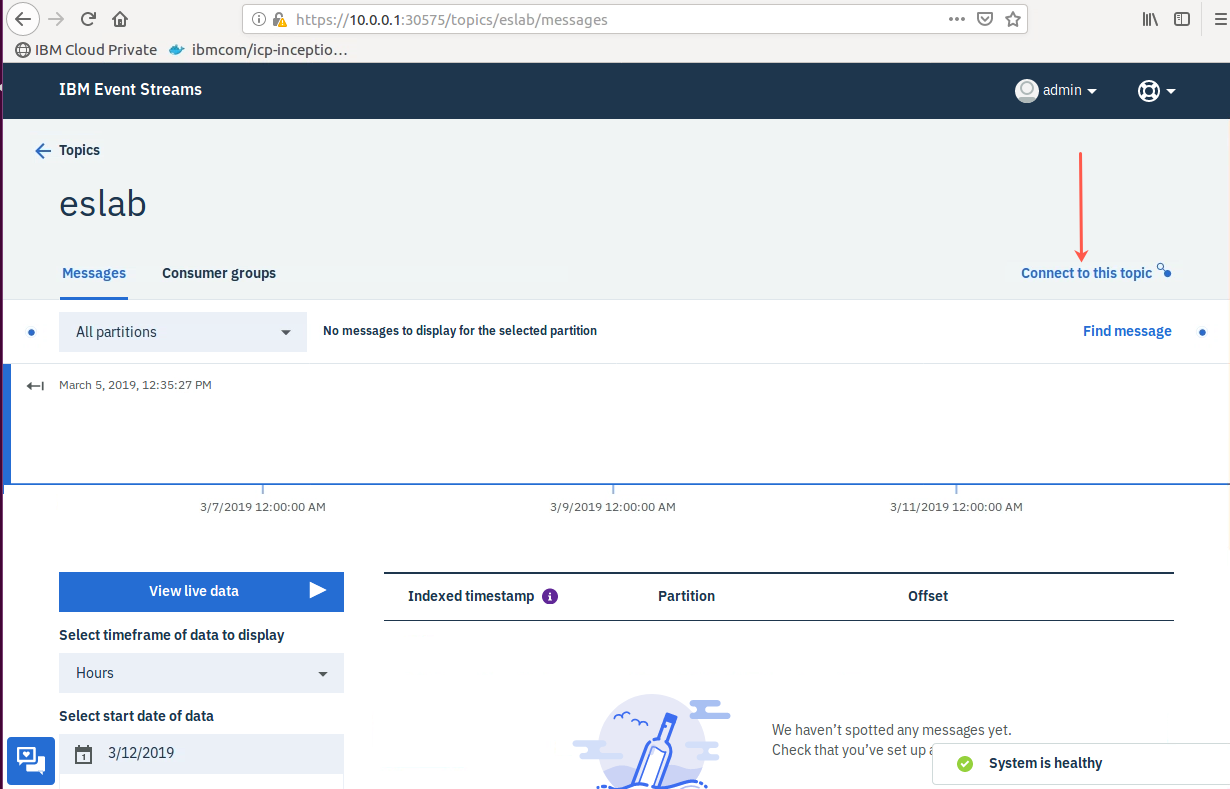
Click on the Connection to this topic tab to access connection information for the eslab topic.
-
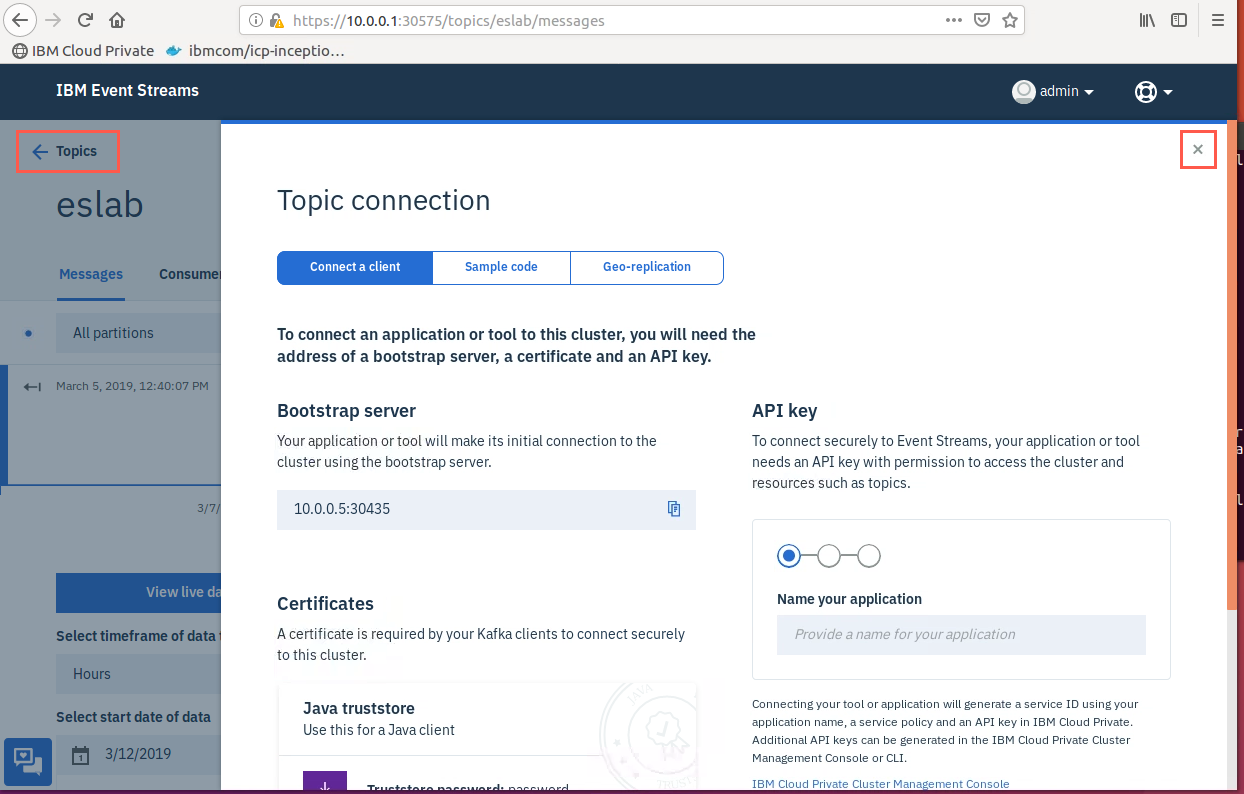
Scroll through the page to review the connection information for the Topic. Click on the X at the top right corner of the page to close the connection information, then click the Topics tab to return to the Topics page.
-
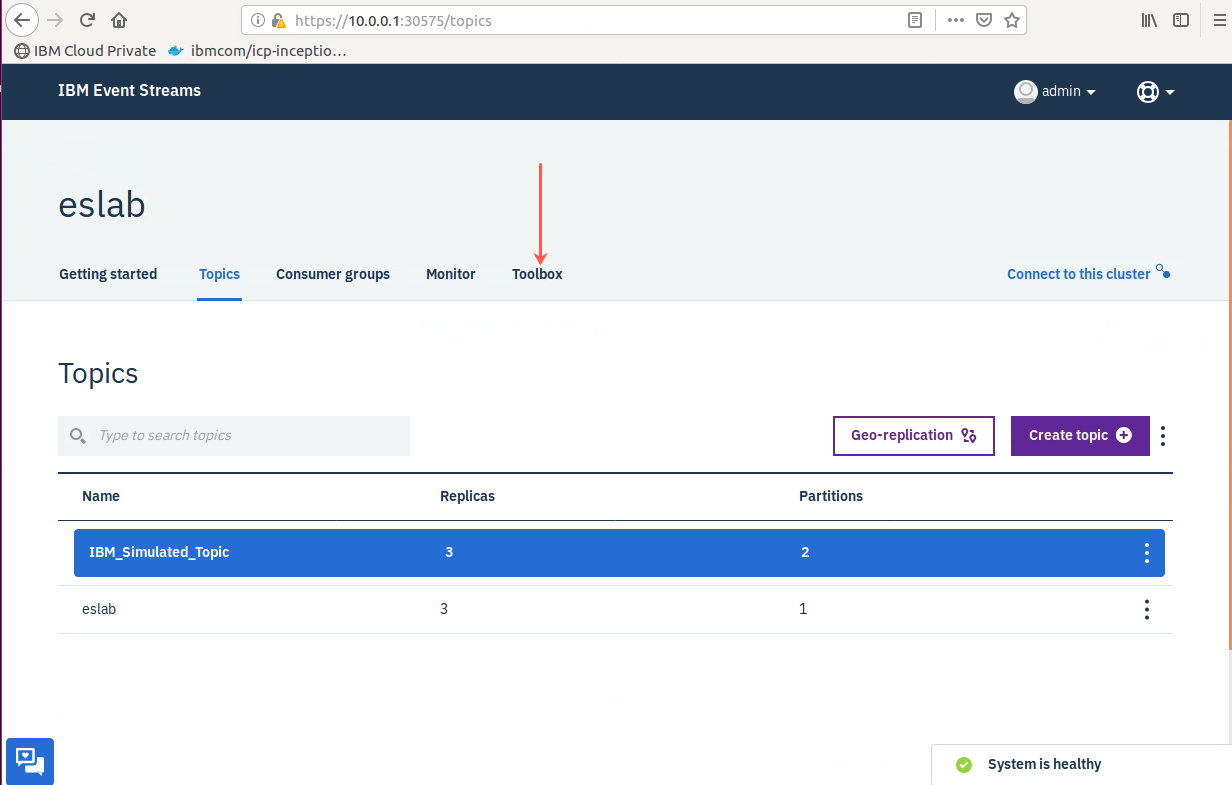
Event Streams includes several tools that may be used to test out the Event Streams installation as well as help with the development of Event Streams based applications. Click on the Toolbox tab to access the page where these tools may be found.
-
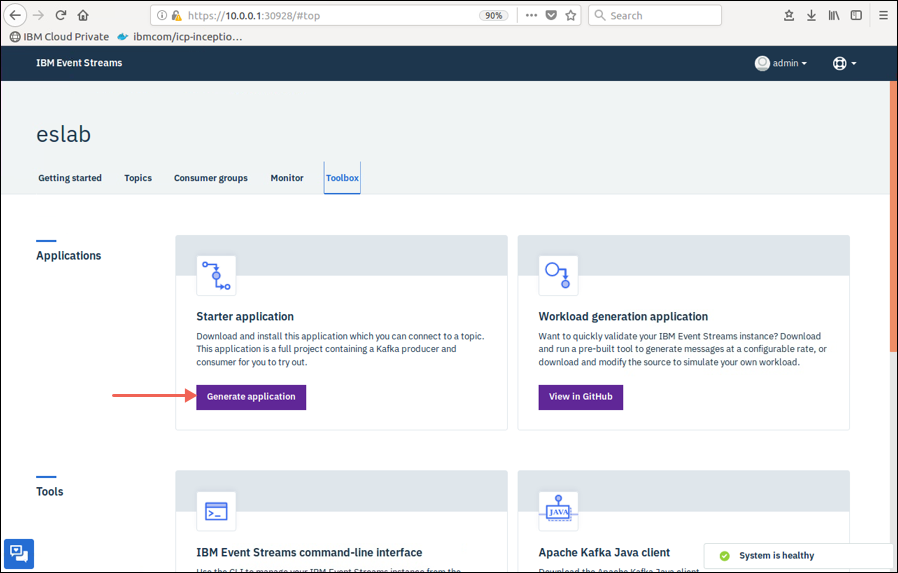
Take a moment to browse the various tools that are provided in the Toolbox. When you are ready, click on the Generate application button for the Starter application.
-
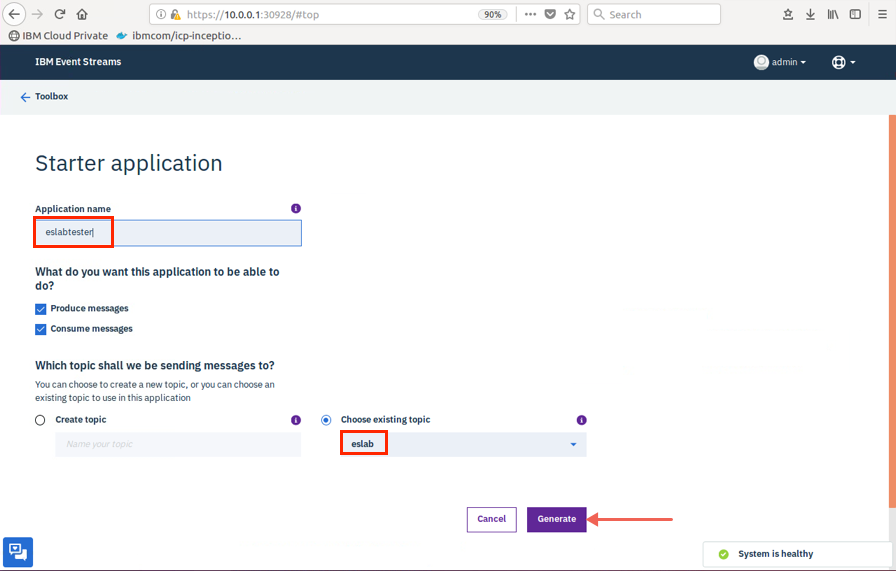
Enter eslabtester as the Application name and then select the eslab Topic. Leave the defaults to produce and consume messaes. Click on the Generate button.
-
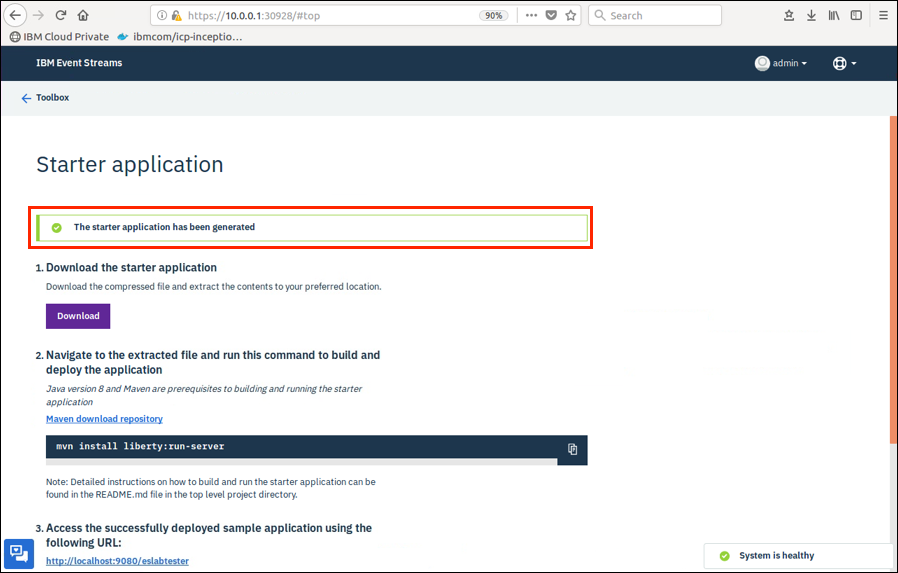
It will take a moment for the Starter application to be generated. Once you see the status message The Starter application has been generated you may complete the steps that are listed on the page.
-
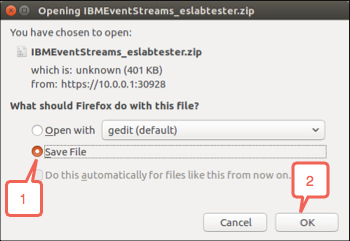
The first step is to download the Starter application that was generated. Click on the Download button and save the archive file to the Downloads directory.
-
Next you will need to locate and unpack the file that was downloaded. Open a command prompt window. Enter the following commands to extract the starter application.If you are asked if you want to replace any files answer A for all.
 cd Downloads
 unzip IBMEventStreams_eslabtester.zip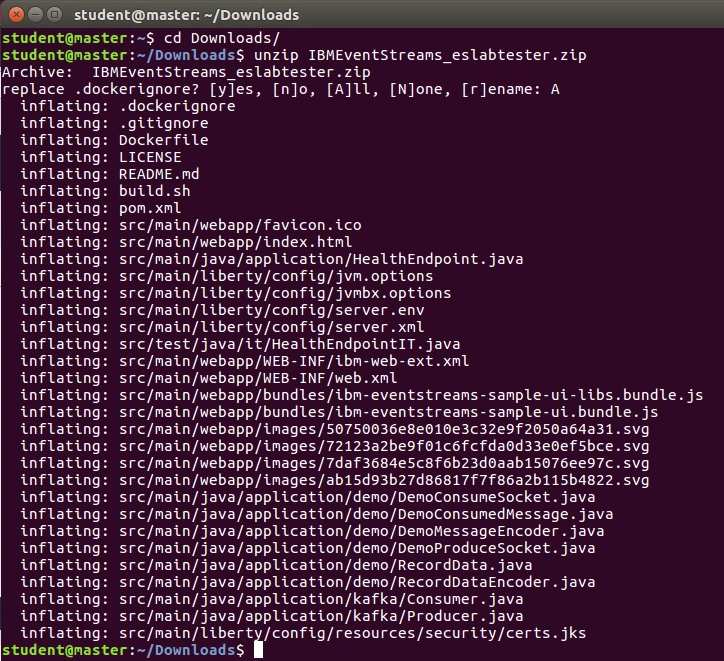
-
Maven is a build utility that is used to create Java applications. It has been installed, along with Java, in the virtual machine for this lab exercise. The archive that was extracted contains a pom.xml file that provides the directions for Maven to generate the Starter application. Use the following commands to build and launch the Starter application.
 export _JAVA_OPTIONS=-Djdk.net.URLClassPath.disableClassPathURLCheck=true
 mvn install liberty:run-server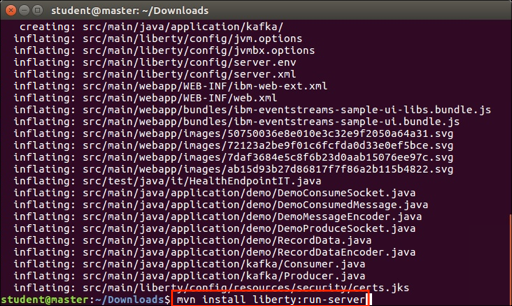
-
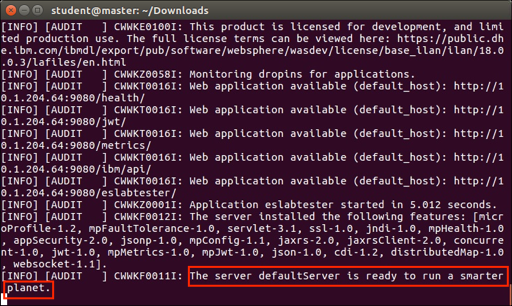
A large number of messages will be echoed to the screen while the Starter application is built and deployed to a Liberty app server. Wait until The server defaultServer is ready to run a smarter planet prompt is displayed.
 Warning:
If you see error messages after the defaultServer ready message and the build ends, continue with the next step. It may continue to run even though it shows errors. In this case you will not be able to see the console messages. -
Open a new browser tab and navigate to the URL that was listed at the bottom of the Starter application page.
http://localhost:9080/eslabtester -
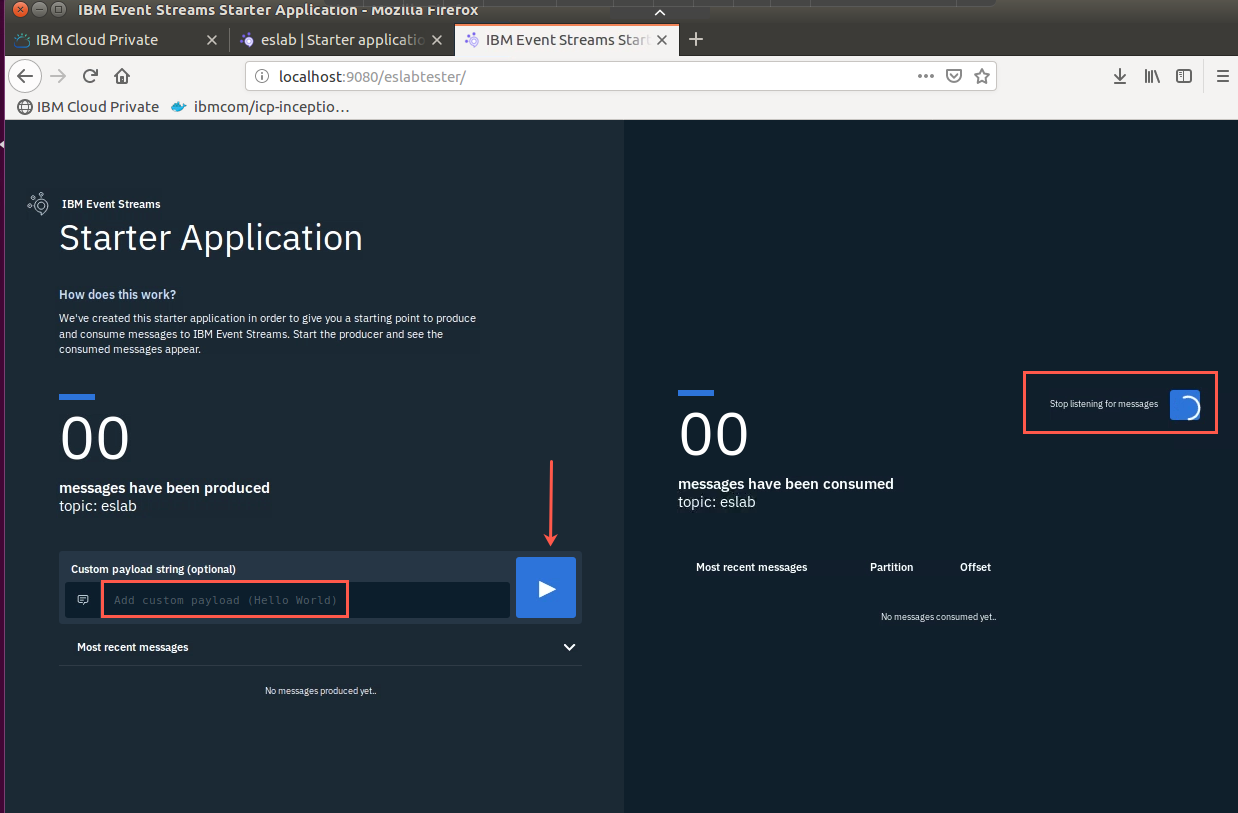
The Starter Application starts and the screen is split with a producer on the left and a consumer on the right. Notice that the consumer has already started to listen for messages. Enter a message in the custom payload field. Click the run button to start producing messages.
-
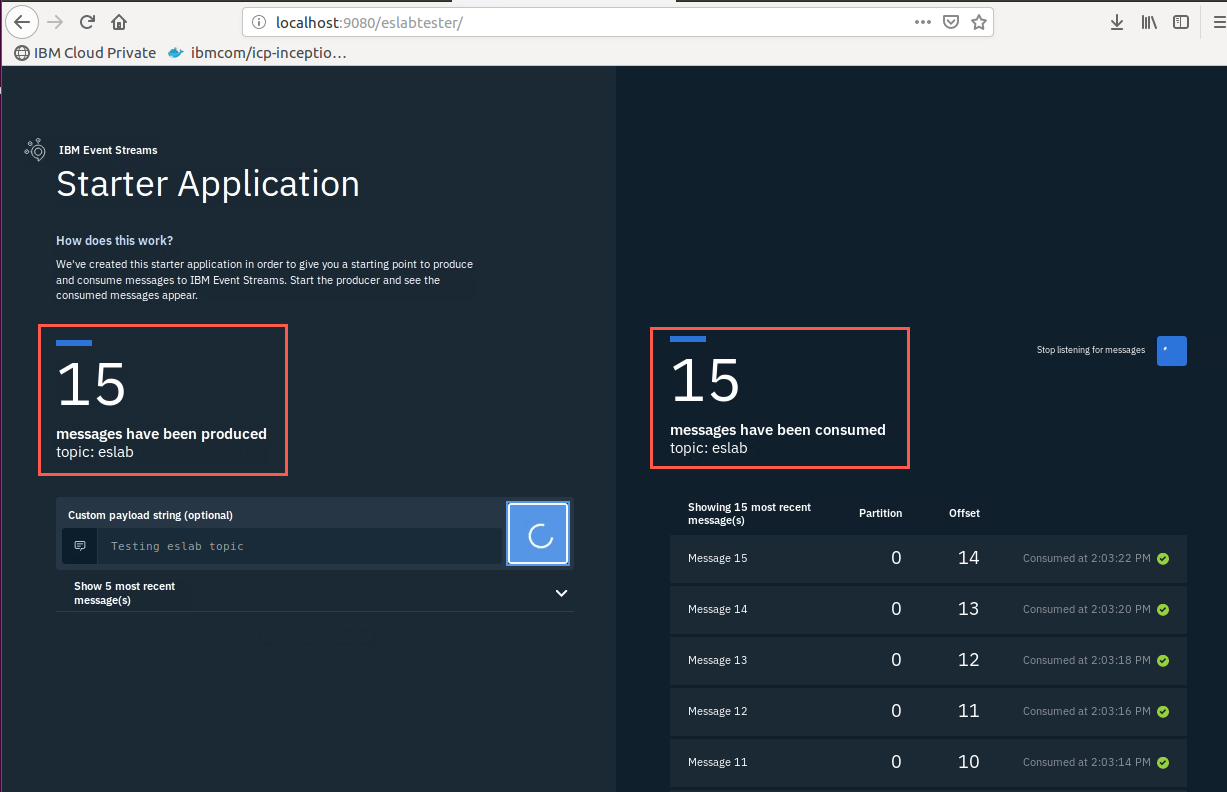
The messages are being sent to the Topic. You can see the number of messages produced. On the consumer side, you will see messages start to populate the message list section of the page. If the consumer is keeping up, the number of messages consumed should be very close to the number of messages produced.
-
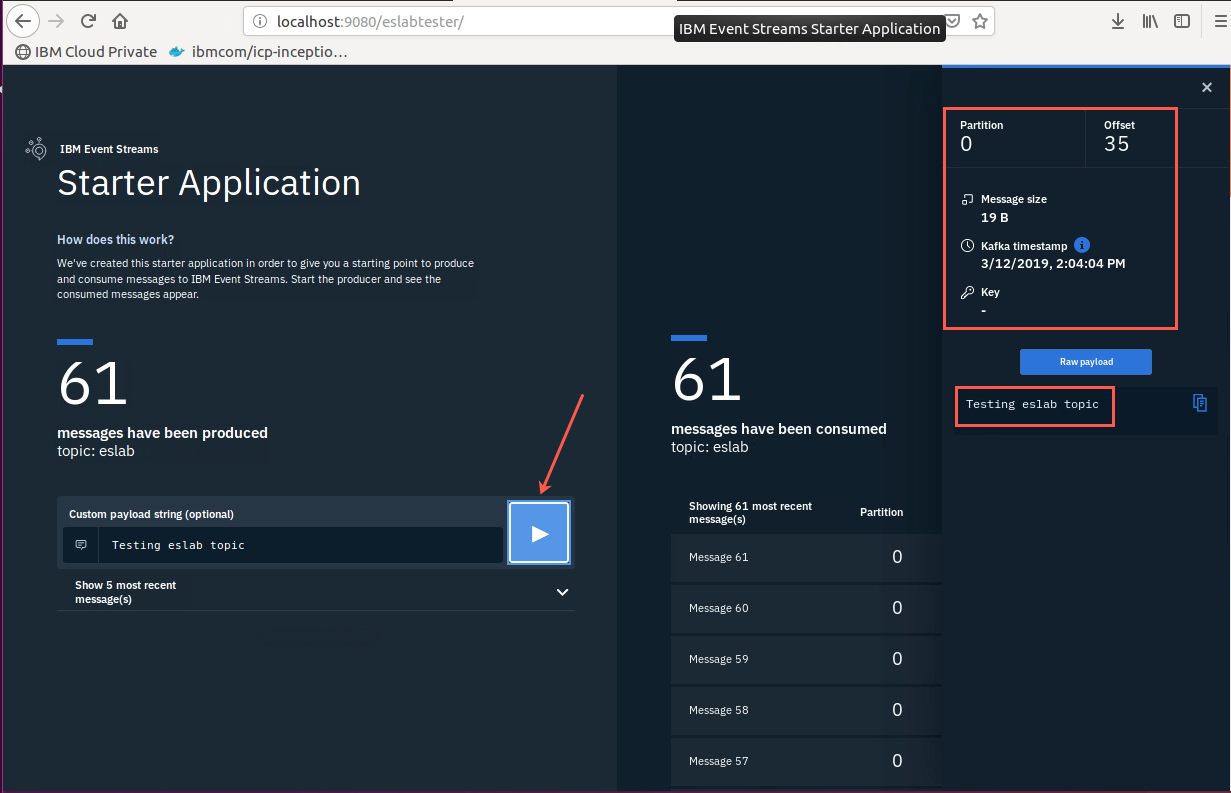
Click on one of the messages in the message list section of the page to display details of the selected message. You’ll information such as the partition holding the message, the offset in the partition, and size of the message as well as the time stamp. You can also see the payload of the message.
-
Switch back to the producer side, then click the run button to stop producing messages.
-
In the terminal window enter <ctrl-c> to stop the application.
-
Congratulations
You have successfully installed the Helm chart and tested Event Streams with the sample application. You are now ready to exercise the Event Streams Toolbox.