IBM Cloud Pak for Integration (ICP4i) Platform Monitoring and Logging Features
In this lab exercise you will learn about the monitoring options for Event Streams and to review logs for troubleshooting.
Introduction
This lab is concerned with exploring additional monitoring and logging features of the underlying ICP4i on Red Hat OpenShift Container platform (OCP). The primary interface which is expected to be used for monitoring is the Event Streams Toolbox UI (user interface) as this contains features which are specific and meaningful in a Kafka, and hence Event Streams, context. ICP4i includes the “ELK” stack (Elasticsearch, Logstash and Kibana) components to provide a common monitoring and logging framework. Describing the full capabilities of the ELK stack components are beyond the scope of this lab, but there are various articles and tutorials onthe internet if you have an interest or need to explore more deeply.
These ELK related features of OCP are useful to understand at a basic level and which deserve some attention for the following situations:
-
It is intended to exploit the ELK stack for monitoring as a preferred and consistent approach. This may be the case where OCP has been selected as the container orchestration and deployment platform or there may already be experience is configuring and using ELK stacks
-
Where trying to do problem determination by examining and searching information in the logs
Produce load on Event Streams
To make this exercise meaningful, you will need to create some workload for Event Streams. You can use the same tools you used in the previous labs with some minor changes. You will use the following:
- eslabtester application from Lab 1
- es-producer application from Lab 2
- MQ source and sink connectors
Start eslabtester
-
If your Kafka MQ connectors are still running in the terminal windows, stop them now with the
C command. -
Open a command window and change to the Downloads directory. Enter the following command to start the application:
 cd ~/Downloads
 mvn install liberty:run-server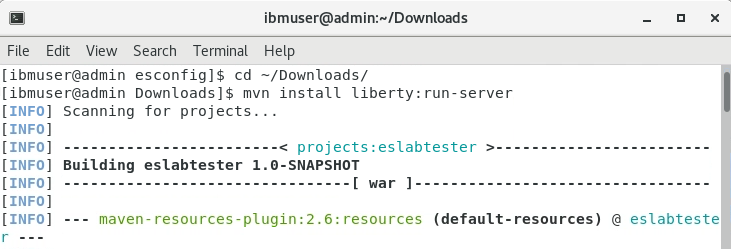
-
Open a new browser tab and navigate to:
http://localhost:9080/eslabtester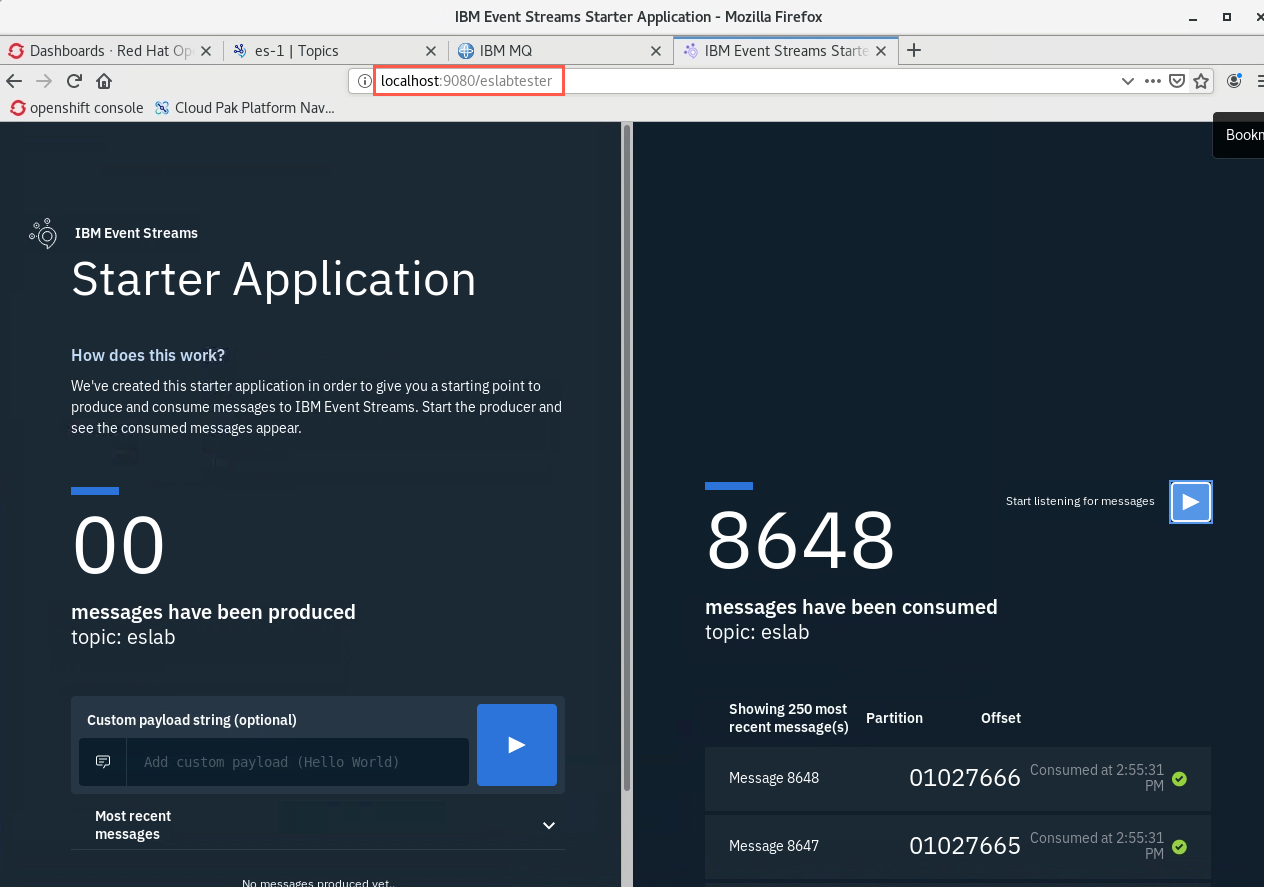
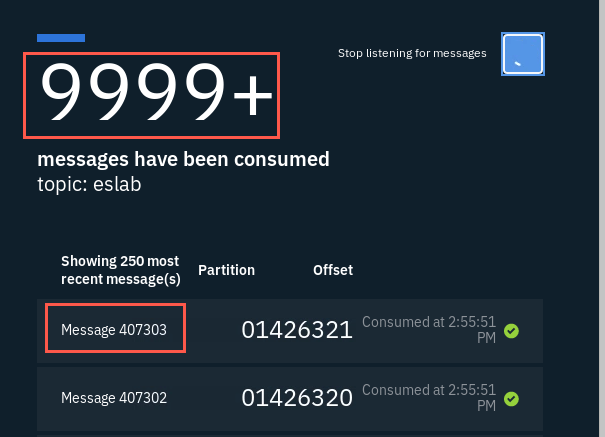
Observe the the consumer side of page. Notice that the consumer is reading all the messages that you have previously produced with your load testing. The starter application’s display stops at 9999+, but you can see that it continues to consume messages. The producer isn’t running at this moment.
-
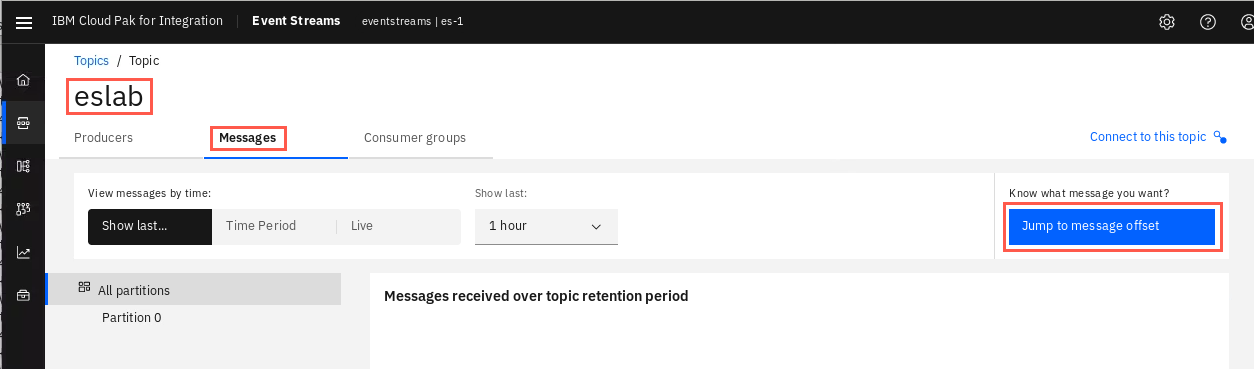
Pick a message number from the list. In the Event Streams UI, click Topics on the menu bar, select topic eslab, then click Messages. On the right side of window click Jump to message offset.
-
Leave partition set to 0 and enter the message number you selected.
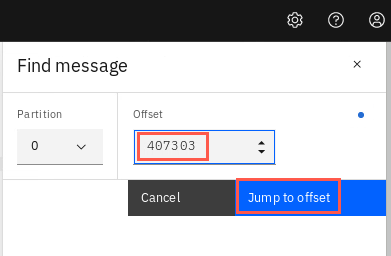
-
Click View message and details of the message and the payload are displayed.
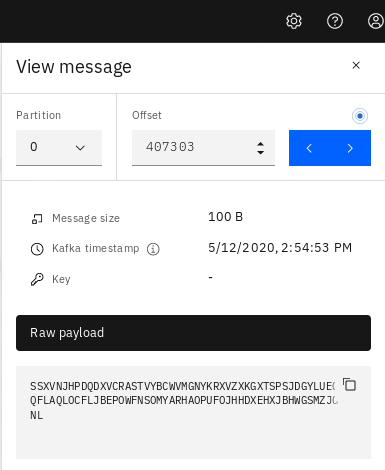
Run es-producer
-
Open another terminal window. Remember es-producer from the Toolbox lab? Run es-producer with the following command:
java -jar es-producer.jar -t eslab -s largees-producer will publish 6,000,000 messages to topic eslab. You now have two producers publishing messages to eslab and one consumer consuming messages from that topic (eslabtester web app).

Start MQ source connector
-
For this test you will need to increase the Max queue depth for queue MQTOEVENT. In the MQ console Queues on mq widget select MQTOEVENT and click Properties.
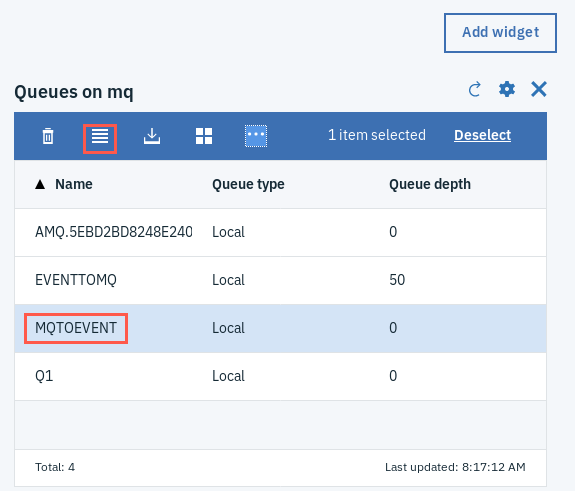
-
Click Extended then change the value for Max queue depth to 500000. Click Save then Close.
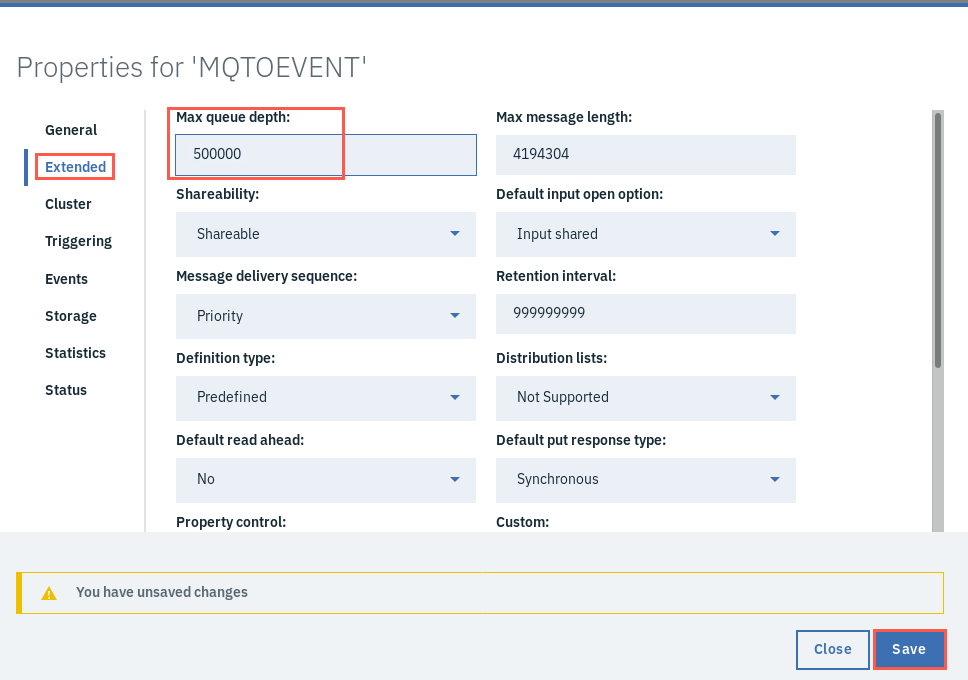 Note:
Note:
If Queue depth is 5000, you may need to clear the queue before changing the property. -
Open another terminal window. Edit the MQ source connector properties with the following command:
gedit ~/kafka_standalone/mq-source.properties -
Change the following properties to the specified values. This will create an MQ source connector that will get messages from the MQTOEVENT queue and publish them to eventtomq. This will produce some load into Event Streams that will make monitoring more interesting.
Property Value mq.queue MQTOEVENT topic eventtomq 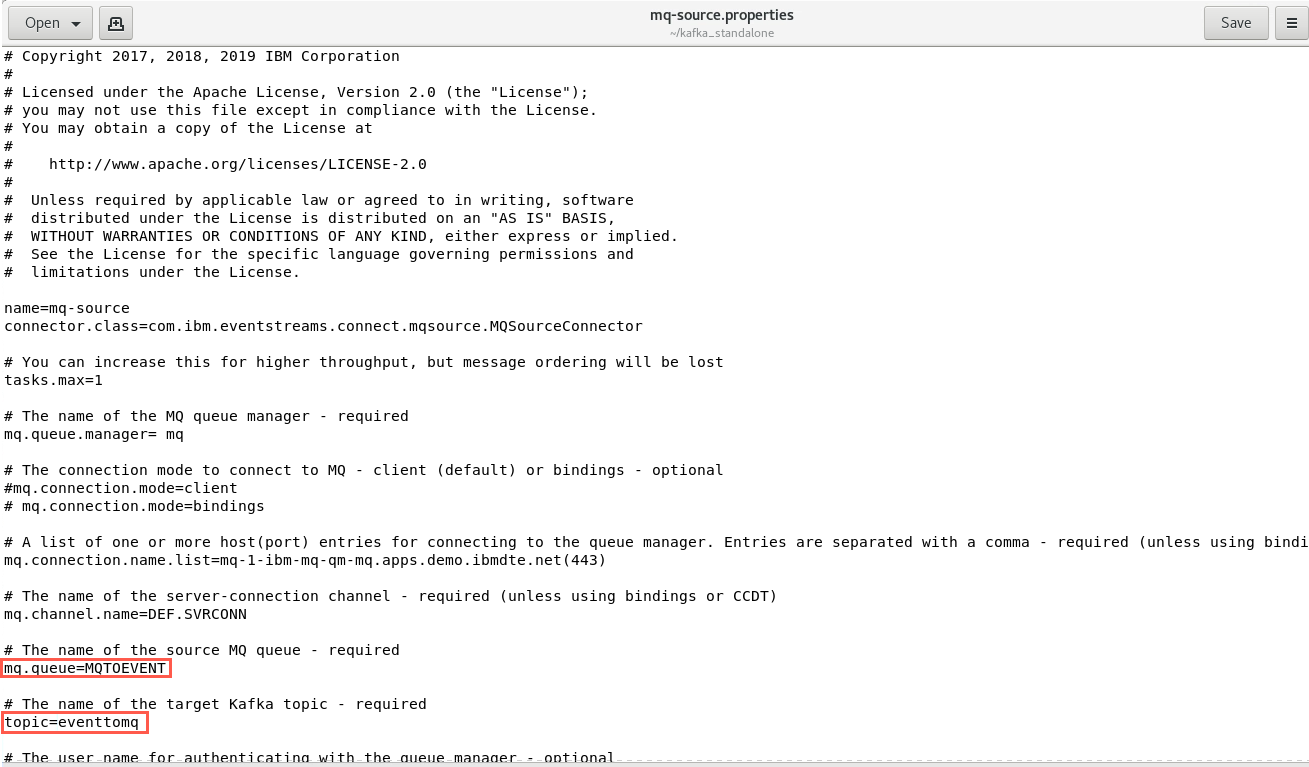
-
Click Save to save the properties and close the editor. Return to the terminal window. Change the directory to /home/ibmuser/kafka_2.13-2.5.0 then start the MQ source connector.
 cd ~/kafka_2.13-2.5.0
 . /home/ibmuser/esconfig/mq2event.sh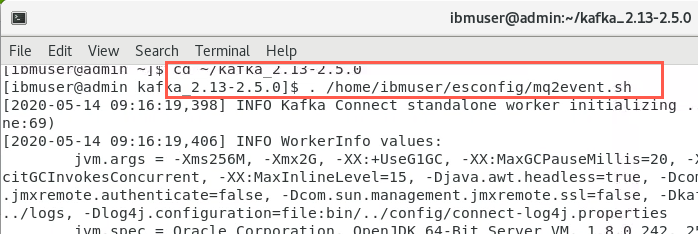
Start MQ sink connector
-
Open another terminal window. Edit the MQ sink connector properties with the following command:
gedit ~/kafka_standalone/mq-sink.properties -
Change the following properties to the specified values. This will create an MQ sink connector that will get messages from the eslab topic and put them on the MQ queue MQTOEVENT. When you start the MQ source connector, it will get the messages from MQTOEVENT and publish them to the topic mqtoevent. This will produce some load into Event Streams that will make monitoring more interesting.
Property Value topics eslab mq.queue MQTOEVENT 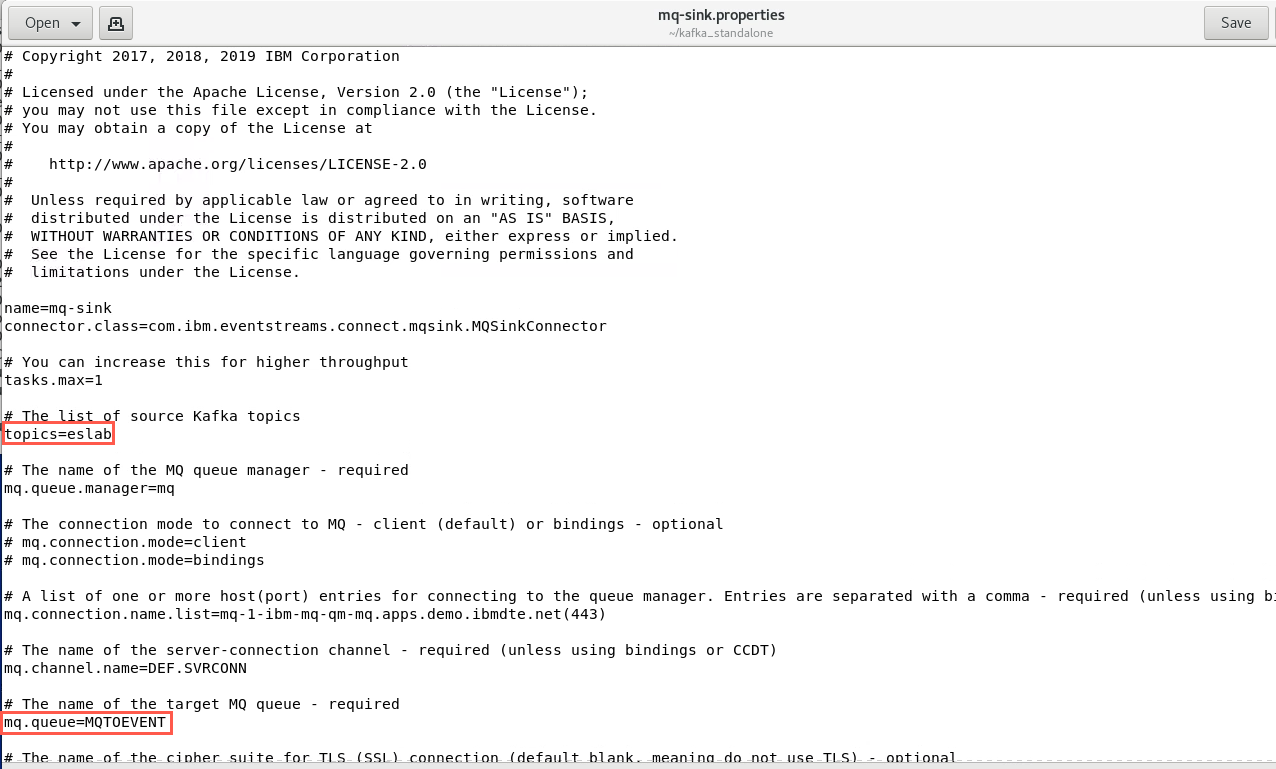
-
Click Save to save the properties and close the editor. Return to the terminal window and start the sink connector.
. /home/ibmuser/esconfig/event2mq.sh
Monitoring
The monitoring framework is built around Prometheus which allows features for rich customization of monitoring dashboards which may either be included with an ICP4i distribution as samples with products available in the ICP4i catalog or created by the customer based on their specific requirements.
Monitoring topic health using the Event Streams UI
To gain an insight into the overall health of topics and highlight potential performance issues with systems producing to Event Streams, you can use the Producer dashboard provided for each topic.
The dashboard displays aggregated information about producer activity for the selected topic through metrics such as message production rates, message size, and an active producer count. The dashboard also displays information about each producer that has been producing to the topic.
You can expand an individual producer record to gain insight into its performance through metrics such as messages produced, message size and rates, failed produce requests and any occurences where a producer has exceeded a broker quota.
The information displayed on the dashboard can also be used to provide insight into potential causes when applications experience issues such as delays or ommissions when consuming messages from the topic. For example, highlighting that a particular producer has stopped producing messages, or has a lower message production rate than expected.
The producers dashboard is intended to help highlight producers that may be experiencing issues producing to the topic. You may need to investigate the producer applications themselves to identify an underlying problem.
-
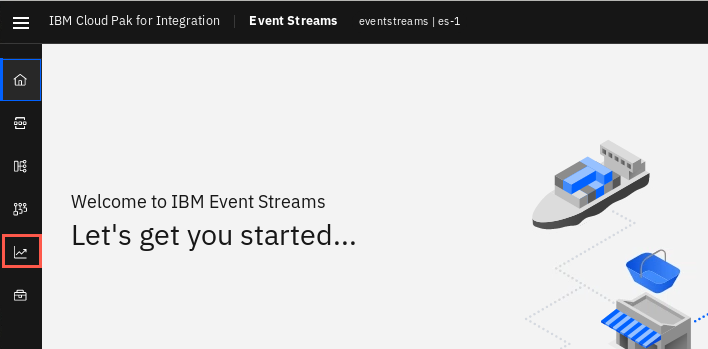
Return to the Event Streams UI. Click Monitoring icon on menu bar.
-
Change the Show last field to 1 hour. Notice the screen is refreshed every 15 seconds. Observe the graphs for incoming bytes and outgoing bytes for messages over that last hour. Watch for a few minutes. You will see that these values are rather consistent.
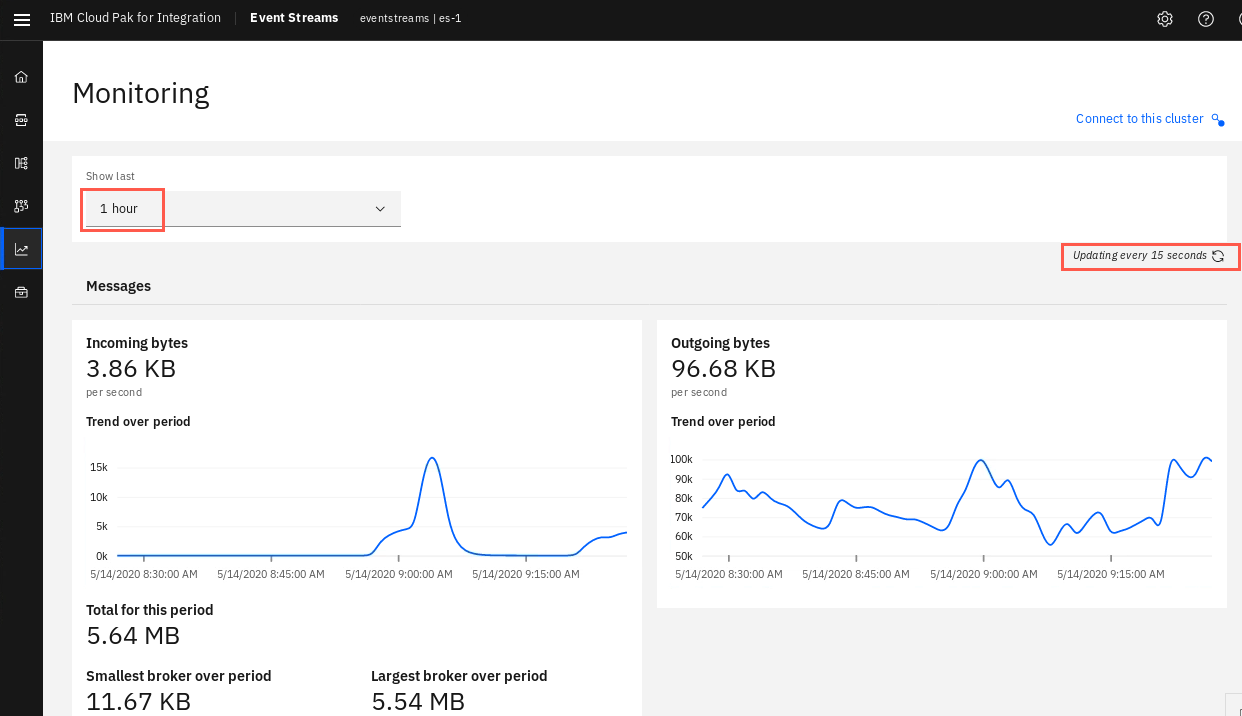
Think about what is happening. Eslabtester is publishing messages and also consuming messages. Es-producer also produced messages to topic eslab. The MQ sink connector is consuming messages from topic eslab and putting messages on queue EVENTTOMQ. Then the MQ source connector is getting those messages and publishing them to topic eventmq. This is considerable more load than you have tested so far. This also shows that there can be multiple publishers and consumers of the same topic and that the messages are not destroyed when consumed.
-
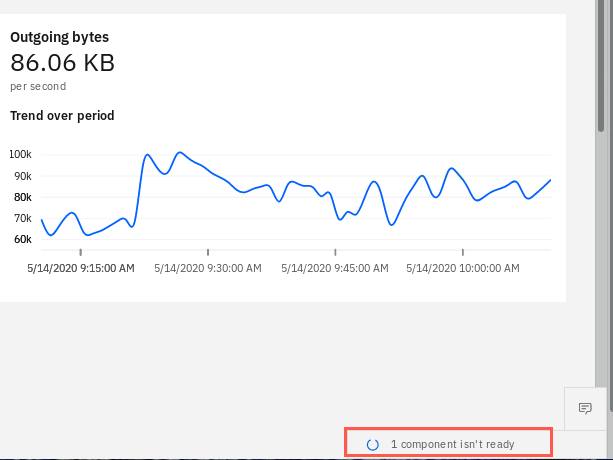
The Event Streams status in the bottom right corner shows 1 component isn’t ready. Normally this will show System healthy. Click it to show the status of pods.
-
The status window pops up. This particular status shows 4/5 components are online. Yours may be healthy. In this case one of two External access server pods is not ready. This doesn’t mean that Event Streams is not working properly. It only means that it is running with reduced capacity. This shows the resiliency of the OpenShift Platform.
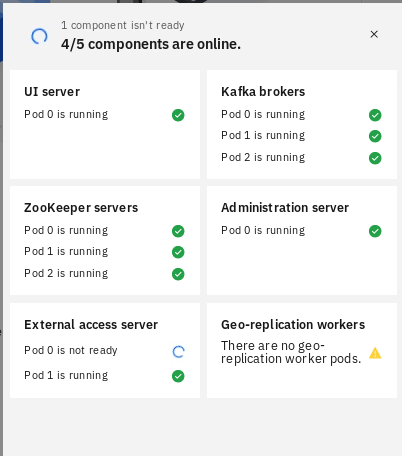
In the display you can see the various components of Event Streams, the number of pods running for each component, and whether they are ready. You will dig into the details later in the OpenShift console. Close the display now.
Monitoring Kafka cluster health in the OpenShift console
Monitoring the health of your Kafka cluster ensures your operations run smoothly. Event Streams collects metrics from all of the Kafka brokers and exports them to a Prometheus-based monitoring platform. The metrics are useful indicators of the health of the cluster, and can provide warnings of potential problems.
You can use the metrics as follows:
- View a selection of metrics on a preconfigured dashboard in the Event Streams UI.
- Create dashboards in the Grafana service that is provided in ICP4i, and use the dashboards to monitor your Event Streams instance, including Kafka health and performance details. You can create the dashboards in the ICP4i monitoring service by selecting to Export the Event Streams dashboards when configuring your Event Streams installation.
You can also download the example Grafana dashboards for Event Streams from GitHub, including a dashboard for monitoring geo-replication health, which is useful if you have geo-replication set up in your environment.
Ensure you select your namespace, release name, and other filters at the top of the dashboard to view the required information.
- Create alerts so that metrics that meet predefined criteria are used to send notifications to emails, Slack, PagerDuty, and so on. For an example of how to use the metrics to trigger alert notifications, see how you can set up notifications to Slack. You can also use external monitoring tools to monitor the deployed Event Streams Kafka cluster.
Important: By default, the metrics data used to provide monitoring information is only stored for a day. Modify the time period for metric retention to be able to view monitoring data for longer time periods, such as 1 week or 1 month.
Viewing the preconfigured dashboard
-
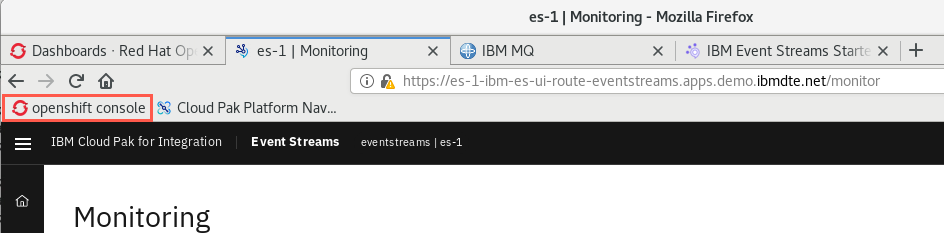
In Firefox, click the openshift console. Or return to it if already open.
-
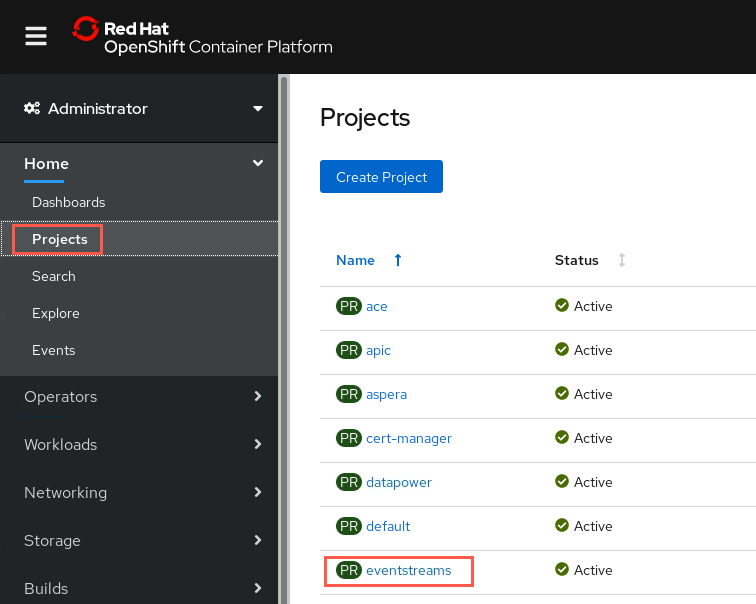
Click Projects then eventstreams.
-
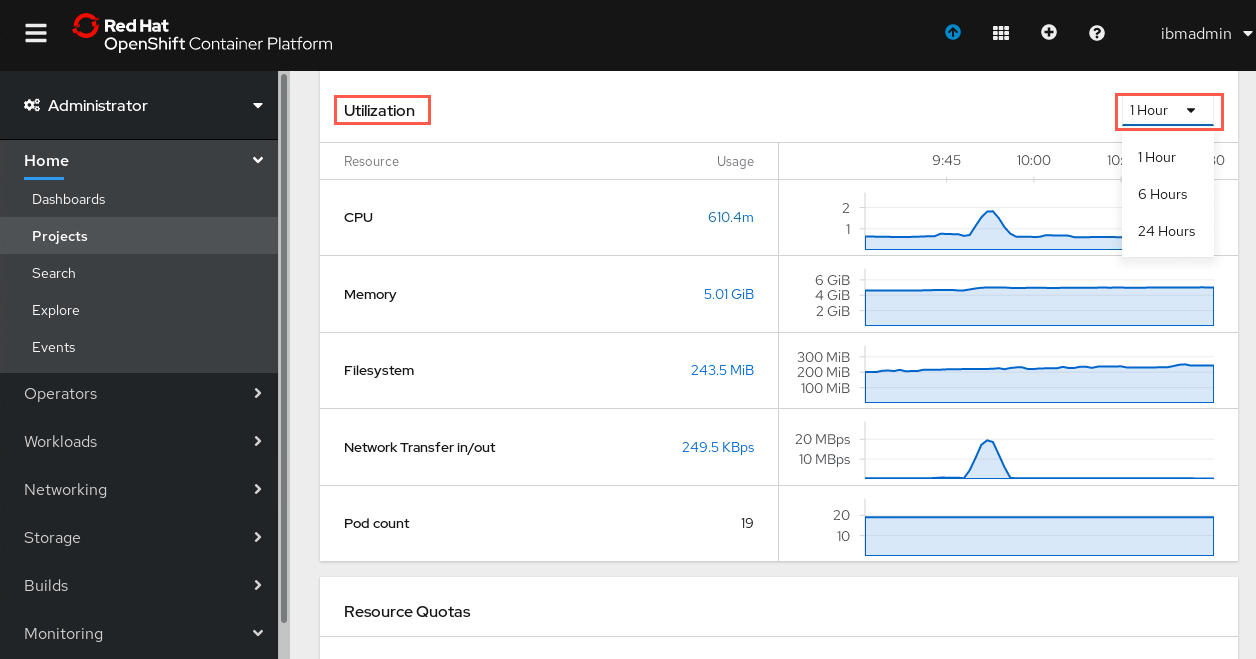
Scroll to Utilization. This display gives an overview of the resources that Event Streams has used. The graphs show what Event Streams is consuming over a period of time. The default is 1 hour, but you can use the pull-down to change it.
-
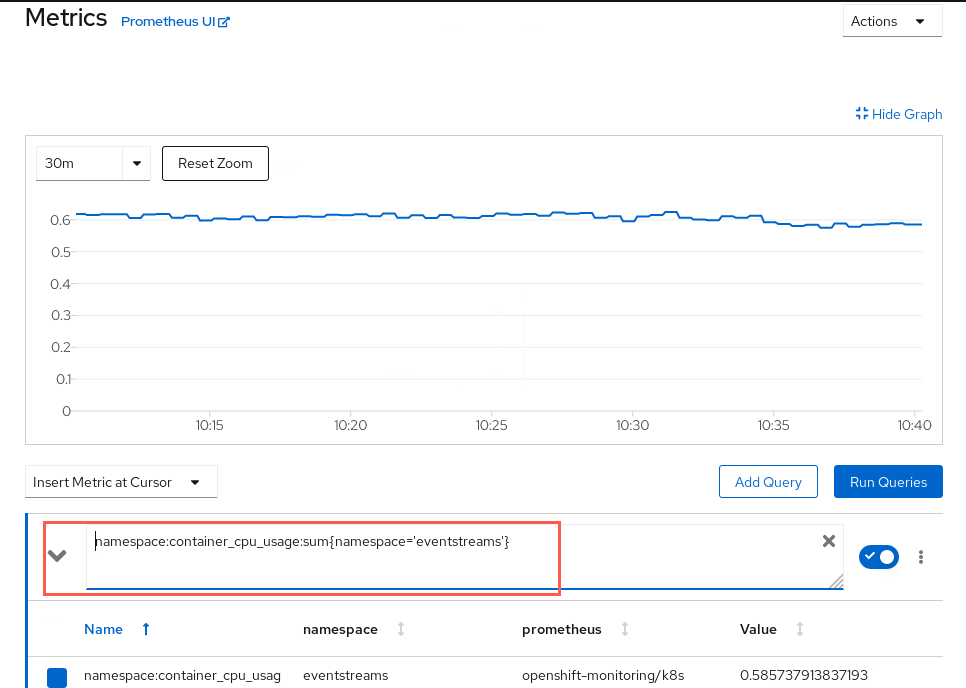
Hover over any of the graphs and you can see the usage of that resource at a specific time. Click the graph and you are taken to the Metrics. This particular one is the total CPU for Event Streams. You can see a default query that has been run. You can also add your own query here.
-
Click Monitoring then Dashboards.
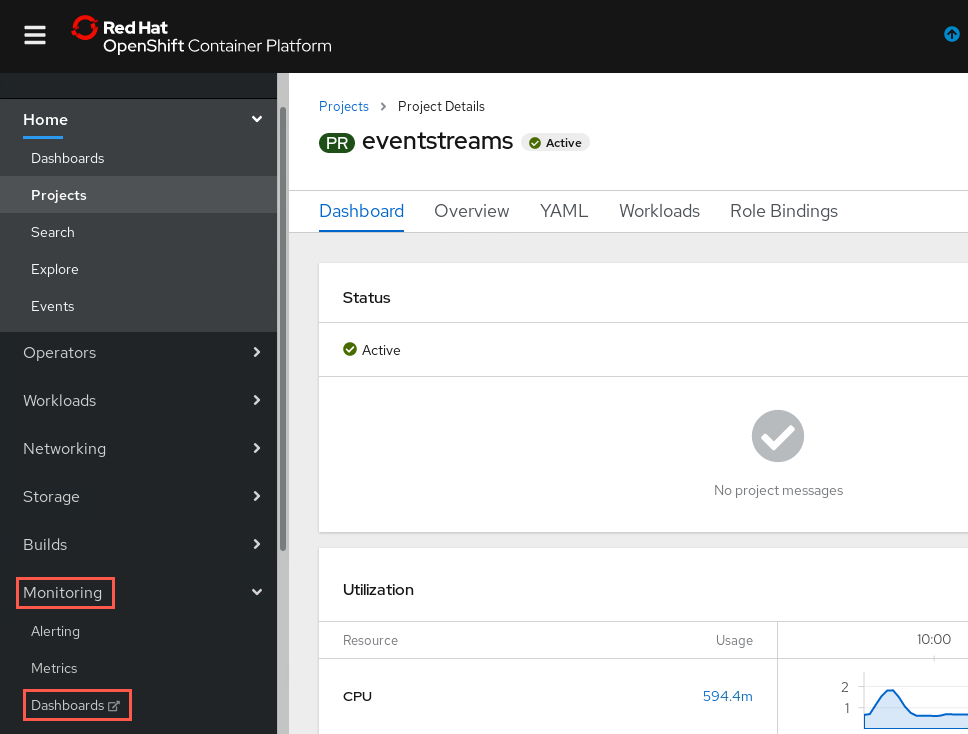
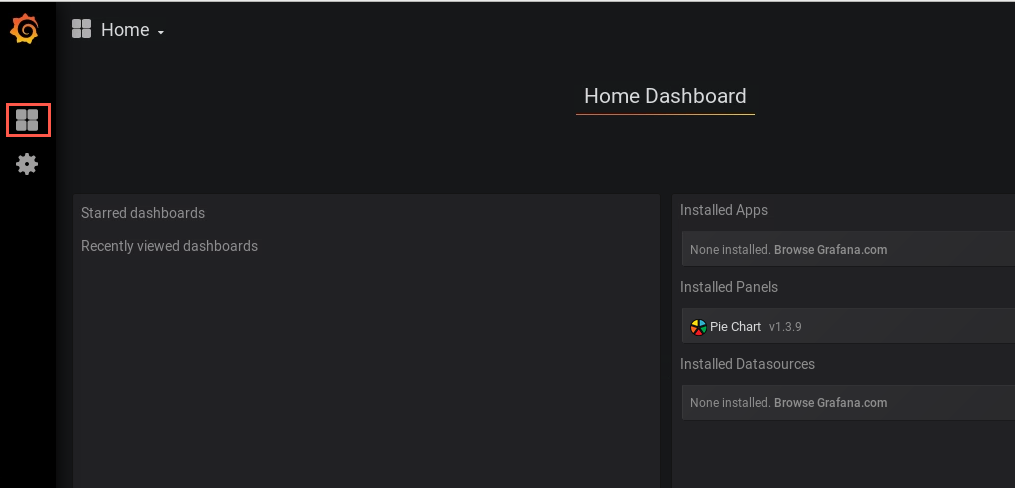
If FireFox warns you of a security risk, click Advanced then Accept the risk and continue. If you are asked to sign in, click the password field then click Log in. On the next screen click Allow selected permissions. Hover over the Dashboards icon and select Manage.
-
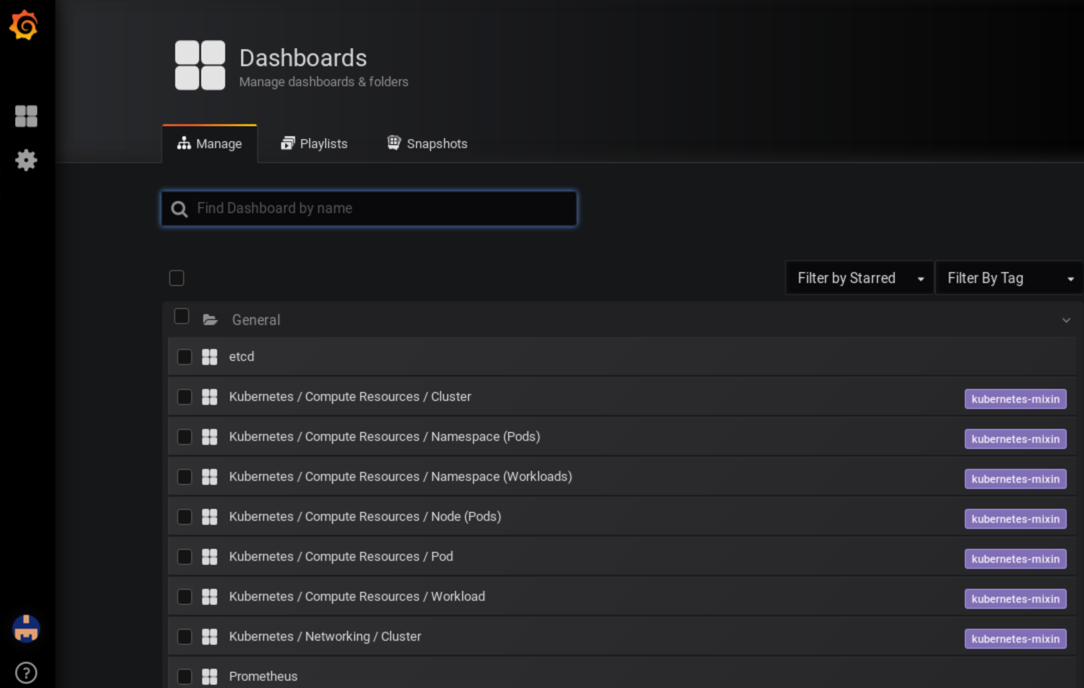
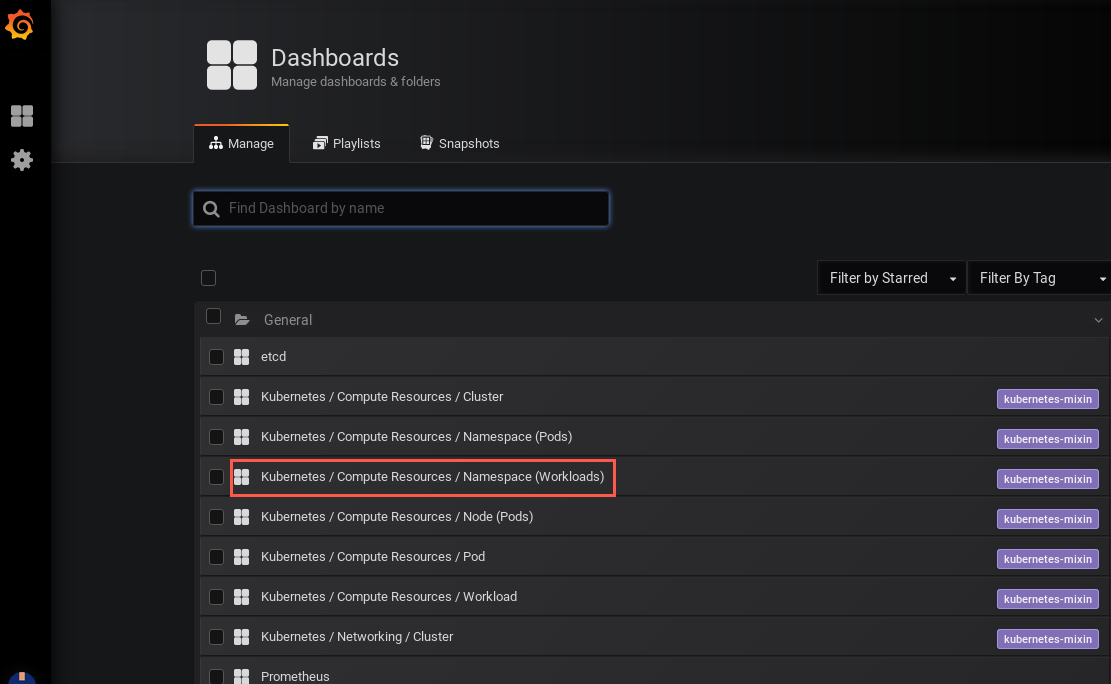
- A list of dashboards is displayed. Select the Kubernetes / Compute Resources / Namespace (Workloads) dashboard.
-
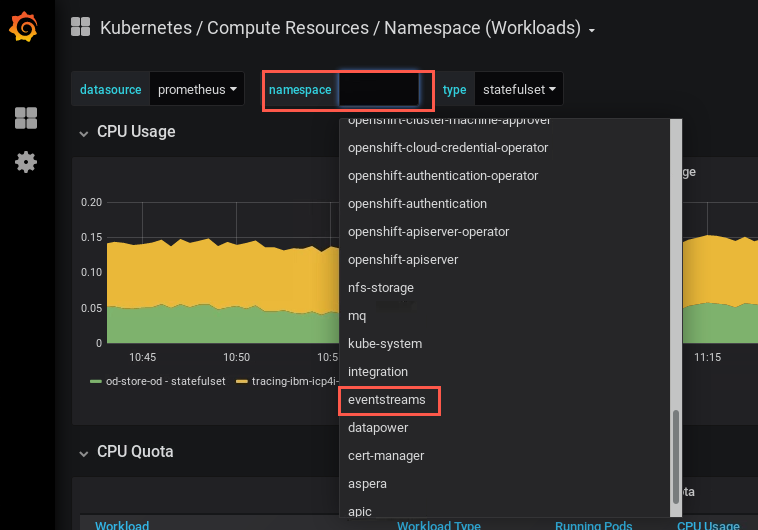
Click the dropdown next to namespace and select eventstreams.
-
There is lots of information here. Right away you see the CPU Usage for the workloads running in Event Streams.
- Kafka brokers
- Zookeeper
- Schema Registry
- Elastic Search
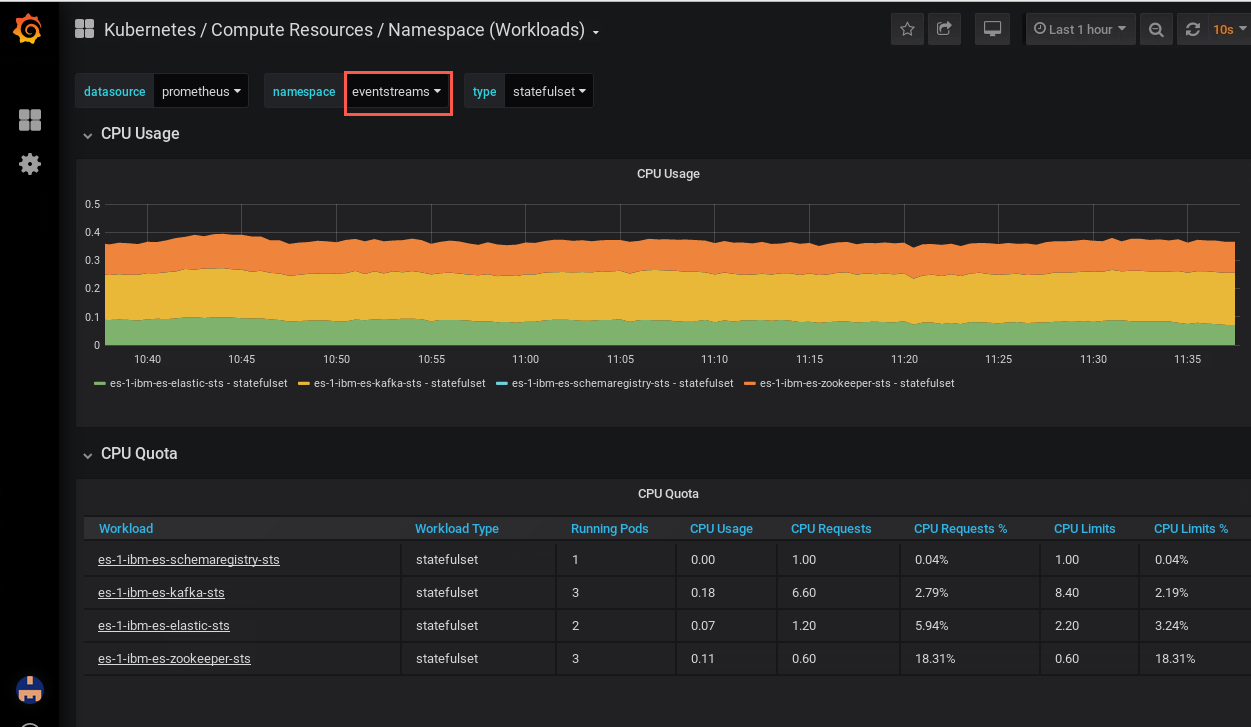
Right away you see the CPU Usage for each workload. As expected, the Kafka brokers and zookeeper are using the most resources in Event Streams.
-
Scroll down to see memory usage. Again Kafka brokers and zookeeper using the most memory. The Memory Quota section shows the limits set for the workloads.
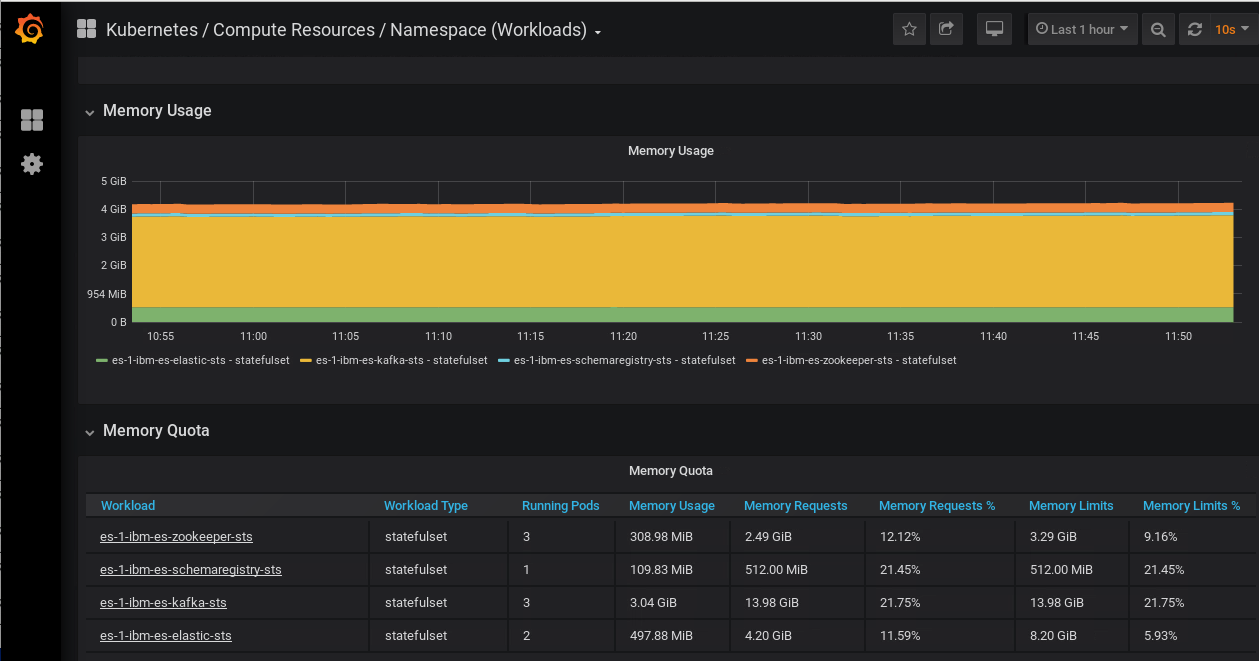
-
Scroll down to see the network usage. Review as much as you want.
-
Click the Dashboards icon. The list of dashboards is displayed. This time select the Kubernetes / Compute Resources / Pod dashboard.
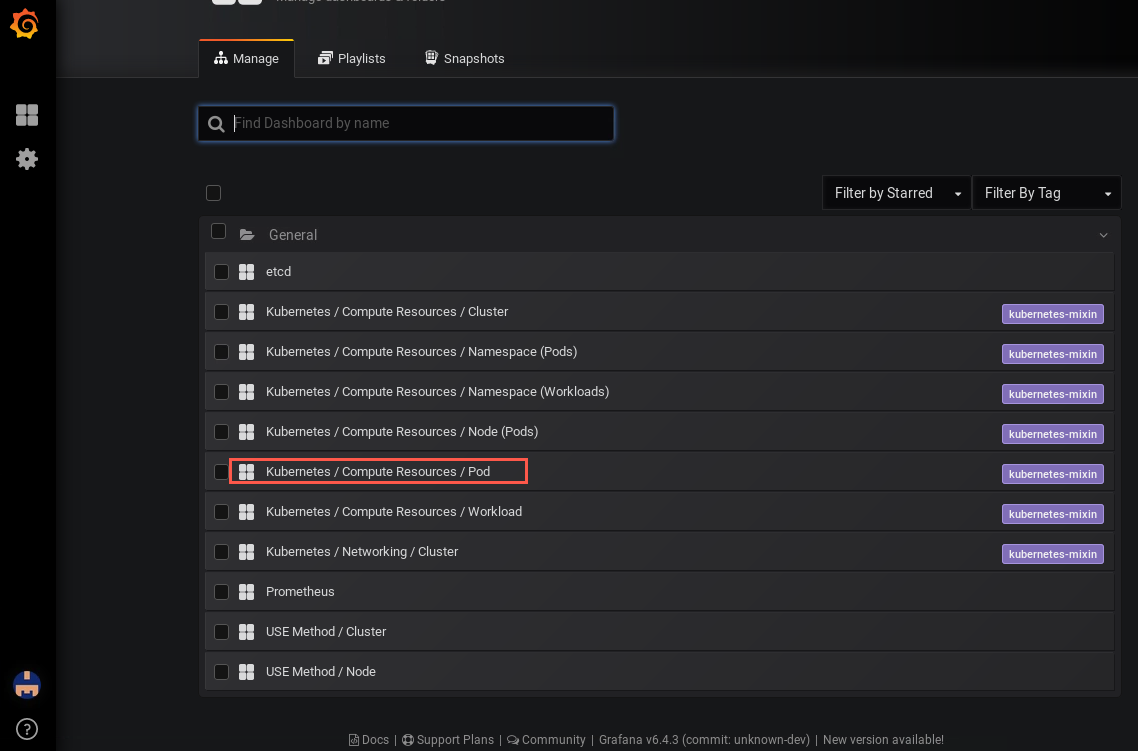
-
Click the dropdown next to namespace and scroll down to select eventstreams.
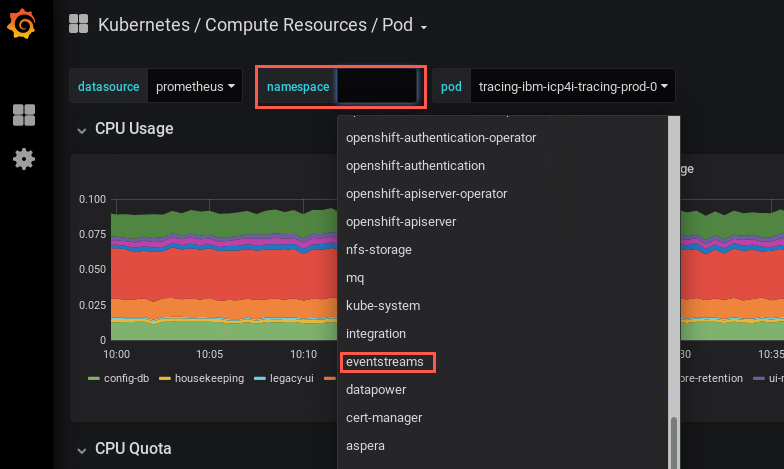
-
One of the Event Streams pods is automatically selected. The pod shown here happens to be for zookeeper. It shows the CPU statistics for the pod as well as the proxy container.
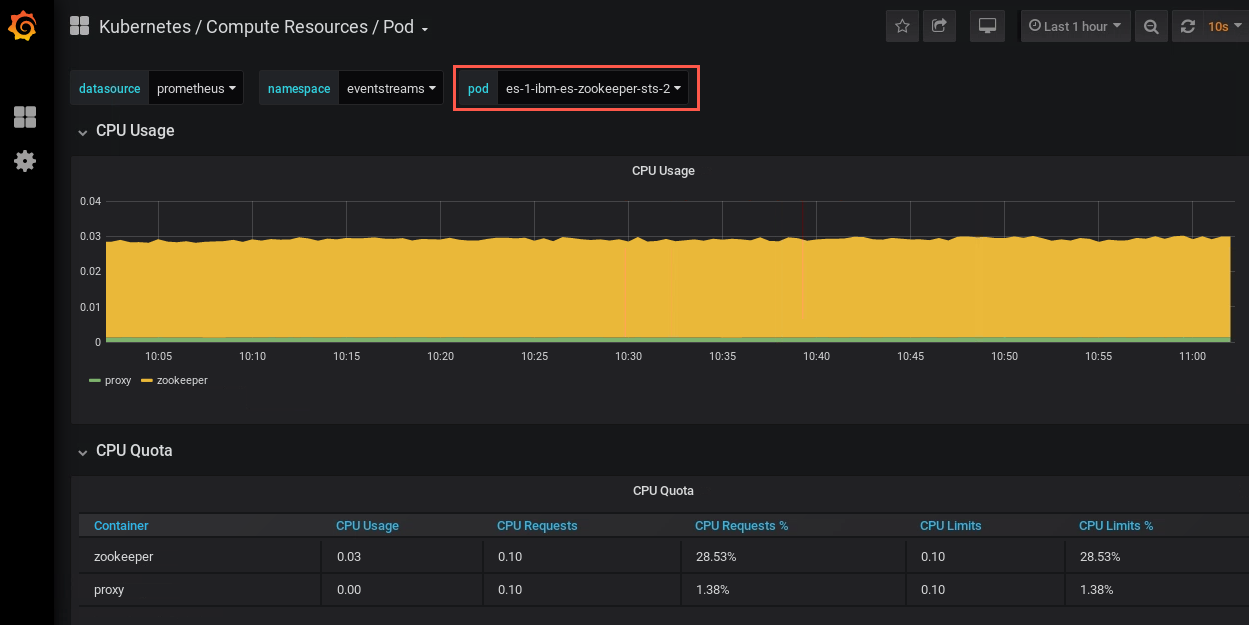
-
Click the pod dropdown and you will see all of the Event Streams pods. Choose one of the broker pods es-1-ibm-es-kafka-sts-0.
There is lots of information here. Right away you see the CPU Usage for everything running in that pod. Remember that pod may have multiple containers. You can see the statistics for each of the containers within the pod.
-
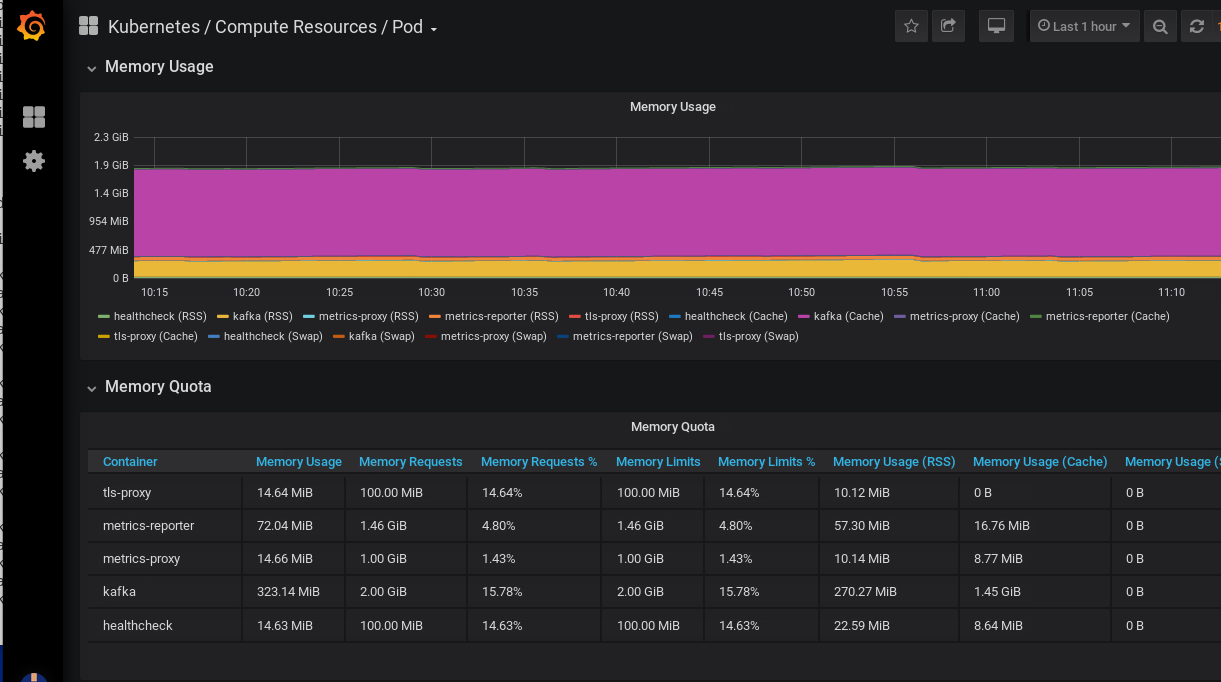
Scroll down where you will see Memory Usage. Hover over the graph and you can see the usage at a specific date and time. This can be helpful in problem determination.
-
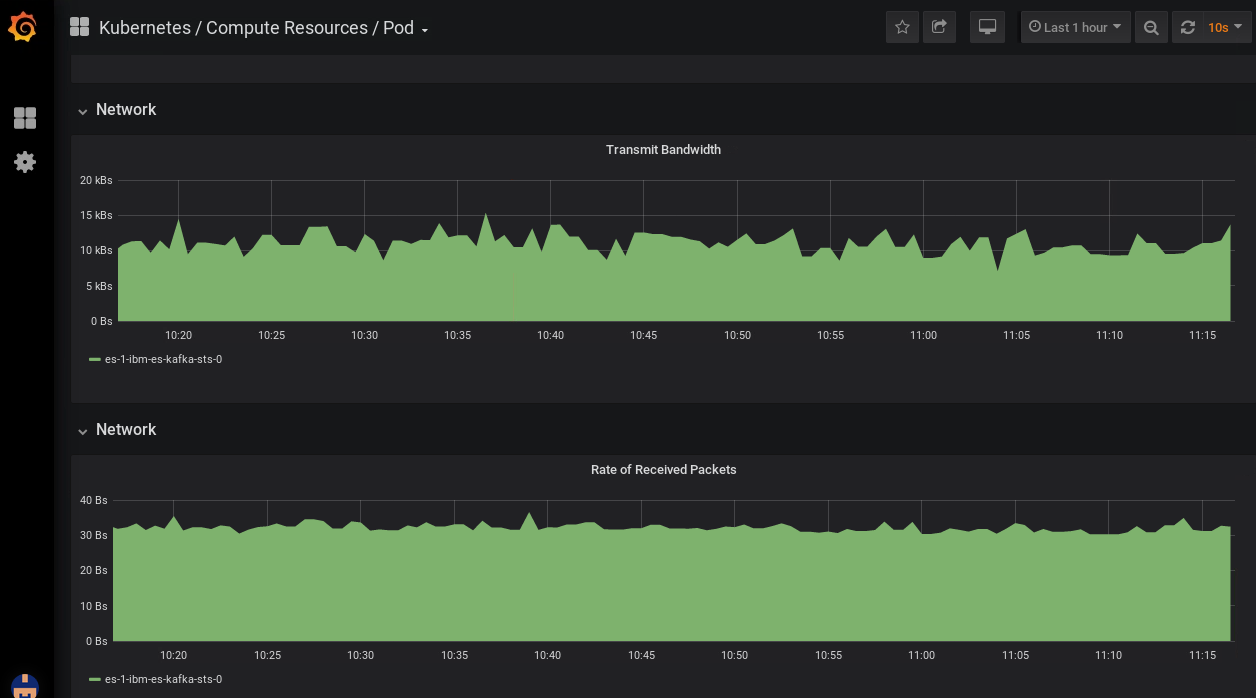
Scroll even further and you will see the Network statistics, separate graphs for transmitting and receiving. This gives you an idea of how much data is being published or consumed. This is just one pod. You can scroll back to the top and choose another pod.
There are other dashboards you may want to explore. Review as many as you want and dig as deep as you have time for.
Congratulations
You have learned how to monitor Event Streams and view the logs.
Continue to Lab 14 - Event Streams Schema Registry
Extra challenge - Problem Determination (if time allows)
If the status display shows that a pod that was not ready, try this solution.
Understand the health of your IBM Event Streams deployment at a glance, and learn how to find information about problems.
The IBM Event Streams UI provides information about the health of your environment at a glance. In the bottom right corner of the UI, a message shows a summary status of the system health. If there are no issues, the message states System is healthy.
If any of the IBM Event Streams resources experience problems, the message states component isn’t ready.
To find out more about the problem:
-
Click the message to expand it, and then expand the section for the component that does not have a green tick next to it.
-
Click the Pod is not ready link to open more details about the problem. The link opens the OCP UI. Log in as an administrator. To understand why the IBM Event Streams resource is not available, click the Events tab to view details about the cause of the problem.
-
For more detailed information about the problem, click the Overview tab, and click More options icon More options > View logs on the right in the Pod details panel.