Lab 4 - Monitoring and Troubleshooting
Monitoring and troubleshooting
VMs required:
- Windows 10 x64
- MQAppl1
Monitoring and reporting
For this lab, you will use one virtual appliance, MQAppl1, and a Windows environment to perform console operations. There are other virtual appliances (MQAppl2, MQAppl3, MQAppl4, MQAppl5, MQAppl6, and MQAppl7)cthat will not be used in this lab. You should suspend them.
You will be exploring some of the options available for monitoring the MQ Appliance using a combination of command line and reporting in the MQ Console. You will also look at how you can implement the use of the application activity trace for the MQ Appliance. Finally, you will see some of the commands available for diagnosing and resolving problems.
Monitoring system resource usage
-
Open the MQAppl1 image, if it is not already running from previous labs, and login (admin / passw0rd) if needed.
Before you investigate the MQ-specific resource monitoring, you will start by monitoring the operation of the appliance itself. You can use the show command to monitor different aspects of the appliance.
You can use the show command to view information about how an aspect of the appliance is configured or to monitor aspects of the appliance operation. The status_provider argument specifies which information you view. The show command is available at login, and in most configuration modes.
There is a large list of status_provider values available for the show command. The complete list can be found in the IBM Documentation for the MQ Appliance.
You will investigate a few of these.
-
If you are at the mqcli command prompt, exit from it.
-
First, enter the show command. This will give a list of all of the available status_provider values.
Important:
For this lab the appliance clock should be synchronized with the Windows desktop VM time. Automatic time sync is not available on the Skytap virtual MQ Appliances. Therefore the time on the appliance will start from the time the VM was last shut down or suspended. You should make sure the appliance time is in sync with the Windows desktop VM time. Use the “show clock” to display the time. If it doesn’t match, use the “clock” command to set the appliance time to sync with the Windows time. -
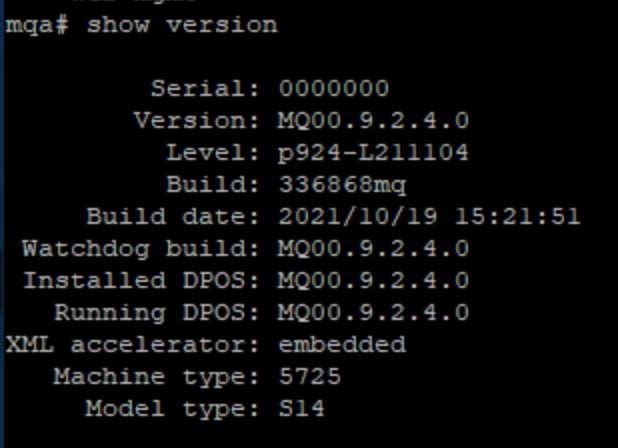
Now enter show version. This will show the firmware and library version, similar to what is shown below.
One of the other things that you can find out from the show command is which users have been defined for the appliance.
-
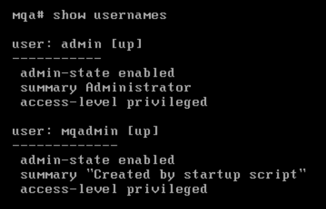
Enter show usernames
-
You should see two users: the admin user, which was pre-configured, and the user that you set up in the first lab as the user authorized to reset passwords.
-
You can also use the show command to give a list of logged-on users. Enter show users.
You can see below that the admin user is logged on via the serial port (which is you entering commands in to the console) and also logged on to the MQ Console (if you are not logged on, log on to the MQ Console [web admin] and rerun the command).

-
Next, get monitoring information about the MQ environment on the appliance.
Go to the MQ command line interface.
mqcli -
Using dspmq, verify that the QM1 from the first lab is running. If the queue manager is not running, start it.

You will now use the status command to view information about resource allocation.
Note:
About the status command:
You can use the status command to view the following information about the system resources on the appliance:
* the size and usage of the system memory of the system
* the CPU usage of the system, the size and usage of the internal disk
* the size and usage of the system volume
* the number of FDCs and the disk space used
* the disk space used by trace -
Enter the command: status
You will see a response similar to the following:
 Note:
Note:
More about the status command:
You can also use the status command to view the following information about the system resources that are used by a queue manager:
* the queue manager name
* the queue manager status
* an estimate of the CPU usage of the queue manager
* an estimate of the memory usage of the queue manager
* the amount of the queue manager file system used by the queue manager
For a high availability queue manager, additional information can be viewed:
* the file system size for the queue manager
* the replication status of the queue managers
* the preferred appliance for the queue manager
* whether a partitioned situation has been detected
* if detected, the amount of ‘out-of-sync’ data held -
Enter the status command for QM1:
status QM1 -
You should see a response similar to the following:

You can use the amqsrua command to query metadata that is related to the system resource usage of a queue manager.
Note:
About amqsrua:
The amqsrua command reports metadata that is published by queue managers. This data can include information about the CPU, memory, and disk usage. You can also see data equivalent to the STATMQI PCF statistics data. The data is published every 10 seconds and is reported while the command runs.
* -n MaxPubs – Specifies how many reports are returned before the command ends. The command publishes data every ten seconds, so if you enter a value of 50, the command returns 50 reports over 500 seconds.
If you do not specify this parameter, the command runs until either an error occurs, or the queue manager shuts down.
* -m QMgrName – Specifies the name of the queue manager that you want to query. The queue manager must be running. If you do not specify a queue manager name, the default queue manager is used.
-
You are going to report the metadata for a minute, while putting some messages on the TEST.IN queue from the first lab, and see the results.
-
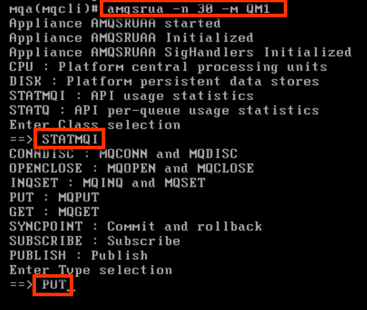
Enter the command as follows:
amqsrua -n 30 -m QM1with the following responses:
STATMQI for the Class selection and PUT for the Type selection.
-
Either go to the MQ Console or to the MQ Explorer (in the Windows image) and put some messages on the TEST.IN queue.
-
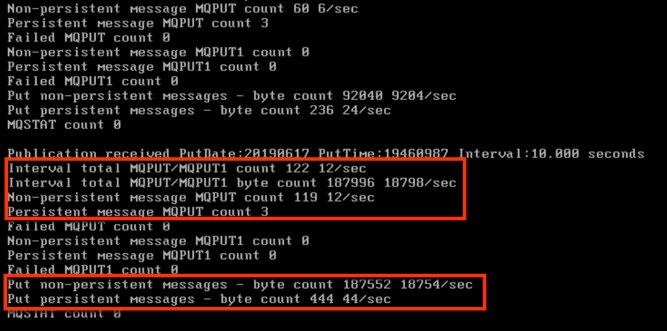
Depending on which method you use, and how many messages you put on the queue, you will see results similar to the following:
-
Enter CTRL-C to end the amqsrua command.
-
Now you will move on to the MQ Console and see some of the reports that you can generate.
If you are not already logged on to the MQ Console on the Windows VM, do so now.
-
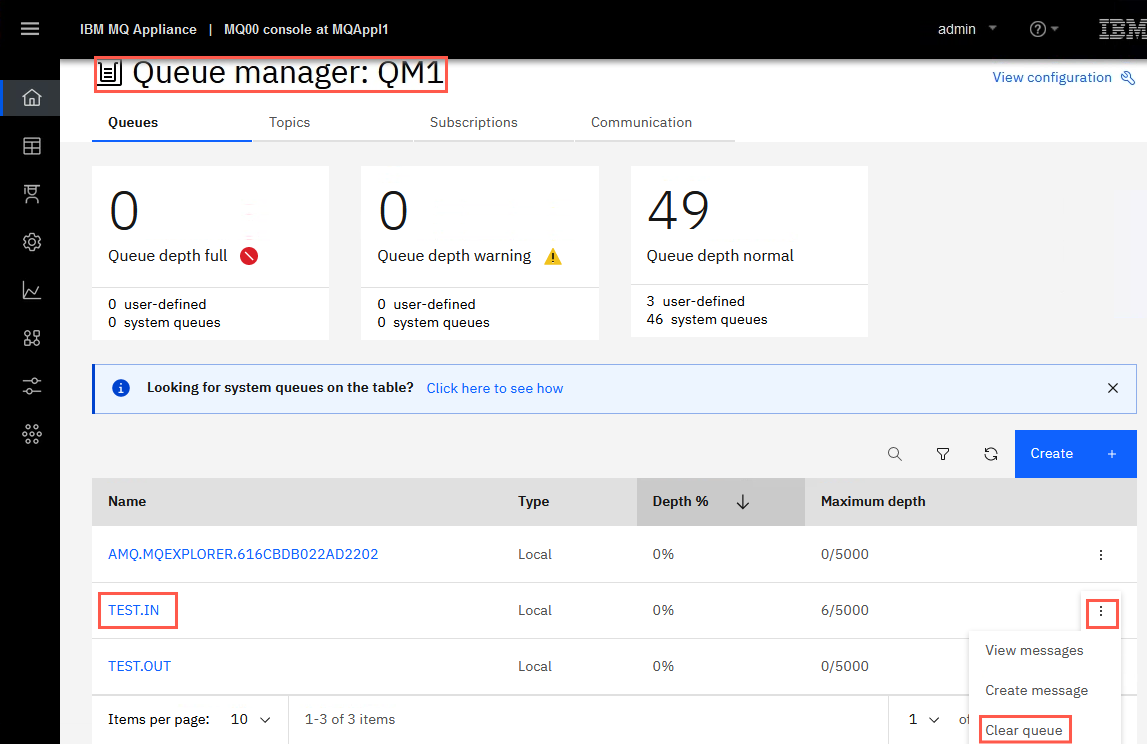
Return to the MQ Console > Manage > QM1. Click the elipsis on far right for the TEST.IN queue and select Clear queue.
-
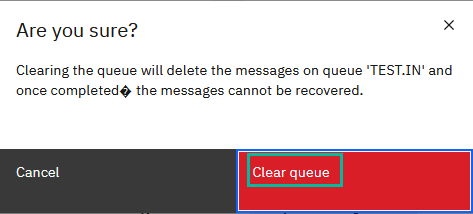
Click Clear queue to confirm deletion of the messages.
Resource Monitoring
As you are monitoring persistent messages, you need to ensure that the default persistence on the queue is set to persistent, because the MQ Console will put the message using persistent as per the queue definition.
-
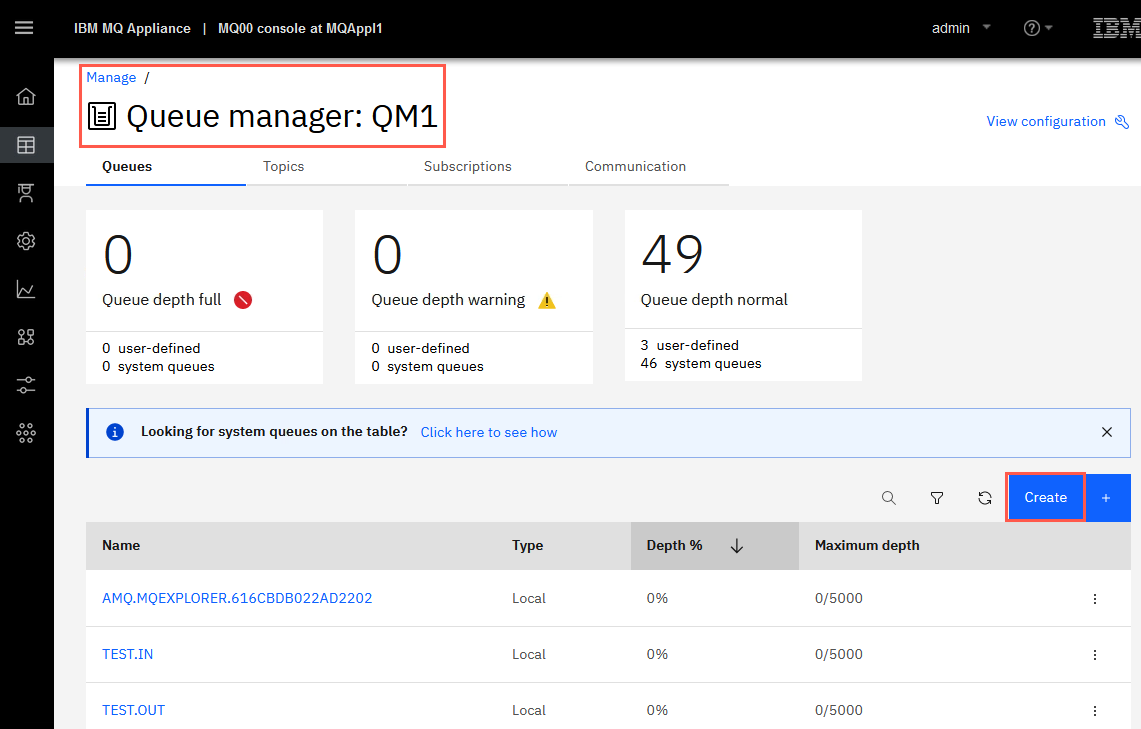
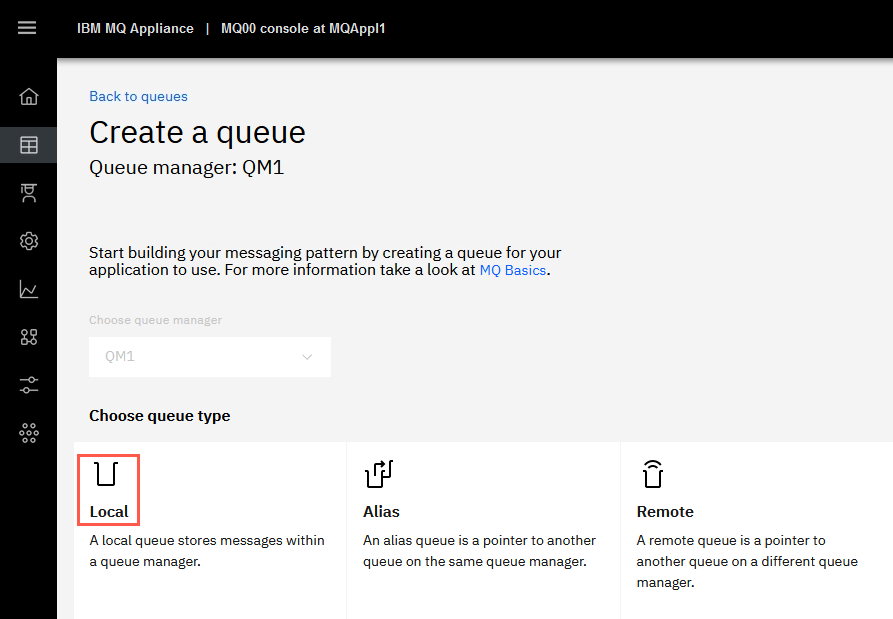
As we already have all of the connectivity for this test set up for QM1, go to the MQ console and create a new local queue on QM1 named MONITOR.
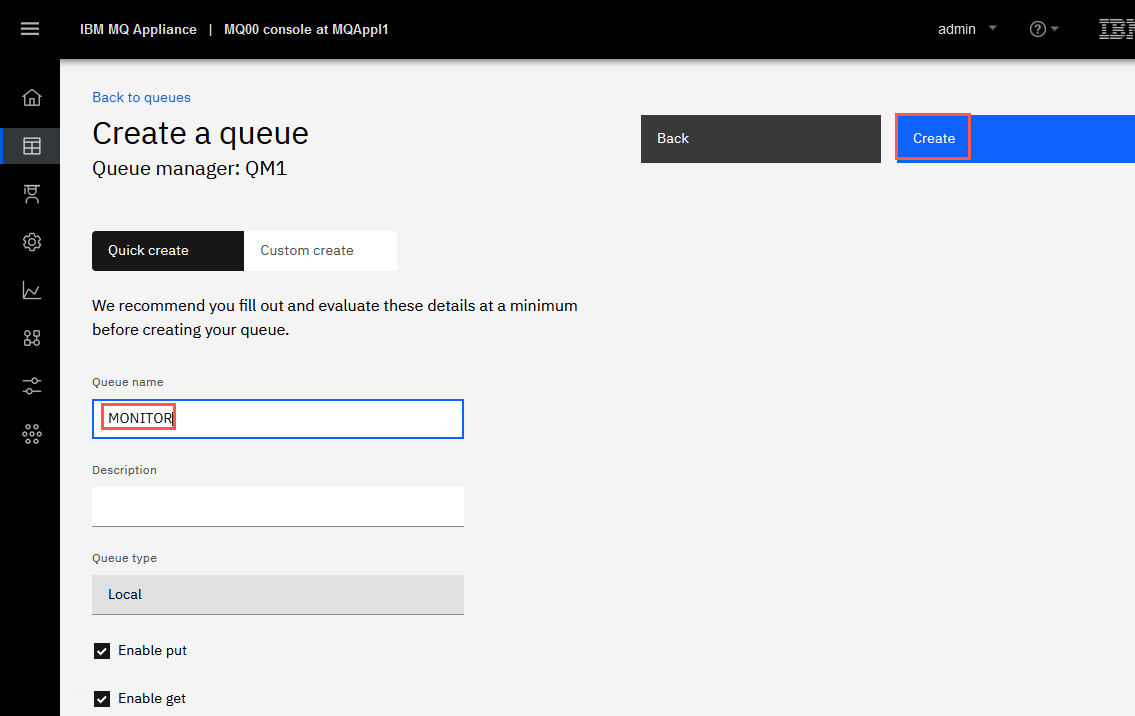
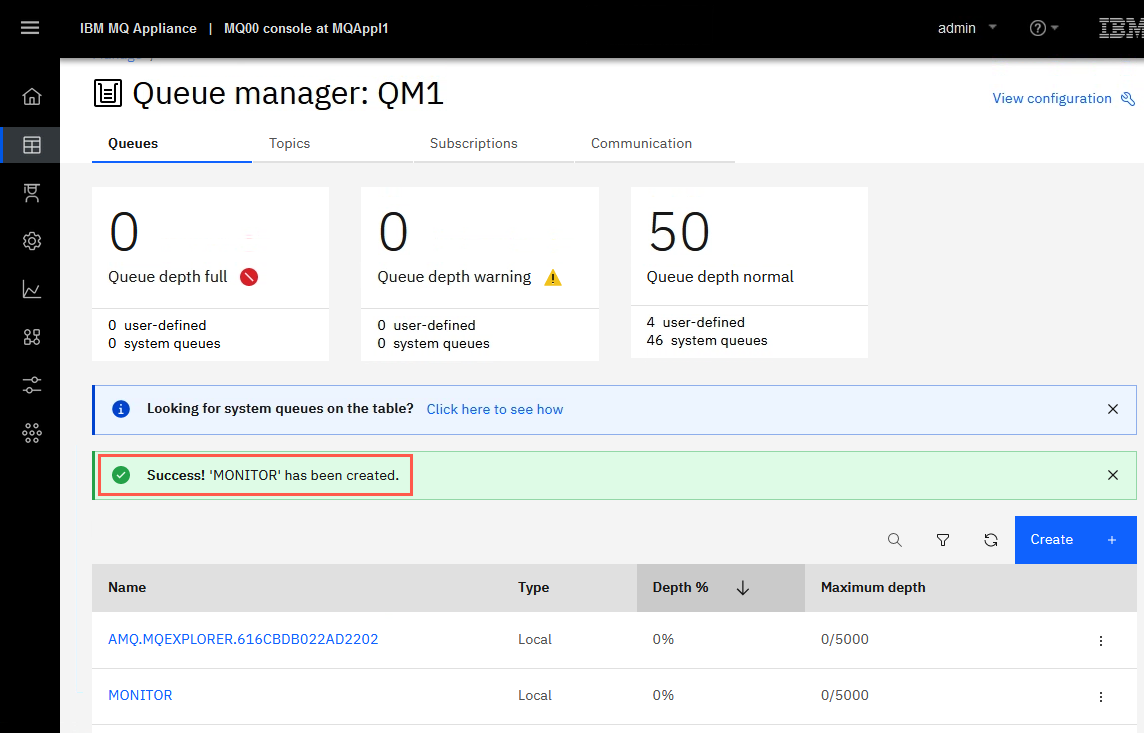
-
Open the Properties of the MONITOR queue and change the default persistence to Persistent if it is not already set to that. Click Save.
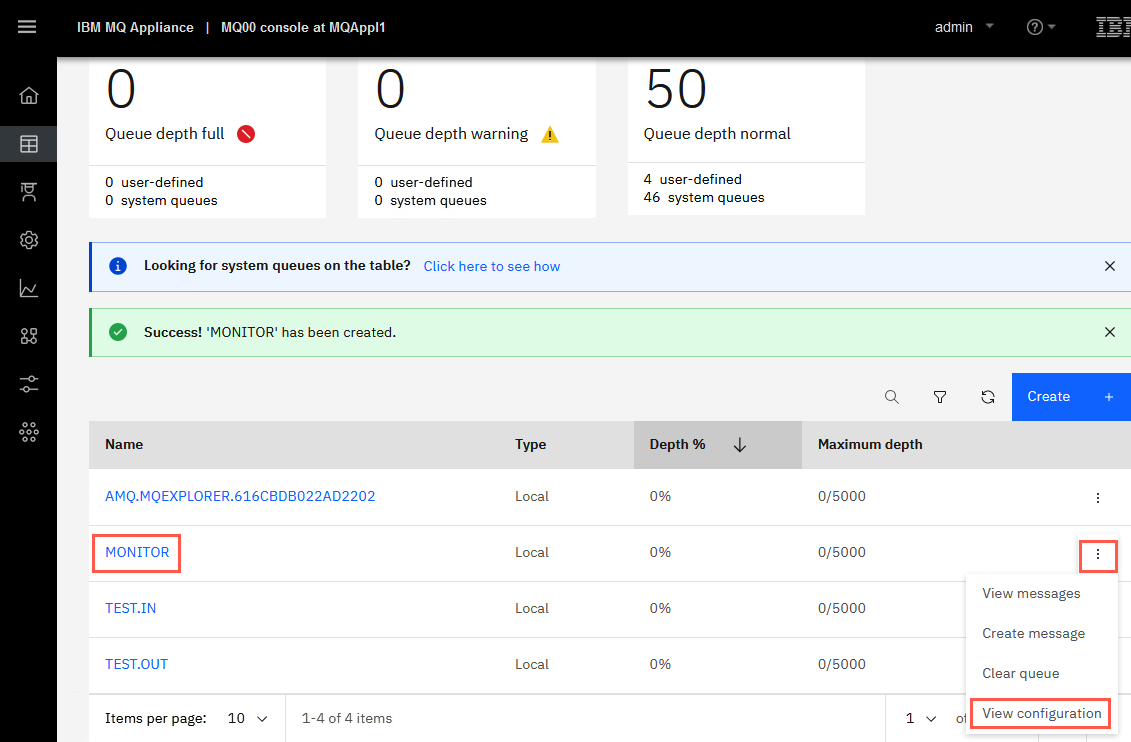
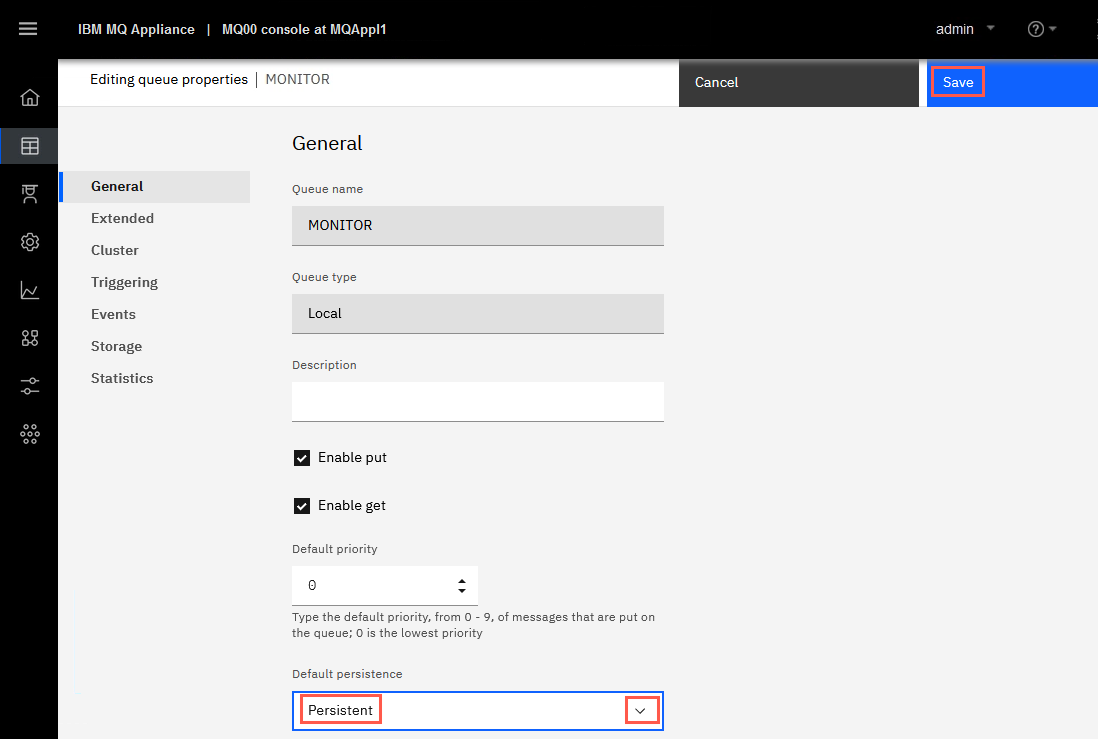
-
As you saw in lab 1, some files and programs should have been provided in the perf folder. These will again be used for this part of the lab. The applications are part of SupportPac IH03.
-
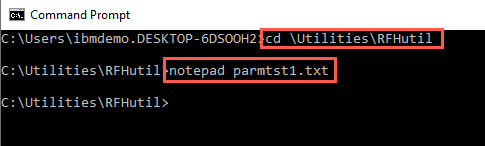
Go back to the command window you used earlier. If you closed it, open a Command Prompt window and change to the C:\utilities\RFHutil\ directory.
Open the parmtst1.txt parameters file in your favorite text editor, such as notepad.
-
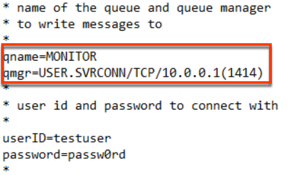
Change the qmgr parameter to:
USER.SVRCONN/TCP/10.0.0.1(1414)
-
Change the qname parameter to MONITOR.
-
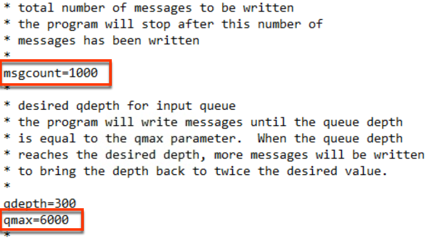
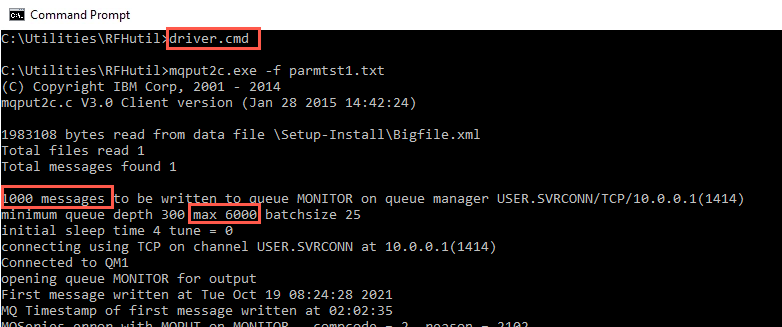
Change the msgcount to 1000 and change the qmax to 6000.
-
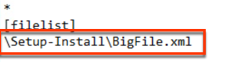
Go to the bottom of the file and change the file in the [filelist] to \Setup-Install\BigFile.xml
-
Save the file (Ctrl+S).
-
Close the editor (notepad) session.
-
Go back to the command window.
-
Execute the driver.cmd file.
You will notice once the program starts that the queue depth settings are as follows:
-
Below is the output from the example we have just run. You may not get the same result. If you did not receive an error, you may wish to increase the number of messages in the parmtst1.txt and rerun the driver.cmd.
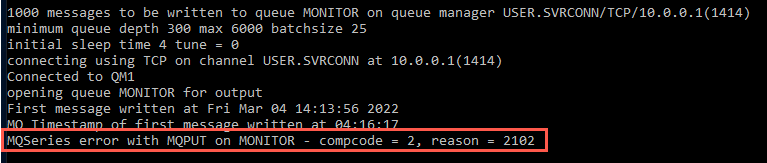
You have received an MQ error on the MONITOR queue. The reason code is 2102. If the script did not end, hit CTRL-C to end the job and reply Y to confirm. Make a note of the time the error occurred.
Enter the following command to determine what the error means:
mqrc 2102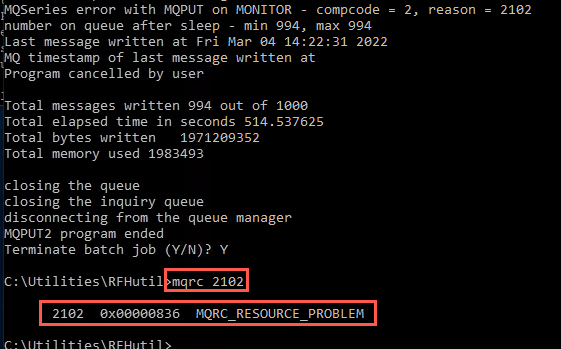
-
Oops! You have run out of space for the queue manager!!! This is not likely to happen on a real appliance but you may recall that we have a very small queue manager file system size on our appliance).
-
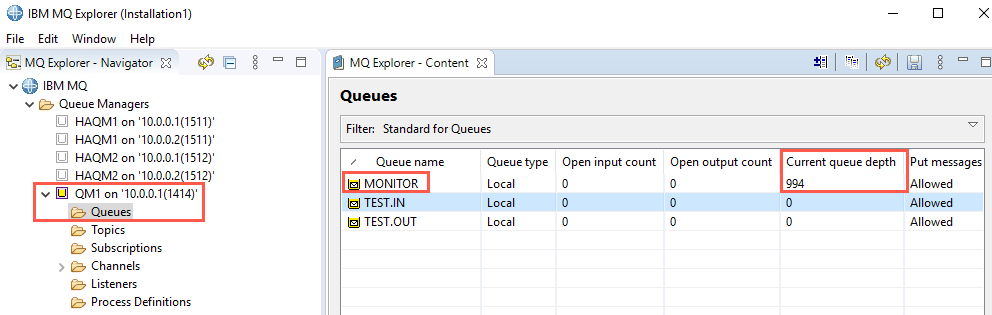
Go back to the MQ Explorer. Here you see the thousand (probably 994) messages you have just put on the queue. There may be more if you did not clear out messages from previous tests.
-
Clear the messages from the MONITOR queue on QM1.
-
In the next section, Troubleshooting, you will check the MQ logs to find the error.
Troubleshooting
As the last section of this lab, you will review the logs that are available for troubleshooting. The MQ Appliance has a set of logs similar to traditional MQ. In this section, you will understand where they are stored on the MQ Appliance and how to access them.
First, look at where the MQ error logs are stored.
-
On the MQAppl1 appliance command line, exit from any command if necessary and then exit from mqcli. This will take you back to the mqa# prompt.
-
Enter the config command to take you into configuration mode.
config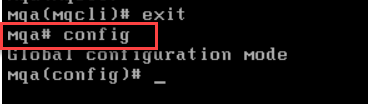
Directory structures on the appliance are accessible in the form of URIs. There is a dedicated URI, mqerr, for accessing IBM MQ logs.
-
Enter the following command (make sure you put the colon at the end).
dir mqerr: -
You will see the structure of the log directories.
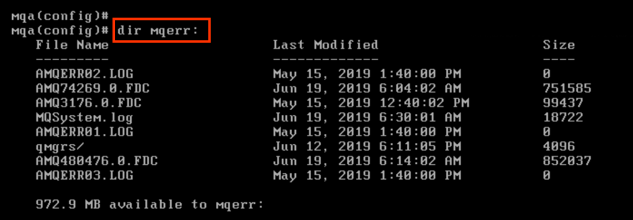
-
Enter the following command to see the QM1 queue manager logs. These will be familiar to anyone familiar with MQ:
dir mqerr:qmgrs/QM1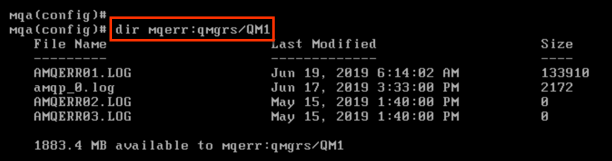
-
Enter exit to exit configuration mode.
-
Go to the MQ command line interface – enter mqcli.
You can list or view the system error logs, queue manager error logs, and first failure data captures (FDCs) by using the dspmqerr command.
-
Enter:
help dspmqerr -
This will list the options available for viewing the logs.
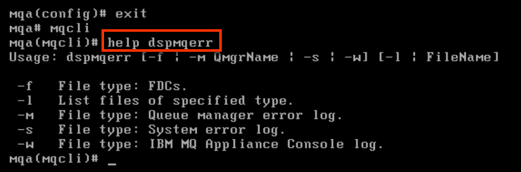 Note:
Note:
About dspmqerr:
The command is based on the UNIX less command. The less command provides controls for navigating the contents of a file, and you can use these controls when you view system error logs.:
Try the following tips:
* Use the arrow keys to scroll up and down the logs
* Use the page, space, or return keys for simple scrolling
* Enter q to exit at any time
* Enter h to display full help while you view a log. The help lists further commands, for example, for searching for strings or jumping a set number of lines. -
Look at the AMQERR01.LOG for QM1. Enter:
dspmqerr -m QM1 AMQERR01.LOG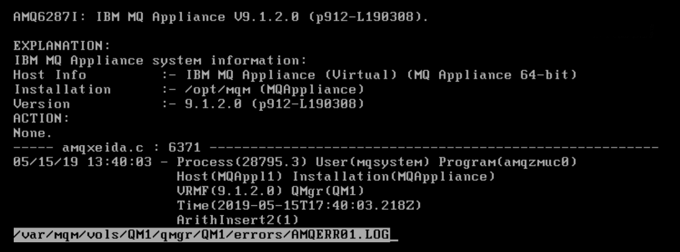
-
Review the log entries. Hold the space bar down to scroll to the end. When you ran the test you received an error for filling the MONITOR queue. You should see FDCs created at the end of the log. Notice that they were due to the write command.
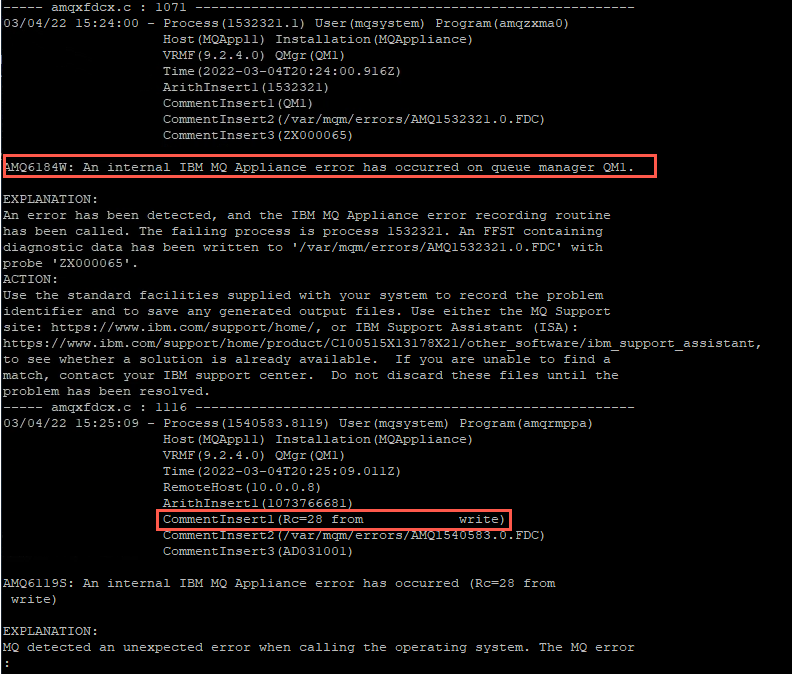
-
When done reviewing the log, enter q.
-
Enter this command to see the system log.
dspmqerr -s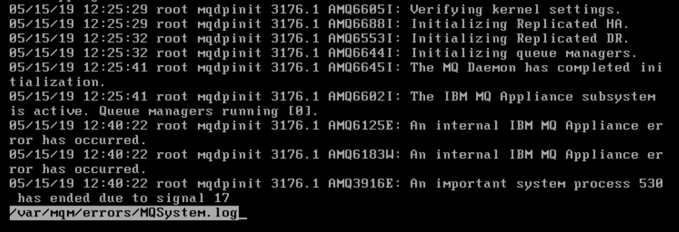
-
When done reviewing the log, enter q.
-
It is possible to copy the error logs from the MQ Appliance. This is done from the configuration mode (the config prompt) using the copy command or from the MQ Console (using the File Management option).
We can also perform most of the file operations from the console. You did this in the Console lab – if you did not get to it, take some time now to go back and complete the “tour” of the files.
You can also run strmqtrc from the command line interface, and after, the endmqtrc command. The trace files (AMQppppp.qq.TRC) can also be copied from the MQ Appliance.
copy command:
You will not be doing this in the lab; however, the command can be used as follows:
https://www.ibm.com/docs/en/mq-appliance/9.2?topic=commands-copy
Congratulations
This concludes the Monitoring and troubleshooting lab.